that tabu search clearly outperforms simulated annealing. The paper is divided into 4 sections. Section 2 introduces the partitioning steps, the metric values, and ...
Hardware/Software Partitioning with Iterative Improvement Heuristics
Petru Eles1,2, Zebo Peng1, Krzysztof Kuchcinski1, and Alexa Doboli2 1
Dept. of Computer and Information Science Linköping University Sweden
Abstract The paper presents two heuristics for hardware/software partitioning of system level specifications. The main objective is to achieve performance optimization with a limited hardware and software cost. We consider minimization of communication cost and improvement of the overall parallelism as essential criteria. One of the heuristics is based on simulated annealing and the other on tabu search. Experiments show the superiority of the tabu search based algorithm.
1. Introduction Satisfaction of performance requirements for embedded systems can frequently be achieved only by hardware implementation of some system components. Selection of the appropriate part of the system for hardware and software implementation respectively has a crucial impact both on the cost and the overall performance of the final product. Several approaches have been presented in the literature for the partitioning of hardware/software systems. In [6, 8, 13, 16] automatic partitioning is performed, while the approach presented in [1] is based on manual partitioning. Partitioning at a fine grained level is performed in [6, 8]. In [9, 16] partitioning is performed at a coarser granularity. Iterative improvement algorithms based on neighborhood search are widely used for hardware/software partitioning. In order to avoid being trapped in a local minimum heuristics are implemented which very often are based on simulated annealing [6, 14]. This is mainly due to the fact that simulated annealing algorithms can be quickly implemented and are widely applicable to many different problems. In [16] a hardware/software partitioning algorithm is proposed which combines a hill climbing heuristic with binary search algorithm. It minimizes hardware cost while satisfying certain performance constraints. This differs from our approach which tries to maximize performance under given cost constraints. The partitioning strategy presented in [9] combines a greedy algorithm with an outer loop algorithm which takes into account global measures. This approach is based on knowledge of execution times for each task and of communication times. This imposes hard restrictions on the
2 Computer
Science and Engineering Department Technical University of Timisoara Romania
features of the system specifications accepted as input. In our approach we do not necessarily impose such limitations, considering more general applications which have to be accelerated by hardware implementation of some components. Our design environment accepts as input a system level, implementation independent specification of an application. The synthesized system has to produce maximal performance, using a given amount of hardware and software resources. Automatic partitioning at a coarse grain level (process, loop, subprogram, block) is based on metric values derived from profiling, static analysis of the specification, and cost estimations. We consider that minimization of communication cost between the software and the hardware partition and improvement of the overall parallelism are of outstanding importance. We have implemented first a simulated annealing based algorithm for hardware/software partitioning. We then implemented our partitioning algorithm using the tabu search method. Based on extensive experiments we show that tabu search clearly outperforms simulated annealing. The paper is divided into 4 sections. Section 2 introduces the partitioning steps, the metric values, and the proposed cost function. In section 3 we discuss our simulated annealing and tabu search based partitioning heuristics, and evaluate their performance. Finally, section 4 presents the conclusions.
2. Partitioning Steps and the Cost Function The input specification accepted by our co-synthesis environment describes system functionality without prescribing the hardware/software boundary or implementation details. The basic assumption is that this specification is formulated as a set of processes interacting via messages transmitted through communication channels. We also assume that the specification is executable and that profiling information can be generated. The current implementation accepts input designs specified in VHDL [3]. When the final partitioning is done, the hardware implementation is synthesized by the CAMAD high-level synthesis system [15] while the software is generated by a compiler. We have made the following assumptions concerning the target architecture: 1. There is a single microprocessor executing the software part;
2. The microprocessor and the hardware coprocessor are working in parallel; 3. Reducing the amount of communication between the microprocessor and the hardware coprocessor improves the overall performance of the system. The partitioning algorithm generates as output a model consisting of two sets of processes which are the candidates for hardware and software implementation respectively. The main goal of partitioning is to maximize performance in terms of execution speed. In order to achieve this we try to distribute functionality between the software and the hardware partitions taking also into account communication cost and overall parallelism of the synthesized system. Thus, the following three objectives are considered: 1. To identify basic regions (processes, subprograms, loops, and blocks of statements) responsible for most of the execution time, in order to be assigned to hardware; 2. To minimize communication between partitions; 3. To increase parallelism within the resulted system at the following three levels: - internal parallelism of each process assigned to hardware; - parallelism between processes assigned to hardware; - parallelism between the hardware and the microprocessor. The partitioning algorithm takes into account simulation statistics, information from static analysis of the source specification, and cost estimations. Two types of simulation statistics are used for partitioning: 1. Computation load (CL) of a basic region is a quantitative measure of the total computation executed by that region, considering all its activations during the simulation process. It is expressed as the total number of operations (at the level of internal representation) executed inside that region, where each operation is weighted with a coefficient depending on its relative complexity [5]. The relative computation load (RCL) of a block of statements, loop, or a subprogram is the computation load of the respective basic region divided by the computation load of the process the region belongs to. The RCL of a process is the computation load of that process divided by the total computation load of the system. 2. Communication intensity (CI) on a channel connecting two processes is expressed as the total number of send operations executed on the respective channel.
2. 1. The Partitioning Steps Hardware/software partitioning is performed in four steps: 1. Extraction of basic regions: During the first partitioning step processes are examined individually to identify regions that are responsible for most of the execution time spent inside a process. Candidate regions are typically loops and subprograms, but can also be blocks of statements with a high CL. When a region has been identified for extraction, a new process is built to have the functionality of
the original block, loop, or subprogram and communication channels are established to the parent process. In [4] we show how extraction of critical regions and process generation is solved in our current implementation. 2. Process graph generation. 3. Partitioning of the process graph. 4. Process merging: During the first step one or several child processes are possibly extracted from a parent process. If, as result of step 3, some of the child processes are assigned to the same partition with their parent process, they are, optionally, merged back together.
2. 2. The Process Graph The data structure on which hardware/software partitioning is performed is the process graph. Each node in this graph corresponds to a process and an edge connects two nodes if and only if there exists at least one direct communication channel between the corresponding processes. The graph partitioning algorithm takes into account weights associated to each node and edge. Node weights reflect the degree of suitability for hardware implementation of the corresponding process. Edge weights measure communication and mutual synchronization between processes. The weights capture simulation statistics and information extracted from static analysis of the system specification or of the internal representation resulted after its compilation. The following data extracted from static analysis are captured: Nr_opi: total number of operations in process i; Nr_kind_opi: number of different operations in process i; L_pathi: length of the critical path (in terms of data dependency) through process i. The weight assigned to process nodei, has two components. N The first one, W1 i , is equal to the CL of the respective process. The second one is calculated by the following formula: W2 iN =M CL × K iCL + M U × K iU + M P × K iP – M SO × K iSO ; where: CL
is equal to the RCL of process i, and thus is a measure of the computation load; Ki
Nr_op i U K i = ----------------------------- ; Nr_kind_op i
U
is a measure of the unifor-
Ki
mity of operations in process i; Nr_op P P K i = -----------------i- ; K i is a measure of the potential parL_path i
allelism inside process i; SO Ki
∑
op j ∈ SP i
w op
j
= ----------------------------- ; Nr_op i
SO
Ki
captures the suitability of
operations of process i for software implementation. SPi is the set of such operations in process i and w op is a j weight associated to operation opj, measuring the degree to which the operation has to be implemented in software. The relation between the above-named coefficients KCL, U K , KP, KSO is regulated by four different weight-multipliers MCL, MU, MP, and MSO, controlled by the designer. Both components of the weight assigned to an edge con-
necting nodes i and j depend on the amount of communication between processes i and j. The first one is a measure of the total data quantity transferred between the two processes. The second one does not consider the number of bits transferred but only the degree of synchronization between the processes, expressed in the total number of mutual interactions they are involved in: E E W1 ij = ∑ wd c × CI c ; W2 ij = ∑ CI c ; c k ∈ Ch ij
k
k
c k ∈ Ch ij
k
where Chij is the set of channels used for communication between processes i and j; wd c is the width of channel ck in k bits; CI c is the communication intensity on channel ck. k
increasing the difference between the average weight of nodes in the two partitions. This is a basic objective of partitioning as it places time critical regions into hardware. The criteria combined in the cost function are not orthogonal, and sometimes compete with each other. This competition between partitioning objectives is controlled by the designer through the cost multipliers Q1, Q2, and Q3. Minimization of the cost function has to be performed in the context of certain constraints. Thus, our heuristics have to produce a partitioning with a minimum for C(Hw, Sw) so that the total hardware and software cost is within some specified limits: H S ∑ H_costi ≤ Max ; ∑ S_costi ≤ Max . ( i ) ∈ Hw
2. 3. Cost Function and Constraints After generation of the process graph hardware/software partitioning can be performed as a graph partitioning task. The partitioning information, captured as weights associated to the nodes and edges, have to be combined into a cost function which guides the partitioning algorithm towards the desired objective. Our hardware/software partitioning heuristics are guided by the following cost function which is to be minimized:
∑ W2ij
( i ) ∈ Sw
Cost estimation has to be performed before graph partitioning. In the current implementation of our environment, the CAMAD high level synthesis system [15] produces hardware cost estimations in terms of design area. Software cost, in terms of memory size, is estimated for each process through compilation by our VHDL to C compiler.
3. Process Graph Partitioning
E
∑ --------------------N ( i ) ∈ Hw W1 i E C(Hw,Sw) = Q1 × ∑ W1 ij + Q2 × -----------------------------------------NH ( ij ) ∈ cut ∃ ( ij )
N N ∑ W2i ∑ W2 i i ∈ Hw i ∈ Sw – Q3 × ------------------------- – ------------------------ ; where: NH NS
Hw and Sw are sets representing the hardware and the software partition respectively; NH and NS are the cardinality of the two sets; cut is the set of edges connecting the two partitions; (ij) is the edge connecting nodes i and j; (i) represents node i. The partitioning objectives stated at the beginning of section 2 are captured by the three terms of the cost function: - The first term captures the amount of communication between hardware and software partition. Decreasing this component reduces communication cost and also improves parallelism between processes in the hardware partition and those implemented in software. - The second term stimulates placement into hardware of processes which have a reduced amount of interaction with the rest of the system relative to their computation load and, thus, are active most of the time. This strategy improves parallelism between processes inside the hardware partition where physical resources are allocated for real parallel exeE N cution. For a given process i, ∑ W2 ij ⁄ W1 i is the total
∃ ( ij )
amount of interaction the process is involved in, relative to its computation load. The whole term represents the average of this value over the nodes in the hardware partition. - The third term in the cost function pushes processes with a high node weight into the hardware partition and those with a low node weight into the software one, by
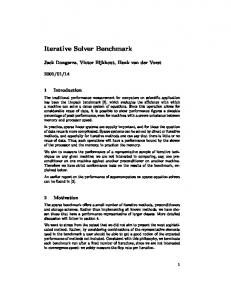
Hardware/software partitioning, formulated as a graph partitioning problem, is NP-complete. In order to efficiently explore the solution space, heuristics have to be developed which hopefully converge towards an optimal or near-optimal solution. We have implemented two such algorithms, one based on simulated annealing (SA) and the other on tabu search (TS). For evaluation of the partitioning algorithms we used random and geometric graphs [17] generated for experimental purpose, and graphs resulted from compilation of real-life examples. We generated for experiments 32 graphs altogether, 16 random and 16 geometric. 8 graphs (4 random, 4 geometric) have been generated for each dimension of 20, 40, 100, and 400 nodes. The generation of these graphs and their characteristics are presented in [5]. Experiments have been carried out in order to tune the algorithms for each graph dimension so that partitioning converges with a high probability towards an optimum for all test graphs of the given dimension and the run time is minimized. It still has to be clarified what we call an optimum in this context. For the 20 node graphs it was possible to run exhaustive search to get the real optimum which we later used as a reference value. For each of the other graphs we performed, in preparation of the experiments, very long and expensive runs using both SA and TS. We used aggressively very long cooling schedules, for SA, and a high number of restarting tours, for TS (see sections 3.1 and 3.2). These runs have been performed starting with different initial configurations and finally the best ever solution produced for each graph has been considered as the optimum for the further experiments. During experiments with SA an additional difficulty originates from the random nature of this algorithm. The same implementation with unchanged parameters can pro-
Step 1. Construct initial configuration xnow:=(Hw0, Sw0) Step 2. Initialize Temperature T:=TI Step 3. 3.1. for i:=1 to TL do Generate randomly a neighboring solution x´ ∈ N(xnow) Compute change of cost function ∆C := C(x´) - C(xnow) if ∆C ≤ 0 then xnow:= x´ else Generate q:=random(0,1) if q < e-∆C/T then xnow:= x´ 3.2. Set new temperature T:= α * T Step 4. if stopping criterium not met then goto Step 3 Step 5. return solution corresponding to the minimum cost function
Fig. 1. Simulated annealing algorithm duce different results, for the same graph, in different runs. We considered that a certain configuration of parameters produces an optimum for a graph if for 100 consecutive runs of the SA algorithm we got each time the optimal partitioning. All experiments presented were run on SPARCstation 10.
3. 1. Partitioning with Simulated Annealing Simulated annealing selects a neighboring solution randomly and always accepts an improved solution. It also accepts worse solutions with a certain probability that depends on the deterioration of the cost function and on a control parameter called temperature [11]. In Fig. 1 we give a short description of the algorithm. With x we denote one solution consisting of the two sets Hw and Sw. xnow represents the current solution and N(xnow) denotes the neighborhood of xnow in the solution space. For implementation of this algorithm the parameters TI (initial temperature), TL (temperature length), α (cooling ratio), and the stopping criterium have to be determined. They define the so called cooling schedule and have a decisive impact on the quality of partitioning and the CPU time consumed. As result of our experiments we determined for each graph dimension values for TI, TL, and α so that an optimal partitioning for each graph with the respective number of nodes is produced [5]. The algorithm terminates when for three consecutive temperatures no new solution has been accepted. For the generation of a new solution x´, starting from the current one xnow, we implemented two strategies: the simple move (SM) and the improved move (IM). For the SM a node is randomly selected and moved to the other partition. The configuration resulted after this move becomes the candidate solution x´. Random node selection is repeated if transfer of the selected node violates some design constraints. The IM accelerates convergence by moving, together with the randomly selected node, also some of its direct neighbors (nodes which are in the same partition with the selected one and are directly connected to it). A direct neighbor is moved together with the selected node if this movement improves the cost function and does not violate any constraint. This strategy stimulates transfer of connected node groups instead of individual nodes. Experiments revealed a negative side effect of this strategy: the repeated move of the same or similar node groups from
TABLE 1: Partitioning time with SA nr. of nodes 20 40 100 400
CPU time (s) speedup SM IM 0.28 0.23 22% 1.57 1.27 24% 7.88 2.33 238% 4036 769 425%
TABLE 2: Parameters and CPU time with TS nr. of nodes 20 40 100 400
τ Nr_f_b Nr_r 7 7 7 18
30 50 50 850
0 0 0 2
CPU time (s) 0.008 0.04 0.19 30.5
one partition to the other, which resulted in a reduction of the spectrum of visited solutions. To produce an optimal exploration of the solution space we combined movement of node groups with that of individual nodes: nodes are moved in groups with a certain probability p. After analysis of experimental results the value for p was fixed at 0.75. Partitioning times and the speedup produced by the improved strategy are presented in Table 1. The times shown are the average CPU time needed for optimal partitioning for all graphs of the given dimension.
3. 2. Partitioning with Tabu Search By contrast to simulated annealing, tabu search controls uphill moves not purely randomly but in an intelligent way [7]. Two key elements of the TS algorithm are the data structures called short and long term memory. Short term memory stores information relative to the most recent history of the search. It is used in order to avoid cycling that could occur if a certain move returns to a recently visited solution. Long term memory, on the other side, stores information on the global evolution of the algorithm. These are typically frequency measures relative to the occurrence of a certain event. They can be applied to perform diversification which is used to improve exploration of the solution space by broadening the spectrum of visited solutions. In Fig. 2 we give a brief description of our implementation of the TS algorithm. In the first attempt an improving move is tried. If no such move exists (or it is tabu and not aspirated) frequency based penalties are applied to the cost function and the best possible non tabu move is performed; this move can be an uphill step. Finally, in a last attempt, the move which is closest to leave the tabu state is executed. We consider as a candidate solution xk the configuration obtained from xnow by moving node k from its current partition to the other one, if this movement does not violate any constraints. In the tabu list we store the list of the reverse moves of the last τ moves performed, which are considered as being forbidden (tabu). The size τ of this list (the tabu tenure) is an essential parameter of the algorithm. In Table 2 we present the optimal values for τ as resulted from our experiments. Under certain circumstances it can be useful to ignore the tabu character of a move (the tabu is aspirated). We ignore the tabu status of a move if the solution produced is better than the best obtained so far.
Fig. 2. Tabu search algorithm Three means of improving the search strategy by diversification have been implemented: 1. For the second attempt to generate a new configuration, moves are ordered according to a penalized cost function which favors the transfer of nodes that have spent a long time in their current partition:
∑ ∆Ci
i - × pen ( k ) ; where ∆C' k = ∆C k + -----------------------------Nr_of_nodes Node_in_Hw k – C H × ---------------------------------if node k ∈ Hw N iter pen ( k ) = Node_in_Hw – C × 1 – ---------------------------------k- if node k ∈ Sw S N iter
Node_in_Hwk is the number of iterations node k spent in the hardware partition; Niter is the total number of iterations; Nr_of_nodes is the total number of nodes; Coefficients have been experimentally set to CH=0.4 and CS=0.15. 2. We consider a move as forbidden (tabu) if the frequency of the node in its current partition is smaller than a certain threshold; thus, a move of node k can be accepted if: Node_in_Hw k ---------------------------------- > T H N iter Node_in_Hw 1 – ---------------------------------k- > T S N iter
if node k ∈ Hw if node k ∈ Sw
Thresholds have been experimentally set toTH=0.2, TS=0.4. 3. If the system is frozen (more than Nr_f_b iterations have passed since the current best solution was found) a new search can be started from an initial configuration which is different from those encountered previously. The number of iterations performed for partitioning is influenced by parameters Nr_f_b (number of iterations without improvement of the solution after which the system is considered frozen) and Nr_r (number of restarts with a new initial configuration). The minimal values needed for an optimal partitioning of all graphs of the respective dimension and the resulted CPU times are presented in Table 2. The times have been computed as the average of the partitioning time for all graphs of the given dimension.
1000 100 10 1 0.1 0.01 0.001 10
Execution time (s) (logarithmic)
Step 1. Construct initial configuration xnow:=(Hw0, Sw0) Step 2. for each solution xk ∈ N(xnow) do Compute change of cost function ∆Ck := C(xk) - C(xnow) Step 3. 3.1. for each ∆Ck < 0, in increasing order of ∆Ck do if not tabu(xk) or tabu_aspirated(xk) then xnow:=xk goto Step 4 3.2. for each solution xk ∈ N(xnow) do Compute ∆C´k := ∆Ck+penalty(xk) 3.3. for each ∆C´k in increasing order of ∆C´k do if not tabu(xk) then xnow:=xk goto Step 4 3.4. Generate xnow by performing the least tabu move Step 4. 4.1. if iterations since previous best solution