Harmony Generation Driven by a Perceptually Motivated Tonal Interval Space GILBERTO BERNARDES, INESC TEC DIOGO COCHARRO, INESC TEC CARLOS GUEDES, NEW YORK UNIVERSITY ABU DHABI, INESC TEC MATTHEW E. P. DAVIES, INESC TEC We present D’accord, a generative music system for creating harmonically compatible accompaniments of symbolic and musical audio inputs with any number of voices, instrumentation and complexity. The main novelty of our approach centers on offering multiple ranked solutions between a database of pitch configurations and a given musical input based on tonal pitch relatedness and consonance indicators computed in a perceptually motivated Tonal Interval Space. Furthermore, we detail a method to estimate the key of symbolic and musical audio inputs based on attributes of the space, which underpins the generation of key-related pitch configurations. The system is controlled via an adaptive interface implemented for Ableton Live, MAX, and Pure Data, which facilitates music creation for users regardless of music expertise and simultaneously serves as a performance, entertainment, and learning tool. We perform a threefold evaluation of D’accord, which assesses the level of accuracy of our key-finding algorithm, the user enjoyment of generated harmonic accompaniments, and the usability and learnability of the system. Categories and Subject Descriptors: H.5.5 [Sound and Music Computing]: Methodologies and techniques, Modeling, and Systems General Terms: Design, Algorithms Additional Keywords and Phrases: Generative music, harmony, tonal pitch space ACM Reference Format: Gilberto Bernardes, Diogo Cocharro, Carlos Guedes, and Matthew Davies. 2015. Harmony Generation Driven by a Perceptually Motivated Tonal Interval Space. Computers in Entertainment XX, XX, Article XX (December 2015), 23 pages. DOI:http://dx.doi.org/10.1145/0000000.0000000
1. INTRODUCTION
In today’s creative economy, the role of media users is increasingly shifting from passive consumers to active consumer-producers [Bruns 2007]. This paradigm shift has been encouraged, among many factors, by the increased access to assistive technologies, which make it possible for people with little or no expertise in content creation to engage in the production and dissemination of media assets. In this paper, we seek to foster user-content creation by exploring assistive technology for music creation, in particular towards the automatic generation of tonal harmony.
Author’s addresses: G. Bernardes, D. Cochrarro, and M. Davies, Instituto de Engenharia de Sistemas e Computadores - Tecnologia e Ciência, Rua Dr. Roberto Frias, 4200-465 Porto, Portugal; Carlos Guedes New York University Abu Dhabi, PO Box 129188, Saadiyat Island, Abu Dhabi, United Arab Emirates. Permission to make digital or hardcopies of part or all of this work for personal or classroom use is granted without fee provided that copies are not made or distributed for profit or commercial advantage and that copies show this notice on the first page or initial screen of a display along with the full citation. Copyrights for components of this work owned by others than ACM must be honored. Abstracting with credits permitted. To copy otherwise, to republish, to post on servers, to redistribute to lists, or to use any component of this work in other works requires prior specific permission and/or a fee. Permissions may be requested from Publications Dept., ACM, Inc., 2 Penn Plaza, Suite 701, New York, NY 10121-0701 USA, fax +1 (212) 869-0481, or
[email protected]. © 2015 ACM 1539-9087/2010/03-ART39 $15.00 DOI:http://dx.doi.org/10.1145/0000000.0000000 ACM Computers in Entertainment, Vol. , No. , Article , Publication date: December 2015
2
G. Bernardes et al.
Historically, tonal harmony has been subject to rigorous formalizations specifically adapted to two problems that are central to our research: the automatic generation of chord progressions and the automatic harmonization of a given melody. To this end, several approaches have been successfully applied, which according to Wiggins [1999], can be split into: i) grammar-based systems [Steedman 1999], ii) knowledge-based systems [Pachet 1994], iii) genetic algorithms and genetic programming [Phon-Amnuaisuk et al. 1999], iv) constraint satisfaction systems [Pachet and Roy 1998] and v) neural networks [Gang et al. 1997]. To which we extend Wiggins’ taxonomy with a new category: statistical learning, which includes systems that generate harmony based on representations learned from musical examples [Manaris et al. 2013; Eigenfeldt and Pasquier 2010]. Despite the wide range of proposed solutions, we argue that the problem of harmony generation has been restricted to a subset of the task, which is the four-voice harmonization of melodies encoded as symbolic music representations, and current solutions are too restrictive in the sense they offer users very little control over the generation process and a narrow scope for creative endeavor and experimentation. In this paper, our aim is towards an intelligent system that encompasses formal strategies for harmony generation within the tonal Western music syntax. We strive for a solution that encourages the rapid exploration of different musical results facilitated by the ability to robustly analyze, interpret, and generate music. By doing so, we exclude the need to manually select an appropriate set of chords to accompany a given musical input. Additionally, our approach for the automatic generation of musical harmony differs from, and extends previous research by: i) targeting both symbolic representations and musical audio inputs with any number of voices, instrumentation and complexity, ii) offering more than one solution at a given time to extend the possibilities for live performance and creative experimentation, and iii) presenting an adaptive user interface, which serves the threefold pedagogic, performative, and entertainment purposes. A distinctive feature of our approach is the use of a perceptually motivated Tonal Interval Space [Bernardes et al. 2015], which is a geometric model of tonal pitch that follows research grounded in both music theory [Lewin 1987; Cohn 1997], cognitive psychology [Longuet-Higgins 1962; Shepard 1982; Krumhansl 1990] and more directly, the computational models by Chew [2000] and Harte et al. [2006]. In this paper, the Tonal Interval Space acts as a framework in which we design algorithms for music analysis and generation. Specifically, we compute indicators of tonal pitch relatedness and consonance, as well as estimate the key of a melodic and/or harmonic musical structure following previous studies on this topic by Krumhansl & Schmuckler [1986], Temperley [1999], and Chew [2000]. Our generative model has been implemented as a piece of software for Ableton Live,1 MAX,2 and Pure Data.3 The resulting application, D’accord, allows users to interactively generate m-note harmonically-compatible accompaniments in real-time based on three attributes computed in our Tonal Interval Space model: perceptual relatedness, level of consonance, and key. At each beat, the system suggests several key-related pitch configurations,4 as well their compatibility to a beat input by an
1
Ableton Live, https://www.ableton.com/en/live/, last access on 20 April 2015. MAX, https://cycling74.com/products/max/, last access on 20 April 2015. 3 Pure Data, https://puredata.info/, last access on 20 April 2015. 4 In this paper, we adopt the term ‘pitch configuration’ to denote (vertical) pitch structures with a variable number of notes. 2
ACM Computers in Entertainment, Vol. , No. , Article , Publication date: December 2015
Harmony Generation Driven by a Tonal Interval Space
3
adaptive interface designed for both novice and expert users alike, with the long-term goal of boosting the user’s creative abilities through musical metacreation. The user is then responsible for selecting and triggering pitch configurations via one of several interaction modes and controllers (e.g. a computer keyboard, mouse, or MIDI controller). Prior to playback, the selected pitch configurations are further processed by an algorithm that aims to improve voice leading. The remainder of this paper is structured as follows. In Section 2 we present the architecture of D’accord, including the basic functioning of its component modules. In Section 3, we summarize the computation of the Tonal Interval Space and demonstrate its ability to measure the perceptual relatedness and consonance level of tonal pitch, as well as the possibility to estimate the key of a musical input. In Section 4, we describe the creation of a database of pitch configurations used during generation which is followed in Section 5 by an algorithm for ranking the database configurations. In Section 6, we present the user interface of D’accord and the interaction design behind the application. In Section 7 we detail an algorithm for improving the voice leading of selected database configurations. In Section 8, we present both objective and subjective evaluation of our system and finally, in Section 9, we draw our conclusions and outline areas for future work. 2. SYSTEM OVERVIEW AND DESIGN
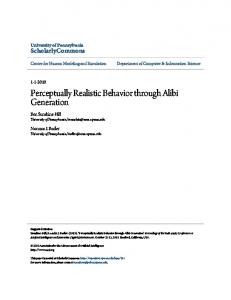
Fig. 1 shows the architecture of D’accord as well as the information flow between its six fundamental modules. In order to initialize the system the user must first specify a MIDI or audio file as an input target. The first module of the system is responsible for splitting the input stream into beats, which provides the temporal segmentation for estimating the underlying key of the input. Based on the outputted key and whenever the key estimate is updated, the second module of the system generates a diatonic set of seven candidate m-note pitch configurations on the fly, which are available to the end-user of the system. The third module of the system is then responsible for ranking the candidate pitch configurations by assessing how compatible they are with a target beat in terms of perceptual relatedness and consonance. Up to this stage, all processing depends on the 12-dimensional (12-D) Tonal Interval Space (see Section 3), which forms the backend of the three first modules of D’accord. The fourth module of the system is a database that stores the information generated by the three first modules, in particular the collection of candidate pitch configurations in several representations. Its flexible structure allows the dynamic allocation of information on a beat-by-beat basis, which is accessed at runtime by the remaining modules of the system. The fifth module is responsible for providing the end-user the information generated in the first three modules in an intuitive manner. The interface uses color coding to indicate the compatibility level between the database candidates and the target beats. At each beat, more than one good solution is provided to the user, who can then select and trigger events (i.e., pitch configurations) using an external controller.
ACM Computers in Entertainment, Vol. , No. , Article , Publication date: December 2015
4
G. Bernardes et al.
Fig. 1. Architecture of D’accord. The system modules are organized horizontally from left to right according to the information flow along with their input and output data.
After a pitch configuration has been triggered, the system retrieves its pitch class components from the database and sends it to the last module of the system, which is then responsible for organizing the voice leading of the selected configurations. In this module, the pitch class set of the selected configuration is unfolded into several pitch spacings and inversions over the user-defined pitch range. Then, a cost function ranks all generated solutions and outputs the candidate with the minimal cost for playback. 3. TONAL INTERVAL SPACE
The 12-dimensional Tonal Interval Space [Bernardes et al. 2015] is a multi-level tonal pitch framework, which follows the line of perceptually motivated spaces in the context of the Tonnetz, such as Chew’s [2000] Spiral Array and Harte et al.’s [2006] Tonal Centroid Space. The most salient tonal pitch levels, such as pitch classes, intervals, chords and keys are represented in the space by Tonal Interval Vectors (TIVs), T(k), which result from aggregating their component pitch class, then converting them to a 12-D chroma vector,5 c(n), and finally computing their (𝐿! normalized) Discrete Fourier Transform (DFT), such that: 𝑇 𝑘 =
!(!) !
!!! !!! 𝑐
𝑛 𝑒!
!!!"# !
, 𝑘 ∈ ℤ ,
(1)
where n is the chroma vector pitch class index up to N=12, k corresponds to the particular interval in question, and 𝑐 is the DC component of 𝑇 0 = !!! !!! 𝑐(𝑛), which is responsible for normalizing the space. The TIV only includes the coefficients T(k) for 1 ≤ 𝑘 ≤ 6 , thereby excluding the DC component and symmetrical intervals resulting from the DFT computation. To enhance tonal pitch relatedness and define a consonance measure in the space, we adjust the location of pitch classes in the Tonal Interval Space by weighting the contribution of each complementary interval, T(k). To this end, we use empirical dissonance ratings of dyads derived from three studies [Malmberg 1918; Kameoka and Kuriyagawa 1969; Hutchinson and Knopoff 1978], whose composite index is detailed in Huron [1994]. Since the resulting weights, w(k)={0.049, 0.132, 0.203, 0.221, 0.246, 0.121}, are known a priori, we incorporate them into the direct calculation of the T(k) in Equation (1). Following Harte et al. [2006], we visualize the 12-D space as 6 circles, each representing one complex DFT coefficient (see Fig. 2), i.e. circle 1 has the real part of T(1) on the x axis and the imaginary part of T(1) on the y axis and so on. The weights 5 Chroma vectors represent the distribution of energy across the chromatic pitch classes in a musical octave.
ACM Computers in Entertainment, Vol. , No. , Article , Publication date: December 2015
Harmony Generation Driven by a Tonal Interval Space
5
assigned to the DFT coefficients correspond to the circles’ radii, represented in Fig. 2 as radius vectors. The Tonal Interval Space is used in this paper as a framework on which we design algorithms for computing indicators of tonal pitch relatedness, consonance, and for estimating the key of a musical passage (detailed in Sections 3.2, 3.3, and 3.4, respectively). Together these three components drive the selection of chord candidates in D’accord. However, before providing details about these, we detail the representation of symbolic and audio inputs in the space.
Fig. 2. Visualization of the Tonal Interval Space as six circles organized according to complementary intervals. Shaded gray areas denote the regions which TIVs can occupy for each circle. Three plotted TIVs correspond to the position of the C major chord (square), the pitch B (star), and the combination of both configurations (triangle)—which correspond to the pitch classes set {0, 4, 7}, {11}, and {0, 4, 7, 11}, respectively. The pitch configuration resulting from the combination lies on a segment line whose boundaries correspond to the location of first two TIVs. The radii correspond to the weights of each complementary interval, T(k), which for visualization purposes are all represented by an identical size.
3.1 Pitch Representations
D’accord can process symbolic representations and audio signals, the strategies for each we address separately in the two following sections. For both input types, the musical content can be either monophonic or polyphonic, for which D’accord first derives an appropriate chroma-based representation. Then it generates representations for the key and its seven related diatonic pitch configurations in the Tonal Interval Space. The rate at which D’accord updates the databases with new ranked configurations is linked to the tempo of the input files. Therefore, for both symbolic and audio inputs we detail the strategies applied in the segmentation of the input into beats, as well as their representation as chroma vectors—a required preprocessing step for TIV computation.
ACM Computers in Entertainment, Vol. , No. , Article , Publication date: December 2015
6
G. Bernardes et al.
3.1.1 Symbolic Input. The database of pitch configurations and input targets driven from symbolic music inputs are represented in the Tonal Interval Space by binary activations in a chroma vector c(n). For example, the C major chord (pitch classes 0, 4, and 7) gives chroma vector c = {1, 0, 0, 0, 1, 0, 0, 1, 0, 0, 0, 0}. In this sense, database configurations are represented by clean and robust chroma vectors, which assume equal temperament and enharmonic equivalence and discard chord inversions, the effect of the relative amplitude between pitch classes, note durations, and doublings. To generate a beat-synchronous chroma vectors driven from symbolic target input, we set all active chroma vector bins to 1, i.e. those corresponding to pitch classes occurring across the duration of each beat. To determine the beat locations, we rely on the metadata within MIDI files. To represent keys in the Tonal Interval Space, we defined four different strategies, each driven by a set of chroma vectors for the major and minor modes. This collection of chroma vectors was originally presented in the context of key finding algorithms, where they are commonly referred to as key profiles, a terminology we also adopt. The C major and C minor vectors for each profile, p, are shown in Table I, and the chromas of the remaining keys are obtained by rotating the vectors by 12 semitones. To compute the key TIVs, 𝑇 ! , for each profile, p, we compute the DFT of the chroma vectors using Equation (1). The resulting TIVs are used to define the location of each of the 24 major and minor keys in the Tonal Interval Space. The first key profile, cdiat, activates the diatonic pitch set of a key in a chroma vector. The second profile, ck-k, by Krumhansl and Kessler (K-K) [1986], was derived from the ‘probe tone’ method. The third key profile, ctemp, by Temperley [1999], resulted from adjusting the K-K profiles using music theory principles. The last key profile, cchew, by Chew [2000], is widely used in her Center of Effect Generator algorithm for estimating the key of a musical passage in the Spiral Array.
Minor
Major
Table I. Chroma vectors representing the C major and C minor key profiles. With the exception of the first theoretically derived profile, which results from the binary activation of the key diatonic pitch class set, the three remaining profiles were proposed in the context of key finding algorithms [Krumhansl and Kessler 1986; Temperley 1999; Chew 2000].
C
C#
D
D#
E
F
F#
G
G#
A
A#
cdiat
1
0
1
0
1
1
0
1
0
1
0
B 1
ck-k ctemp cchew cdiat ck-k ctemp cchew
6.35
2.23
3.48
2.33
4.38
4.09
2.52
5.19
2.39
3.66
2.29
2.88
0.748
0.060
0.488
0.082
0.670
0.460
0.096
0.715
0.104
0.366
0.057
0.400
2
0
1
0
1
1
0
2
0
1
0
1
1
0
1
1
0
1
0
1
1
0
0
1
6.33
2.68
3.52
5.38
2.6
3.53
2.54
4.75
3.98
2.69
3.34
3.17
0.712
0.084
0.474
0.618
0.049
0.460
0.105
0.747
0.404
0.067
0.133
0.330
2
0
1
0
1
1
0
2
1
1
1
1
3.1.2 Audio Input. Generating chroma vectors from audio poses substantially greater challenges, and hence demands a different approach than for symbolic inputs because robust note transcription from polyphonic audio stream remains unsolved [Benetos et al. 2013]. Furthermore, given that audio chroma representations could affect the robustness of D’accord, notably the key recognition stage, we examine three different strategies for audio chroma representation. As in the symbolic input, we first report the computation of chroma vectors on a regular and short-time interval basis and then their codification on a beat-by-beat basis (beat-synchronous chromas).
ACM Computers in Entertainment, Vol. , No. , Article , Publication date: December 2015
Harmony Generation Driven by a Tonal Interval Space
7
The first and second strategies use the QM chroma [Harte and Sandler 2005] and NNLS chroma [Mauch and Dixon 2010] plugins within Sonic Annotator [Cannam et al. 2010] with default parameters. While the QM chroma folds all spectral information into a 12-bin (octave) representation, the NNLS chroma performs an approximate note transcription, and typically provides a sparser representation of the input signal in the chroma domain. The third strategy applied to generate audio chroma vectors uses a more naïve method, referred to as ‘simple’ chromas, and assumes that the most relevant information in the audio spectrogram is encoded in the most prominent peaks of its FFT analysis. We adopt this because of an expected need for sparsity in the chroma vectors to most closely match the symbolic input. Therefore, we encode the eight most prominent peaks resulting from a sliding window FFT analysis (window size set to 4096 samples and hop size of 2048 samples at a 44.1 kHz sampling rate). To extract the eight most prominent peaks of the spectra we use Pure Data’s external sigmund~. To minimize the impact of transients, we exclude frequencies above 5 kHz. To generate beat-synchronous chroma vectors from an audio stream, we compute beat locations using the QM-VAMP bar and beat tracker [Davies et al. 2009] within Sonic Annotator [Cannam et al. 2010] and then calculate the median value per chroma bin for all frames within each beat. 3.2 Measuring Pitch Relatedness
In earlier work [Bernardes et al. 20015], we showed that the relative location among multi-level pitch configurations represented in the Tonal Interval Space provides a strong indicator of the perceptual relatedness of tonal pitches. In the Tonal Interval Space, tonal pitch relatedness, D, can be computed as the Euclidean distance between Tonal Interval Vectors, such that: 𝐷 𝑇! , 𝑇! =
! !!!
𝑇! 𝑘 − 𝑇! 𝑘
!
,
(2)
where Ti and Tj are two different TIVs. Moreover, the relative location of pitch configurations in the Tonal Interval Space concurs with theory principles at the three main levels of tonal Western music: pitch class/intervals, chords and key [Bernardes et al. 2015]. At the pitch class level, it places intervals that play an important role in the tonal system (e.g., octaves, fifths, and thirds) at smaller distances. Pitch class distances in the Tonal Interval Space preserve the pitch organization of the Tonnetz, meaning that, at the chordal level, the TIS favors chord progressions with minimal displacement of moving voices (known as voice-leading parsimony) by placing chords sharing common tones near to one another. Furthermore, while preserving the common-tone logic of the Tonnetz, the Tonal Interval Space expands the range of musical objects beyond triads, being able to map unique chroma vectors to unique points in the space. At the key level, the Tonal Interval Space represents our expectancy of proximity between the 24 major and minor keys by placing the dominant, subdominant and their relative minor keys at close distances. Additionally, in our topology the degree to which pitch classes and chords relate to a particular region is dictated by their proximity to the key TIVs, or, in other words, the neighbourhood of all key TIVs are occupied by their diatonic pitch class sets. Further details on measuring tonal pitch relatedness can be found in [Bernardes et al. 2015]. ACM Computers in Entertainment, Vol. , No. , Article , Publication date: December 2015
8
G. Bernardes et al.
3.3 Measuring Consonance
In the visualization of the 12-D Tonal Interval Space, pitch configurations occupy a limited area in each circle (gray shaded areas shown in Fig. 2), which range from the center of the circle to the circumference as a result of the normalization in Equation (1). Within the restricted space that TIVs can occupy, the location of, and distance among, pitch class TIVs not only obeys music theory principles but is also determined by empirical consonance ratings of musical dyads. Therefore, we extrapolate the consonance measure C(T) of the TIV by calculating the Euclidean distance to the center of the space. We divide the result by the individual pitch class consonance Cmax to normalize it to the range [0, 1]. 𝐶 𝑇 =
! ! ! !
!!"#
,
(3)
where Cmax = 0.431. To compute the consonance level of composite pitch configurations, we sum the two chroma vectors to create a new vector that reflects their combined energy, then we compute the TIV of the resulting chroma vector using Equation (1), and finally apply Equation (3) to indicate their joint consonance. The location of the resulting TIV will fall in a line segment bounded by the original two TIV locations (see Fig. 2). The exact location within this line segment is given by the total energy of each pitch configuration, i.e. the configuration with lower energy pushes the resulting TIV from its location, and the configuration with more energy attracts the resulting TIV towards its location. Given this property of the space, we can save computation time while calculating the composite consonance level of two configurations by keeping track of their energy and computing the centroid of the two original TIVs, Ti and Tj, such that: 𝐶 𝑇! , 𝑇! =
! !!"#
∙
! ! !!! |!! ∙ !! !!! ∙ !! |
!! ! !!
,
(4)
where 𝑎! and 𝑎! are the total energy of chroma vectors ci and cj. In this paper, we hardcode the energy of both target and database TIV to unity, thus discarding the effect of the relative amplitude between combined chroma vectors, because the energy of symbolic and audio signals are not akin for comparison. 3.4 Key Finding
This section details our key-finding algorithm based on the Tonal Interval Space, which continuously estimates the key of a musical input over time. To estimate the key our algorithm relies on two attributes of the Tonal Interval Space: i) the set of diatonic pitch classes in a given key occupying a compact neighborhood around its key TIV and ii) the 24 major and minor key TIVs being sparsely represented in the space and within each mode, equally spaced. Based on the assumption that a keyindicating element is the use of its diatonic pitch set, we estimate a key of a musical passage in the Tonal Interval Space by finding the nearest neighbor in the high dimensional Euclidean space of a query TIV given a database of 24 major and minor key TIVs. As musical events are sounded in sequence, their resulting TIV locations form a geometric shape, which becomes increasingly more complex over time. Following
ACM Computers in Entertainment, Vol. , No. , Article , Publication date: December 2015
Harmony Generation Driven by a Tonal Interval Space
9
Chew [2000], instead of using this complex shape to compute key estimates, we collapse the temporal information to a single TIV. At each event, the algorithm only compares a unique TIV to the 24 major and minor TIV keys. Moreover, to avoid sudden changes in the estimated key, which is commonly stable over large temporal spans, as well as incorporating a simple model of a listener’s short-term memory, which has been shown to play an important role in tonality perception [Farbood et al. 2013], the cumulative TIV, 𝑇! , is calculated by the weighted average of the cumulative TIV of past events, Tn-1, and the current TIV, Tn, such that: 𝑇! =
𝑇! 𝑛 = 0 , 𝛼 𝑇! + 1 − 𝛼 𝑇!!! 𝑛 ≥ 1
(5)
where: 𝛼 = 𝑚𝑎𝑥
! !!!
, 0.01 .
(6)
To rank the collection of 24 major and minor keys, the system computes the Euclidian distance between the accumulated TIV, Tn, and all key TIVs. The best key estimate, M, is the one which minimizes: 𝑀 = 𝑎𝑟𝑔𝑚𝑖𝑛!
! !!!
|𝑇! (𝑘) − 𝑇 ! (𝑘)| ! ,
(7)
where 𝑇 ! is a particular set of key TIVs derived from a collection of four different key profiles proposed in related literature and presented in Section 3.1. After finding the minimal Euclidian distance of the 24 key TIVs set from the cumulative input TIV, the system reports the best key estimate by a pitch class, which ranges between 0-11 for major keys and 12-23 for minor keys. Both sets of values start by the pitch class C and follow an ascending chromatic sequence. 4. DATABASE CREATION
D’accord’s database consists of seven diatonic pitch configurations which rely on two parameters: the number of notes, m, per pitch configuration and the key estimate. Depending on user input, the number of notes, m, per pitch configuration can range from 1 to 12 (i.e. the maximum number of notes in a chroma vector representation), but, in practice, we constrain this variable to a maximum of 4-note chords, since pitch configurations with 5 or more different notes are less typical in tonal music and require enhanced treatment of voice leading. Therefore we allow m to take values from [1, 4]. When m = 1, the system generates an accompanying melody, and when m > 1, m-note chords. Given m, the system generates a diatonic set of seven pitch configurations at every key change. To generate the seven pitch configurations, the system first creates a list with the diatonic pitch class set of the estimated key, using the major scale and the harmonic minor scale for the major and minor modes, respectively. Then, for each pitch class it vertically stacks m-number of notes in intervals of thirds using the pitch classes from the set. For example, if our estimated key is C major and m=2, the resulting key set is {0, 2, 4, 5, 7, 9, 11} and the database Z={0 4, 2 5, 4 7, 5 9, 7 11, 9 0, 11 2}. The order in which pitch configurations are generated follows a constant pattern based on the scale degrees of the estimated key. The first generated configuration ACM Computers in Entertainment, Vol. , No. , Article , Publication date: December 2015
10
G. Bernardes et al.
always corresponds to the first degree of the scale, the second configuration to the second degree and so on. This order keeps track of the scale degree of each configuration or, when m>1, the root of the chord. Finally, a database stores the generated pitch configurations as: i) the set of their pitch class components, ii) their chroma vector representations, and iii) their TIVs, which are later accessed by the remaining modules of D’accord. 5. RANKING THE PITCH CONFIGURATION CANDIDATES
D’accord’s database is composed of seven pitch configurations generated based on the target key estimate. Restricting the database candidates to seven pitch configurations related to the target key immediately discards some poor results. However, even though this limited set of configurations is assumed to better accompany a target beat than non-related key configurations, not all seven pitch configurations rank equally according to a specific target beat. Therefore, we rank the compatibility between the database configurations and each target beat. To this end, we adopt two criteria: the degree of perceptual relatedness and level of consonance between target beat and database configurations. Both indicators have were already introduced and are computed using Equations (3) and (5). Since the score aims to minimize the Euclidian distance and maximize consonance between TIVs, we combine both indicators by inverting the normalized Euclidean distance computation by subtracting the result from 1. For each database configuration, Zi, we compute a score, Ri, which indicates their joint perpetual relatedness and consonance level with an input target beat, Ttarget, such that: 𝑅! = 1 − 𝐷 𝑇!"#$%! , 𝑍!
+ 𝐶 𝑇!"#$%! , 𝑍! .
(8)
where D corresponds to the distances D normalized to occupy the range 0 to 1 for each specific pitch configuration Zi, and C the consonance values for the database configurations Zi, normalized to the range 0 to 1. The resulting rankings, Ri,, indicate how compatible a target beat is with each database configuration, Zi, in terms of perceptual relatedness and consonance, e.g. the best database candidate is argmaxi (Ri). 6. USER INTERFACE AND MODES OF INTERACTION
To allow users to interact with D’accord, we have created an interface for Ableton Live, MAX, and Pure Data – of which a screenshot is shown in Fig. 3. Despite minor cosmetic differences, the interfaces for all environments have identical functionality. The interface is composed of two main modules arranged vertically. The upper module contains a heptagon divided into seven equally sized triangles used for displaying the database rankings and triggering events for playback. At runtime, each triangle is dynamically mapped to one of seven database pitch configurations. The update rate of the mappings depends of the input file tempo and occurs at the onset of each beat. To expose the database configurations rankings we adopt a color code scheme ranging from continuous shades of white to yellow to red. The mapping between the color scheme and the database scores is linear. A zero score corresponds to white, a 0.5 score to yellow and a score of 1 to red. Between these values, the colors are gradually mixed, but in general, the closer to red, the better the score. While pitch configurations are dynamically mapped to each of the interface’s triangles, a fixed mapping between scale degrees and the seven triangles exists (see
ACM Computers in Entertainment, Vol. , No. , Article , Publication date: December 2015
Harmony Generation Driven by a Tonal Interval Space
11
the rightmost image in Fig. 3). The location of the seven scale degrees on the heptagon place pitch configurations sharing common-tones at close distances. Moreover, configurations sharing function categories (i.e. configurations that can substitute each other without altering the tonal function) are in adjacent triangles. For example the tonic, mediant and submediant scale degrees, all related to the tonic harmonic function, are mapped to three adjoining triangles. The common-tone circular organization and harmonic function clusters places the best rated configurations at close distances and helps users anticipate typical motions between function categories which are most likely to run counterclockwise—assuming that Riemann’s [1893] typical motions between categorical function applies, i.e., from the tonic to the sub-dominant to the dominant and back to the tonic. Based on the interface, the user can make an informed decision about which pitch configuration to play by selecting one of the pitch configurations on the interface (i.e., one of the seven triangles in the heptagon). The decision of when to play and the duration is the responsibility of the user, who can trigger and release events by sending commands from external devices such as the mouse, keyboard or MIDI controllers. The two commands sent from the external devices to D’accord are then converted to MIDI note on and note off messages, to trigger and release note events, respectively. The simplest mode of interaction with D’accord’s interface is via the mouse. To trigger events with the mouse, the user must click on one of the triangles in the heptagon and release the mouse click to control the duration. The second strategy is via the computer keyboard or any external MIDI controller. This mode eases the interaction between user commands and interface information by offering indirect control over the database configurations. To this end, while updating the interface’s information, the system keeps track of the ranking database scores in decreasing order. Then it establishes a direct mapping between the keyboard keys 1 to 7 or the MIDI note messages 60-67 to the ranked database configurations. In this way, the best candidate solution is always mapped to the same location on the controllers. The duration of played events is controlled by a similar strategy as with the mouse interaction, i.e. by the release command of the keyboard or external MIDI controller. In sum, D’accord’s interface was designed to provide a simple, intuitive, and flexible experience for both expert and novice users. The mappings between database configurations and interface location provide three concurrent layers of information: i) the compatibility score to a given target beat, ii) categorical function of database configurations, and iii) typical motion between harmonic function categories. Although, to some extent, the two latter layers may not be apparent to novice users, it can offer experts user the possibility to make more informed choices during runtime, as well as being used for the pedagogic purpose of learning tonal music structures in the context of projects such as McCarthy Music’s Illuminating Piano,6 Griffin and Jacob’s [2013] adaptive digital music instruments, Dias and Guedes’s [2012] Gimme da Blues, and Behringer and Elliot’s [2009] and Bigo et al.’s [2012] manually-driven generative music systems, which adopt the Tonnetz as a representation for designing tonal chord progressions.
6
McCarthy Music’s Illuminating Piano, http://www.mccarthypiano.com/software.aspx, last access on 20 April 2015. ACM Computers in Entertainment, Vol. , No. , Article , Publication date: December 2015
12
G. Bernardes et al.
Fig. 3. D’accord interface developed for the PD programming environment (on the left) and the skeleton of the interface layers (on the right) showing the scale degree locations, the harmonic category function regions (dominant, sub-dominant, and dominant), and the typical motions between these categories (dotted line).
The lower module contains the following control settings for D’accord: i) open a target file, ii) start/stop the playback iii) control the amplitude/velocity of the playback and/or generated material, iv) define the number of notes per pitch configuration, and finally, v) the pitch range which the generated output can occupy (defined on a range slider whose limits are the standard piano pitch range (i.e. A1 to C7 or the MIDI range note values 21-108)—which is quantized to multiples of 12 (i.e. musical octaves). Additionally, the lower module provides volume unit meters for both target and generated outputs. 7. VOICE-LEADING
Voice leading is an important aspect of harmony, which regulates both horizontal motion and vertical arrangement of the voices of a chord progression. Together with the rules of harmonic progression, voice leading establishes the ground rules for effective musical harmony writing. Its importance is fundamental in the training of the Western musician, backed by the claim that ‘good voice leading can take a simple chord sequence and transform it into a masterpiece’ [Schonbrun 2011, 174]. Despite the large quantity of music theory literature documenting objective voiceleading rules, we should bear in mind that voice leading depends on several aspects including musical style, composer idiosyncrasies, orchestration, and density. Commonly, rules for voice leading found in music theory textbooks are drawn from, and meant for, canonic vocal four-part music and may not apply to music outside this category.
ACM Computers in Entertainment, Vol. , No. , Article , Publication date: December 2015
Harmony Generation Driven by a Tonal Interval Space
13
Here, we rely on a concise set of voice leading rules framed for vocal four-part music, which we adopt with relative freedom. It is outside of the scope of this paper to present a comprehensive model for the automatic computation of voice leading, in the sense it implies many parameters that are either subjective or poorly addressed in the literature. Additionally, since D’accord is agnostic with respect to music style— the only constraint is the use of tonal harmony—we deliberately reduce the number of modeled rules to a smaller set, which conform to more general music contexts. From the collection of voice-leading rules in [Huron 2001], we select the following set based on a criterion of their adaptability to general music contexts other than vocal music: 1. Chord spacing—intervals between voices should not exceed one octave, with the exception of the interval formed by the two lowest notes, in which no restriction is applied; 2. Avoid melodic leaps—conjoint chords should minimize the step distance in each voice, preferably maintaining common tones in the same voice or moving to the nearest possible pitch; 3. Avoid parallel octaves and fifths—intervals of the octave and fifth should not be consecutive between the same voices; 4. Avoid hidden octaves and fifths— intervals of the octave and fifth should not be consecutive between different voices; 5. Outer voices (contrapunctual) motion—contrary motion between outer voices is encouraged. The algorithmic strategy developed to improve voice leading is only applied to 3or 4-note database configurations. It finds the best pitch configuration for playback from a large set of candidate configurations generated from all possible vertical spacings and inversions within the user-defined range of the selected pitch configurations. For example, if our selected chord is a 3-note chord, our database will include the chord in its fundamental state as well as its two inversions, i.e. with the third and fifth on the bass. Additionally, for each of the three sets all possible chord spacings within the user-defined pitch range are instantiated. Table II. Point assignments for voice leading rule conditions
Cost
Chord spacing
5 2 1 0
Melodic leap
Contrary motion
Parallel 5th / 8th
Hidden 5th / 8th
—
—
—
true
true
> 12
>8
—
—
—
>3
>4
false
—
—
=0
=0
true
false
false
All pitch configurations in the population are evaluated in relation to the previously played configuration and are ranked using a set of points shown in Table II if they meet particular conditions. Each pitch configuration is evaluated in terms of the five rule conditions, and for each condition the algorithm assigns a cost. Then, an overall cost per configuration is computed by summing the five rule conditions cost. Finally, the algorithm outputs the configurations with the minimal cost, which corresponds to the best voice leading. Some additional voice leading properties can be manually specified by the user, such as the textural density or number of voices per pitch configuration as well as the range the pitch configurations can occupy. The Tonal Interval Space and the interface design explicitly offer control over voice leading by placing configurations that share common tones at close distances. Retaining tones from one configuration ACM Computers in Entertainment, Vol. , No. , Article , Publication date: December 2015
14
G. Bernardes et al.
to the next, commonly referred to as parsimony, improves the voice-leading algorithm to minimize the database costs. 8. EVALUATION
To evaluate D’accord we address three aspects of the system. First, we demonstrate the efficacy of the key-induction algorithm, which underpins the generation of an optimal set of candidate pitch configurations via an objective comparison against ground truth annotations and previous studies. Then we undertake two subjective experiments: (1) a listening test to assess the database rankings that support the user selection process and (2) a pilot user interaction experiment which aims to test the usability and learnability of the software. 8.1 Objective Analysis
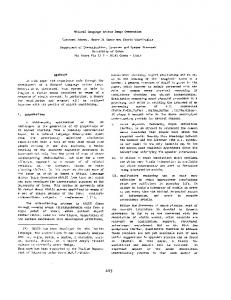
8.1.1 Test Database. Our key finding algorithm was evaluated on three annotated datasets. Two datasets include both symbolic and audio classical music examples and correspond to Bach’s 24 fugue subjects from Book I of the Well Tempered Clavier (WTC), and the Kostka-Payne (K-P) dataset [Temperley 1999]. The third is a large collection of pop/rock Beatles’ songs assembled by Harte [2010]. Since we aim for a system capable of generating compelling accompaniments given a wide scope of music, we selected three datasets which cover distinct styles of music including monophonic/polyphonic and monotimbral/multitimbral examples. Furthermore, a comparison with existing key-finding methods can be established for the Beatles dataset [Gómez 2006; Mauch and Dixon 2010; Lindenbaum et al. 2015]. We excluded 19 musical examples from the K-P dataset, i.e., those in a mode other than the major or minor, and those containing a modulation in key. The entire Beatles’ dataset was used. This gives a total of 230 musical examples: 27 from the KP corpus, 24 Bach’s fugue subjects, and 179 Beatles songs. The sources of the first two datasets provide musical examples in symbolic representation (MIDI file format), which were used to expand the datasets with audio examples by synthesizing them with piano samples using Logic.7 We analyzed 51 musical examples in symbolic representation and 230 audio examples. All audio files were uncompressed single channel (mono) with 16-bit resolution and a sampling rate of 44.1 kHz. Fig. 4 shows the total distribution of musical examples per key, as well as the overall totals per mode and input type. In the Beatles dataset there is a bias towards major over minor examples. However, in order to enable a direct comparison with previous research, we retained all examples. 8.1.2 Performance. For comparison with previous studies, we use a threefold evaluation method. First, we use the scoring strategy from the 2005 MIREX key finding competition as well as in [Gómez 2006] and [Izmirli 2006], which measures the percentage of correctly or closely related key estimates per beat segment using the score points shown in Table III. This evaluation method assumes that some incorrect key estimates are worse than others, because if the keys are related in some harmonic manner this may still be informative to a musician. Second, we compute the percentage of correctly estimated beat segment keys. The third evaluation criterion is the ratio of correctly estimated keys per musical example to the number of total examples.
7
Logic, https://www.apple.com/logic-pro/, last access on 25 April 2015. ACM Computers in Entertainment, Vol. , No. , Article , Publication date: December 2015
Harmony Generation Driven by a Tonal Interval Space
15
Fig. 4. Key distribution in the three audio and symbolic datasets (K-P, WTC, Beatles) used for evaluating our key finding algorithm (please note that for enhanced visualization the y axis scale is broken).
Tables IV and V show the performance of our key finding method for symbolic and audio music input, respectively. The first row presents two values that correspond to the percentage of correct key estimates using the point assignments shown in Table III, and the second value (in brackets) gives the percentage of correct key estimates for the entire datasets. The second row presents a score of the model efficiency, which is computed as the average number of beat segments needed to reach the first correct key estimate. The last row presents the ratio of correctly estimated keys per musical example to the number of total examples. The scores shown in Tables IV and V express the percentage of correct key estimates per beat segment for each dataset. The beat segmentation and update rate of key estimates aims to place D’accord as close as possible to a real-time performance. For the symbolic datasets, the Temperley key profile results in the best performance for our key finding method. The scores resulting from applying each of the profiles are shown in Table IV. On the K-P dataset 79% of key beat segments were correctly estimated, and this score rose to 86% using the MIREX point assignments. On average the algorithm needs 2.5 beat segments to output a correct key estimate, and overall it was successful at reaching the correct key in 96% examples of the dataset (26 out of 27). On the WTC dataset our method performs equally well, with some minor differences: the score resulting from applying the MIREX point assignments is slightly higher (82%), and the convergence to correct key estimate was faster (2.1 beats on average). All examples in the WTC dataset converged to the correct key. A direct comparison with existing studies for key finding from symbolic inputs cannot be established because of small differences between the segmentation used in these studies and our model. While most systems update their estimates on a noteby-note basis our system processes information on a beat-by-beat basis. Table III. Point assignments for key estimates used to evaluate key-finding algorithms at the 2005 MIREX competition Points
Correct
Perfect 5th
Relative
Parallel
Others
1
0.5
0.3
0.2
0
ACM Computers in Entertainment, Vol. , No. , Article , Publication date: December 2015
16
G. Bernardes et al. Table IV. Performance of key finding algorithm for symbolic input
cflat
ck-k
ctemp
cchew
score (%)
57 (49)
80 (72)
86 (79)
78 (70)
aBeats
6.7 23/27
5.2 27/27
2.5 26/27
3.7 25/27
aBeats
51 (46) 4.0
66 (48) 7.7
86 (82) 2.1
81 (77) 2.2
cRatio
22/24
23/24
24/24
24/24
K-P
cRatio score (%) WTC
score: percentage of correct key estimates using the points assignments shown in Table III and (within brackets) the exact number of correct estimates. aBeats: average number of beats needed to reach a correct key estimate. cRatio: ratio between the number of correct key estimates to the total number of examples. Table V. Performance of the key finding algorithm for audio input
cflat K-P
WTC
Beatles
ck-k
QM chroma
NNLS
Simple
QM chroma
NNLS
Simple
score (%)
27 (25)
72 (67)
62 (55)
33 (28)
81 (74)
76 (68)
aBeats cRatio
13.1
7.1
4.9
4.1
10/27
24/27
12.0 22/27
16/27
25/27
11.3 26/27
40 (31)
56 (50)
37 (28)
51 (29)
12.2
6.4
3.1
18.2
score (%) aBeats
59 (55) 14.1
cRatio
11/24
22/24
20/24
18/24
24/24
23/24
score (%) aBeats
5.4 (2.1) 32.2
58 (42) 25.2
56 (36) 26.7
10 (7.1) 14.9
76 (68) 14.8
72 (62) 29.1
cRatio
23/179
118/179
138/179
48/179
161/179
161/179
ctemp K-P
WTC
Beatles
51 (32) 15.4
cchew
QM chroma
NNLS
Simple
QM chroma
NNLS
Simple
score (%)
35 (31)
85 (78)
82 (75)
35 (31)
74 (67)
72 (67)
aBeats cRatio
2.9
2.2
3.2
3.1
10/27
26/27
9.7 27/27
10/27
25/27
12.1 27/27
43 (37)
74 (63)
45 (40)
48 (43)
3.4
3.9
1.5
2.7
score (%) aBeats
70 (62) 3.9
68 (60) 4.4
cRatio
16/24
24/24
24/24
12/24
23/24
24/24
score (%) aBeats
9.0 (6.2) 32.4
74 (65) 15.2
72 (62) 22.9
12 (7.8) 17.1
51 (46) 16.7
65 (62) 27.4
cRatio
33/179
156/179
165/179
26/179
133/179
160/179
In Table V we compare the performance of our model using different input chroma representations and key profiles for three musical audio datasets. The best performance is achieved using the NNLS chroma for the three datasets. The K-K profiles performed better for the K-P and WTC datasets and the Temperley key profile on the Beatles dataset. The results achieved for these datasets and using the aforementioned chromas and profiles are: 78% (K-P), 63% (WTC), and 68% (Beatles). Applying the MIREX scoring system we obtain: 85%, (K-P), 74% (WTC), and 76% (Beatles). Several studies have used the Beatles dataset to test their key finding methods. From these studies a direct comparison can be established with Gómez [2006], Mauch and Dixon [2010], and Lindenbaum et al. [2015], which also use the complete Beatles’ dataset. They report 70.4%, 63%, and 66.5% of correct key estimates, respectively. Gómez and Lindenbaum et al. also report their results using the
ACM Computers in Entertainment, Vol. , No. , Article , Publication date: December 2015
Harmony Generation Driven by a Tonal Interval Space
17
MIREX evaluation system obtaining scores of 76.2% and 75.6%.8 A few songs in the dataset are in modes other than major or minor and therefore not modeled by most key finding methods including ours. However, we retain them to maintain a fair comparison with existing studies.9 The evaluation results in Table V also show that the chroma representation has a noticeable impact on the performance of the system with audio inputs, and considerably deteriorates in the presence of inharmonic spectra as in the Beatles’ dataset examples resulting from the presence of drums (this being more evident when using the QM chroma). The sparser chromas arising from the NNLS and ‘simple’ chroma, obtained higher scores in comparison with the QM chroma. Additionally, even though the ‘simple’ chroma is less effective than the NNLS chroma, it is computationally far more efficient. Therefore, depending on the application and computational power available, one may consider applying one of these different chroma representations. As expected, the performance of our key finding method gives better results using symbolic inputs than audio in the K-P and WTC datasets. However, the results for both these datasets in the audio domain are still quite high, which we believe is due to the monotimbral nature of the audio renderings. Multi-timbral datasets would likely lead to a deterioration of results. From audio signals the convergence to a correct key estimate is also slower than with symbolic inputs. Based on the evaluation results, we utilize Temperley [1999] key profiles, ctemp, in Equation (7) to estimate the key of a musical input in our model, as these profiles generally lead to the best performance. For audio input, the NNLS chroma is used to create the beat-synchronous chromas. 8.2 Subjective Analysis
8.2.1 Listening test design. The aim of the listening experiment was to explore the relationship between user judgments of the fitness of the generated accompaniment and the database rankings, with the hypothesis that user judgments would be positively correlated with database rankings. To maximize the control over the experiment results we only tested generated accompaniments given a MIDI input melody. In order to retain as much control as possible over the stimuli, we restrict ourselves to a set of musical accompaniments driven from MIDI inputs. Therefore, accompaniments driven from audio were not tested in this experiment. To create the dataset used in the listening experiment, we randomly selected a set of ten traditional melodies from the Essen corpus [Schaffrath and Huron 1995] and created 3-note accompaniments for each melody with different ranking scores. For each melody we sampled the highest, middle and lowest ranked database configurations (the first, forth and seventh ranked database configurations). In sum, our database comprised 30 musical examples based on 10 given melodies, for which three quite disparate accompaniments in terms of database rankings were generated per melody. Rhythmically, we automated the triggering of the pitch configuration to occur at each target beat onset. All generated notes had the same velocity and distinct pitch ranges for melody and accompaniment were adopted. We synthesized 8 Please note that we did not run these algorithms ourselves. Instead, we use the results reported in their publications. 9 A comparison to other key finding methods [Rochar et al. 2010; Papadopoulos and Tzanetakis 2012; Noland and Sandler 2006] using the Beatles dataset for evaluation was not considered because they used a reduced number of examples from the dataset.
ACM Computers in Entertainment, Vol. , No. , Article , Publication date: December 2015
18
G. Bernardes et al.
the generated output in Logic using vibraphone samples for the melody and piano samples for the accompaniment and perceptually balanced their loudness. The experiment was run as follows: for each musical excerpt the participants were asked to rate on a 7 point scale how well the accompaniment fits the melody within the context of the tonal music system as well as how much they enjoy the melody to control if the user enjoyment ratings of the melody had any significant impact on the accompaniment ratings. To allow the participants to familiarize themselves with the experiment and clearly identify the sounds used to synthesize the melody and the accompaniment, each experiment trial had a short preliminary training phase. In total, 14 participants were recruited to take the listening test. The population of the study included musicians with 6 years of musical training on average. To prevent order effects, the musical stimuli were presented in a random order at each experiment trial. Participants were not paid for taking part in the experiment. 8.2.2 User interaction experiment design. The aim of the pilot user interaction experiment was to make initial observations about the usability and learnability of D’accord. To this end, we invited participants to experiment with D’accord under constrained conditions. We invited participants who were minimally acquainted with technology and thus we restricted the pool of possible participants to university students or those with a degree already. Additionally, we used two participant target groups in order to test if the software could facilitate music creation regardless of the user’s music expertise. In total, six participants took the experiment, of whom three were musicians and the remaining three non-musicians. All participants volunteered to take the experiment and were not paid. The experiment was run individually for each participant as follows. First, we presented the general purpose of D’accord to the participants as a tool to assist users in generating musical harmony. Then, we explained the possible controllers they could use to interact with D’accord were the mouse and the keyboard (using the keys 17) as well as the role of the color coding to indicate the database rankings in the interface. Next, we asked the participants to listen to the input in order to familiarize themselves with it and finally we asked each participant to generate an accompaniment to that input file using D’accord. The last two teps were repeated twice in order to test two different input types: the first was a slow MIDI melody and the second a relatively fast polyphonic audio track comprising voice and chorus. Precise observations and notes concerning the participants’ interaction with D’accord were taken. The observations aimed to gather data about the participants’ understanding of D’accord’s interface usability and learnability. At the end of the experiment, participants were asked to describe their overall experience with D’accord in terms of learnability and usability/operability. 8.2.3 Results. To examine the results of the listening test we now inspect the mean ratings per stimuli, as displayed in Fig. 5 ordered from the highest to the lowest ranked database configurations per listening excerpt. The overall user ratings across all excerpts for the highest, middle and lowest ranked configurations concur with the order proposed by the system. The only exception is observed in excerpt 6, in which the highest ranked configuration obtained a lower rating than the middle one. Listening back to excerpt 6, we can identify that the middle ranked accompaniment is slightly more dissonant in relation to the highest ranked example, while still providing a compelling harmonization of the input melody. In fact, consonance or perceptual relatedness alone does not guarantee good artistic results, but rather a ACM Computers in Entertainment, Vol. , No. , Article , Publication date: December 2015
Harmony Generation Driven by a Tonal Interval Space
19
variable degree of dissonance, complexity, and information flow [Smith and Cuddy 1986]. Performing a paired T-test on the user ratings revealed a highly significant difference between both highest and middle, and middle and lowest ratings (p