Diaa et. al., Harmony Search and Nonlinear Programming Based Hybrid Approach to Enhance Power System Performance with Wind Penetration. Abstract ...
International Electrical Engineering Journal (IEEJ) Vol. (2016) No.7, pp. 2323-2330 ISSN 2078-2365 http://www.ieejournal.com/
Harmony Search and Nonlinear Programming Based Hybrid Approach to Enhance Power System Performance with Wind Penetration Ibrahim M. Diaa*, Niveen M. Badra*, Mahmoud A. Attia** *Department of Engineering Physics and Mathematics, Faculty of Engineering, Ain Shams University **Department of Electric Power and Machines, Faculty of Engineering, Ain Shams University Abstract – Wind generation existence in power system greatly affects power system transient stability and it also greatly affects steady state conditions. FACTS devices are proposed as a solution to this problem. This paper aims to minimize total power losses and improve system lodability through finding optimal location of Thyresitor-Controlled Series Compensators (TCSCs) in order that system stability being restored. Optimum allocation of TCSC devices and their sizing is obtained by a harmony search and nonlinear programming hybrid approach (NLP-HS) which aim to find the starting point for the nonlinear programming (NLP) problem using Harmony Search (HS) algorithm. IEEE 9-bus Systems were successfully demonstrated by that approach. Index Terms – Wind generation, TCSCs, NLP method, HS Algorithm, optimization, active power loss reduction.
I. INTRODUCTION Nowadays, Due to friendly character of wind generation to the environment, wind generation has been used widely. Wind turbines occupy less land in comparison to other power stations. Technologies development has made the contribution of wind generation to power system more efficient. Wind turbines have a wide range of sizes so it can support different population levels. However, wind generation is unreliable due to the variation of wind speed. Not only Wind turbines are costly but, they are also noisy. Flexible AC Transmission System (FACTS) devices aim to control power flow in the network in order to reduce flows in the heavy loaded lines. They can also help, minimize power loss of the systems and increase stability margin in such a way that thermal limits are not violated. However, our concern in this paper is to minimize total power loss in the network with the help of FACTS devices. The main type of devices considered here, namely, Thyristor Controlled Series Compensators (TCSCs). TCSC is a series compensation device. Generation and transmission limits can adjust using Diaa et. al.,
TCSCs. A thyristor-controlled reactor (TCR) connected in parallel with a capacitor is the TCSC device. FACTS device doesn't require any interfacing equipment, like high voltage transformers. TCSC device is connected in series with the transmission line to be compensated. Series compensation property of TCSC device makes it more economic, competing other FACTS technologies. In practical power systems, some buses are more sensitive than others to the overall system voltage stability. FACTS devices cost can be minimized through proper allocation and appropriate compensation level of that devices. Many optimization methods were used to optimally allocate FACTS devices, Linear Programming method was used by authors in [1], Quadratic Programming method was used in [2], Nonlinear Programming method was used in [3] and [4], Interior Point method was used in [5], Evolutionary Programming was used in [6], Particle Swarm Optimization method was used in [7] and Genetic Algorithm optimization method was used in [8], [9] and [10]. In this paper, an optimization technique is used for TCSC installation in order to improve power system loadability of the lines and minimize the total active loss. The NLP algorithm is the proposed approach aiming to find an optimal number of TCSC devices and their optimal ratings, taking into consideration the thermal and voltage limits. The IEEE 9-bus system was examined by the proposed optimization technique successfully. II. MATHEMATICAL MODEL OF TCSCs TCSC acts as a series capacitive or inductive reactance connected to the reactance of transmission line required to be compensated. A TCSC has the ability to influence the active power flow through a transmission line by adapting the reactance of the line when it is connected in series with the line. Hence, the model of a TCSC device is a variable reactance XTCSC connected in series with the line, as shown in 2323
Harmony Search and Nonlinear Programming Based Hybrid Approach to Enhance Power System Performance with Wind Penetration
International Electrical Engineering Journal (IEEJ) Vol. (2016) No.7, pp. 2323-2330 ISSN 2078-2365 http://www.ieejournal.com/ Fig. 1. The line flow is successfully changed due to series reactance change. In this paper TCSC is modeled by changing transmission line reactance as below: X ij X line XTCSC XTCSC rTCSC .Xline X Where line is reactance of transmission line and rTCSC is compensation factor of TCSC. Rating of TCSC depends on transmission line where it is located. To avoid overcompensation, TCSC reactance is chosen within (-70% to -30%) of the line reactance and from (-80% to 20%) of the line reactance .
System operating limits are the inequality constraints.
R+jX IV. HARMONY SEARCH ALGORITHM
jB/2
Fig. 1 Model of the TCSC III. PROBLEM FORMULATION As we already mentioned, this paper focuses on the optimal location and design of TCSCs. The best utilization of the existing power network is the optimization goal. Only the FACTS controllers technical benefits are taken into consideration (the cost of equipment are not taken into account). In this respect, the TCSCs are located so to maximize loadability, minimize system total active loss and flatten buses voltage. The optimal allocation and sizing of TCSC devices are formulated as a mixed continues-discrete multi-objective optimization problem. The optimization parameters are the FACTS sizing and locations. Our target is to determine the optimal locations and the settings of the parameters of the TCSC in the power network to minimize voltage violations. The total power loss minimization function is the objective.
Recently, various algorithms have been developed in order to solve several engineering optimization problems. Computational difficulty of the numerical methods has forced researchers to depend on metaheuristic algorithms based on simulations in order to solve optimization problems of engineering. Meta-heuristic algorithms common factor is that they combine randomness and rules to simulate natural phenomena. A new optimization technique was developed by Geem et al. [11] inspired by music phenomenon called Harmony Search (HS) meta-heuristic algorithm. Musical performances aim to find pleasing harmony as determined by an aesthetic standard, just as the optimization process aims to find a global solution as determined by a chosen standard, like the process of optimization aims to find a global solution as determined by an objective function. The analogous thing between music improvisation and engineering optimization is shown in Fig. 2. In music improvisation, each player sounds any pitch inside the acceptable range, in order to make one harmony vector. If a good harmony is made by all of the pitches, each player's memory stores that experience, and the probability of making a good harmony is increased next time. However, in engineering optimization, random values are assigned to each decision variable within specified range, together making a solution vector. If a good solution is made by all of the decision variables, each decision variable stores that experience in order to make a good solution is also increased next time [12-14].
A. Objective Function Economically, the minimization of active power losses Ploss is taken into consideration. Ploss expression is:
B. System Constraints The load flow equations are represented by the equality constraints represent as follows: Fig.2. Music improvisation and engineering optimization [14]. 2324 Diaa et. al.,
Harmony Search and Nonlinear Programming Based Hybrid Approach to Enhance Power System Performance with Wind Penetration
International Electrical Engineering Journal (IEEJ) Vol. (2016) No.7, pp. 2323-2330 ISSN 2078-2365 http://www.ieejournal.com/ Each musician is represented by a decision variable, and its distinguished sound pitches are represented by variable’s distinguished values. The procedure of HS algorithm is as follows: First, Problem is initialized and also algorithm parameters , then harmony memory (HM) is initialized, then a new harmony improvisation is created from the HM, then harmony memory is updated, then the last two steps are repeated until the criteria of termination is satisfied. HS Algorithm technique to solve the proposed optimization problem is shown in figure 3.
interior-point (IP) approach to solving the NLP optimization problem is as follows: NLP problem:
The NLP optimization problem is then transformed into IP optimization problem as follows: IP approximate problem:
To solve the IP problem the barrier function is used so the new approximate problem is as described below:
The slack variables Si must be positive to keep ln (Si) bounded. The minimum of f should be approached by the minimum of fµ. In order to solve the barrier problem, Karush-Kuhn-Tucker (KKT) conditions are applied in order to transfer the problem into a sequence of equality constrained problem. To solve the problem after applying the KKT conditions, the algorithm uses a direct step in (x, s) at each iteration. This step aims to solve the KKT equations as follows:
Fig. 3 Flowchart of the HS Algorithm
V.NONLINEAR PROGRAMMING OPTIMIZATION TECHNIQUE As it has been mentioned before the HS algorithm is used first to locate the starting point of the NLP optimization problem. Constrained NLP optimization problem aims to find the vector (x) which is the local minimum of a scalar function f(x) subjected to equality and inequality constraints. Several methods are used to solve the NLP optimization problem. The interior-point algorithm is the technique used in this paper to solve the NLP optimization problem. The
Where W is the Hessian of the Lagrangian of fµ The direct step (∆x, ∆s) equation is obtained after applying linearized Lagrangian to the obtained KKT equations as follows:
S is the diagonal matrix of s. Jg is the Jacobian of the constraint function g. Jh is the Jacobian of the constraint function h. 2325
Diaa et. al.,
Harmony Search and Nonlinear Programming Based Hybrid Approach to Enhance Power System Performance with Wind Penetration
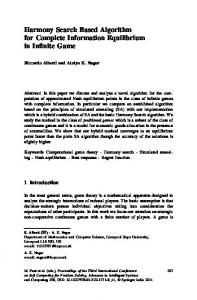
International Electrical Engineering Journal (IEEJ) Vol. (2016) No.7, pp. 2323-2330 ISSN 2078-2365 http://www.ieejournal.com/ 𝛌 is the Lagrange multiplier vector associated with h. 𝛌k is the diagonal matrix of 𝛌. 𝛶 is the vector multiplier of the Lagrange associated with g. e is the unity vector, have the same size of g At each iteration the algorithm aims to decrease the merit function as follows: . The parameter might increase with the number of iteration to approach feasibility. If the merit function is not decreased in the attempted step, the step is rejected and a new step is attempted. VI. CASE STUDY The HS algorithm optimization technique was applied to the modified IEEE 9-bus system given in [15]. The obtained results are compared with [10]. Authors in [10] used a GA approach in order to find optimum location and sizing of TCSCs. The system under test is shown in Figure 4 as a one-line diagram. Data of the system is given in [15].The system consists of 9 buses. System study was carried out at reactive power sent to wind generator from the network are 20% and 40% of its active power. The ranges of TCSCs carried out in this study is from -30% to -70% and from -80% to 20%.
VII. SIMULATION RESULTS & DISCCUSION After running the HS algorithm program to get the starting point of the NLP optimization problem and then the NLP-HS optimization program runs to get the optimal location and sizing of the TCSCs in order to restore system stability after reactive power sent to wind generator from the network are 20% and 40% of its active power, the results are as follows, At reactive power sent to wind generator from the network is 20% of its active power. (wind generator reactive power (Qwind ) = -32.6 MVAr) and the TCSCs range is (-70% to -30%) of the line reactance, the results shows that the insertion of TCSCs changes the percentage of the total losses (Ploss) to the total load (Pload) from 2.016% to 1.6314%, the minimum system voltage (Vmin) from 0.875 p.u to 0.976 p.u, the maximum system voltage angle (δmax) from 12.65 degrees to 3.64 degrees, the minimum system voltage angle from -4.53 degrees to -2.23 degrees and the number of TCSC devices added to the system lines is six. At reactive power sent to wind generator from the network is 40% of its active power. (Qwind = -65.2 MVAr) and the TCSCs range is (-80% to 20%) of the line reactance, the results shows that the insertion of TCSCs changes the percentage of the total losses to the total load from 2.016% to 1.715%, the minimum system voltage from 0.875 p.u to 0.968 p.u, the maximum system voltage angle from 12.65 degrees to 3.69 degrees, the minimum system voltage angle from -4.53 degrees to -4.66 degrees and the number of TCSC devices added to the system lines is four. Table 1 shows system performance results at reactive power sent to wind generator from the network is 20% before and after TCSCs allocation. Table 2 shows sizing and the locations of the TCSCs at reactive power sent to wind generator from the network is 20%. Figure 4 shows (Ploss/Pload) percentage before and after TCSCs allocation. Figure 5 shows minimum system voltage before and after TCSCs allocation. Figure 6 shows minimum system power angle before and after TCSCs allocation.
Fig. 4 IEEE 9-bus system.
2326 Diaa et. al.,
Harmony Search and Nonlinear Programming Based Hybrid Approach to Enhance Power System Performance with Wind Penetration
International Electrical Engineering Journal (IEEJ) Vol. (2016) No.7, pp. 2323-2330 ISSN 2078-2365 http://www.ieejournal.com/ Table 1. System performance at reactive power sent to wind generator from the network is 20% of its active power.
NLP-HS technique with TCSCs range (-30% to -70%)
NLP-HS technique with TCSCs range (-80% to 20%)
2.016
1.67
1.71
1.6314
1.715
0.875
0.974
0.961
0.976
0.968
12.65
7.37
11.2
3.64
3.69
-4.53
-2.01
-2.7
-2.23
-4.66
-
5
5
6
4
Without TCSCs
(Ploss /Pload)% Vmin (p.u) δmax (degree) δmin (degree) Number of devices Qwind (MVAr)
(GA) technique with TCSCs range (-80% to 20%) in [10]
(GA) technique with TCSCs range (-30% to -70%) in [10]
Wind generator reactive power is 20% of its active power
Fig. 4 (Ploss/Pload) percentage at reactive power sent to wind generator from the network is 20% of its active power.
-32.6
Table 2. Location and Sizing of TCSCs at reactive power sent to wind generator from the network is 20% of its active power.
NLP-HS technique with TCSCs range (-80% to 20%)
-70 0 0 0 0 -70 -70 -30 -70 5
NLP-HS technique with TCSCs range (-30% to -70%)
Number of devices
-
(GA) technique with TCSCs range (-80% to 20%) in [10]
Without TCSCs
1-4 4-5 5-6 3-6 6-7 7-8 8-2 8-9 9-4
(GA) technique with TCSCs range (-30% to -70%) in [10]
Wind generator reactive power is 20% of its active power
Line
0 -80 0 -80 -80 -80 0 0 -80 5
-30 -63.92 -70 0 -70 -70 -43.42 0 0 6
0 0 0 20 -46.84 -80 -60.17 0 0 4
Fig. 5 Minimum System Voltage at reactive power sent to wind generator from the network is 20% of its active power.
Fig. 6 Minimum System Power Angle at reactive power sent to wind generator from the network is 20% of its active power.
2327 Diaa et. al.,
Harmony Search and Nonlinear Programming Based Hybrid Approach to Enhance Power System Performance with Wind Penetration
International Electrical Engineering Journal (IEEJ) Vol. (2016) No.7, pp. 2323-2330 ISSN 2078-2365 http://www.ieejournal.com/ Table 4. Location and Sizing of TCSCs at reactive power sent to wind generator from the network is 40% of its active power
Number of devices
-
-70 -30 -70 -70 -70 -70 -70 -63.19 0 8
NLP-HS technique with TCSCs range (-80% to 20%)
1-4 4-5 5-6 3-6 6-7 7-8 8-2 8-9 9-4
NLP-HS technique with TCSCs range (-30% to -70%)
(GA) technique with TCSCs range (-30% to -70%) in [10]
Wind generator reactive power is 40% of its active power
Line
Without TCSCs
At reactive power sent to wind generator from the network is 40% of its active power (wind generator reactive power (Qwind )= -65.2 MVAr) and the TCSCs range is (-70% to -30%) of the line reactance, the results shows that insertion of TCSCs changes the percentage of the total losses (Ploss) to the total load (Pload) from 3.073% to 1.85%, the minimum system voltage (Vmin) from 0.733 p.u to 0.966 p.u, the maximum system angle (δmax) from 17.18 degrees to 2.95 degrees, the minimum system angle from -4.91 degrees to -2.33 degrees and the number of TCSC devices added to the system lines is seven. At reactive power sent to wind generator from the network is 40% of its active power (Qwind = -65.2 MVAr) and the TCSCs range is (-80% to 20%) of the line reactance, the results shows that insertion of TCSCs changes the percentage of the total losses (Ploss) to the total load (Pload) from 3.073% to 1.88%, the minimum system voltage (Vmin) from 0.733 p.u to 0.95 p.u, the maximum system angle (δmax) from 17.18 degrees to 2.6 degrees, the minimum system angle from -4.91 degrees to -3.3 degrees and the number of TCSC devices added to the system lines is seven. Table 3 shows system performance results at reactive power sent to wind generator from the network is 40% of its active power before and after TCSCs allocation. Table 4 shows sizing and the locations of the TCSCs at reactive power sent to wind generator from the network is 40% of its active power before and after TCSCs allocation. Figure 7 shows (Pload/Ploss) percentage before and after TCSCs allocation. Figure 8 shows minimum system voltage before and after TCSCs allocation. Figure 9 shows minimum system power angle before and after TCSCs allocation.
-30 -56.43 -70 -41.74 -70 -70 -61.77 0 0 7
20 -80 -71.02 -7.34 -77.05 -77.9 -48.27 0 0 7
Table 3. System performance at reactive power sent to wind generator from the network is 40% of its active power.
(Ploss /Pload)% Vmin (p.u) δmax (degree) δmin (degree) Number of devices Qwind (MVAr)
3.073 0.733 17.18 -4.91 -
1.86 0.949 2.96 -2.43 8
1.85 0.966 2.95 -2.33 7
NLP-HS technique with TCSCs range (-80% to 20%)
(GA) technique with TCSCs range (-30% to -70%) in [10] NLP-HS technique with TCSCs range (-30% to -70%)
Without TCSCs
Wind generator reactive power is 40% of its active power
Fig. 7 (Ploss/Pload) percentage at reactive power sent to wind generator from the network is 40% of its active power.
1.88 0.95 2.6 -3.3 7
-32.6
2328 Diaa et. al.,
Harmony Search and Nonlinear Programming Based Hybrid Approach to Enhance Power System Performance with Wind Penetration
International Electrical Engineering Journal (IEEJ) Vol. (2016) No.7, pp. 2323-2330 ISSN 2078-2365 http://www.ieejournal.com/ when applying the GA technique in [10] by one than that when applying the NLP-HS optimization technique, the percentage of the ratio (Ploss /Pload) is lower when applying the NLP-HS optimization technique than that obtained by the GA technique in [10]. Finally applying the NLP-HS optimization technique is better than the GA applied in the case of minimum system voltage comparison in [10].
Fig. 8 Minimum System Voltage at reactive power sent to wind generator from the network is 40% of its active power.
IX. CONCLUSION Results show that the capacitive-inductive range of TCSCs in this problem provides fewer TCSC devices than that provided by the capacitive range which makes the capacitive-inductive range of TCSC devices more economic. Results obtained can also show that optimum allocation and sizing of TCSC devices can be obtained within constraints of nodal voltages and thermal capability of lines. Results obtained can also show that when TCSC devices optimally located and sized the minimum system voltage is increased leads to increase in the system stability. The operation limits of the system can also be restored after violation due to reactive power sent to wind generator from the network are 20% and 40% of the wind generator active power through optimal allocation and sizing of TCSC devices. My technique is examined through comparing results with those obtained in [10]. X.REFERENCES [1] F. G. M. Lima, F. D. Galiana, I. Kockar and J. Munoz, “Phase shifter placement in large- scale systems via mixed integer linear programming”, IEEE Trans. Power Syst, vol. 18, no. 3, pp. 1029-1034, Aug. 2003.
Fig. 9 Minimum System Power Angle at reactive power sent to wind generator from the network is 40% of its active power.
VIII. A COMPARISON BETWEEN THE PROPOSED OPTIMIZATION METHOD WITH [10] From the comparison, it can be noticed that: As shown from the previous tables the number of devices obtained from applying the NLP-HS optimization technique is lower than that obtained by the GA technique in [10] in the case of the capacitive-inductive range of the TCSCs at the reactive power sent to wind generator from the network are 20% and 40% of its active power. In all examined cases , after adding the TCSC devices the minimum system voltage is higher when applying NLP-HS optimization technique than that when applying GA technique in [10]. The maximum power angle of the system is lower when applying NLP-HS optimization technique than that when applying GA in [10]. At the case of reactive power sent to wind generator from the network is 20% of its active power and the TCSCs compensation factor is (-30% to -70%) of the line reactance, it is clear that: however the number of TCSC devices is lower
[2] A. berizzi, M. Delfanti, P. Marannino, M. S. Pasquadibisceglie and A. Silvestri, “Enhanced security-constrained OPF with FACTS devices”, IEEE Trans. Power Syst., vol. 20, no. 3, pp. 1597-1605, Aug. 2005. [3] J. A. Momoh and J. Zhu, “Multi-area power systems economic dispatch using nonlinear convex network flow programming”, Electric Power Syst. Research, vol. 59, pp. 13-20, 2001. [4] A. K. Sharma, “Optimal number and location of TCSC and loadability enhancement in deregulated electricity markets using MINLP”, Int. J. of Emerging Electric Power Syst., vol. 5, issue. 1, pp. 1-13, 2006. [5] Whei-Min Lin, S-J. Chen and Y.S Su, “An application of interior point based OPF for system expansion with FACTS devices in a deregulated environment”, 0-7803-6338- 8/00/$10.00 © 2000 IEEE, pp. 1407-1412. [6] Weerakorn Ongsakul and Peerapol Jirapong, “Optimal allocation of FACTS devices to enhance total transfer capability using evolutionary programming”, in IEEE Int. Symposium on Circuits and Systems, ISCAS, vol. 5, May 2005, pp. 4175-4178. [7] T. S. Chung and Y. Z. Li, “A hybrid GA approach for OPF with consideration of FACTS devices”, IEEE Power Engineering Review, pp. 47-50, Feb. 2001. [8] A. Y. Abdelaziz, M. A. El-Sharkawy and M. A. Attia, “Reactive Power Control to Assist Wind Penetration without Effect on System Operation”, IEEJ International Electrical Journal, vol. 7(2016) No.1, pp. 2124-2129.
2329 Diaa et. al.,
Harmony Search and Nonlinear Programming Based Hybrid Approach to Enhance Power System Performance with Wind Penetration
International Electrical Engineering Journal (IEEJ) Vol. (2016) No.7, pp. 2323-2330 ISSN 2078-2365 http://www.ieejournal.com/ [9] M. Saravanan, S. M. R. Slochanal, P. Venkatesh, J. P. S. Abraham, “Application of particle swarm optimization technique for optimal location of FACTS devices considering the cost of installation and system loadability”, Electric Power Syst. Research, vol. 77, pp. 276-283, 2007. [10] Mahmoud A. Attia, Almoataz Y. Abdelaziz and M. A. Elsharkawy, “Enhancing Power System Performance with Growing Wind Power Penetration: optimal Allocation of FACTS”, LAP LAMBERT Academic Publishing, July 2015. [11] Z. Geem, J. Kim, et aI. , "A new heuristic optimization algorithm: harmony search," Simulation 76 (2) (2001) 60-68 . [12] Zong Woo Geem, Novel derivative of harmony search algorithm for discrete design variables Environmental Planning and Management Program, Johns Hopkins University,729 Fallsgrove Dr. #6133, Rockville, MD 20850, USA [13] Geem ZW, Kim JH, Loganathan GV. A new heuristic optimization algorithm: harmony search. Simulation 2001;76 (2):60–8. [14] K. Lee, Z. Geem, A new meta-heuristic algorithm for continuous engineering optimization: harmony search theory and practice, Computer Methods in Applied Mechanics and Engineering 194 (2005) (2005) 3902–3933. [15] Zimmerman, R.D., Murillo-Sanchez, E.C.: Matpower A MatlabTM Power System Simulation Package Version 3.2, User’s Manual (September 21, 2007).
2330 Diaa et. al.,
Harmony Search and Nonlinear Programming Based Hybrid Approach to Enhance Power System Performance with Wind Penetration