Has Web2.0 Reached the Educated Top? Martin Ebner Computing and Information Services / Division of Social Learning Graz University of Technology Graz, Austria
[email protected] Walther Nagler Computing and Information Services / Division of Social Learning Graz University of Technology Graz, Austria
[email protected]
Abstract: On base of a three years study about the Web2.0 competency among freshmen at Graz University of Technology we discuss the question, whether Web2.0 has become common to students of today or not. Following the principles of Moore’s Technology Adoption Life Cycle and bearing Gartner’s Hype Cycle in mind we state that the times of early adopters are over. Those Web2.0 applications that still are not established will not gain higher. The trends have been corroborated but new ones are to come soon. Online mobility will rise with the increasing power of multiple mobile devices as well as the importance of social networking on demand. This paper outlines the progression of several common and uncommon Web2.0 applications in comparison with the results of the study as well as postulates future trends on base of it.
Introduction Since Mark Prensky’s article (2001) about “Digital Natives” and “Digital Immigrants” there is an ongoing discussion about how the young generation is dealing with the World Wide Web. Without any doubt technology influences our daily life and changes our behaviors. Since the introduction of Web 2.0 (O’Reilly, 2004) a dramatically increase of user-generated content can be stated as well as the establishment of social networks and social communities. It seems to be obvious that these technologies also influence the field of education – primarily called e-Learning 2.0 (Downes, 2005) or ubiquitous learning (Zhan & Adipat, 2005). Taking a look at different research studies as well as other popular media channels according to this subject of the growing youth a lot of different terms occur: “Net-Generation” (Tapscott, 1997), “Digital Natives” (Prensky, 2001), “Generation @” (Opaschowski, 1999) or “Homo Zapiens” (Pelevin & Bromfield, 2002). More or less they all describe the same: There is an upcoming generation that cannot imagine living in a world without digital technologies. Mobile phones, Internet access with high bandwidth or mobile and information about different topics on the fly have already become very common. Oblinger (Oblinger & Oblinger, 2005) (Oblinger, 2005) was talking about different habits of this generation emerging such as multi-tasking and new ways of communicating with each other. Similar Green & Hannon stated (2007), “That the use of digital technology has been completely normalized by this generation and it is now fully integrated in their daily life”. On the other hand it can be shown that most of such publications are lacking of solid data. Because of the short time frame there are just a few extended studies on the behavior or skills of our youth. First studies (Conole, 2006) (Bullen et al, 2008) (Margaryan, 2008) (Nagler & Ebner, 2009) gathered data through evaluations to carry out whether freshmen and students of today differ from their older colleagues. All these studies agree more or less with the summary of Schulmeister (2010) who concluded, that there is no significant change detectable as for today’s student. Mainly it was shown that the World Wide Web has a great influence on the youth (JIM 2008, JIM 2009) and is observed as a daily-life requisite. But dramatically rising use of Web 2.0 technologies and in consequence IKT competencies could not have been detected yet.
- 4001 -
Nevertheless, from a university point of view it is of highest interest, to find out the competences of the new generation of students. The most interesting question is, whether it can be predicted that there is change in the behavior of today’s students or it is simply a trend.
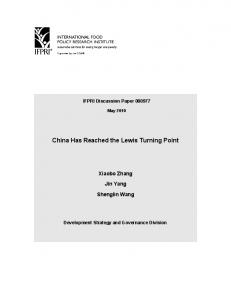
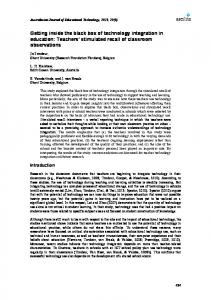
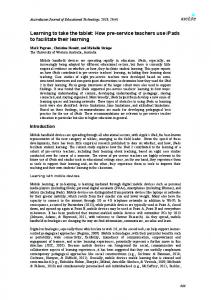
Figure 1: Hype cycle for emerging technologies, 2009 by Gartner (2009)
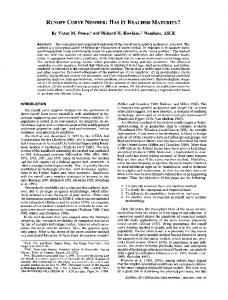
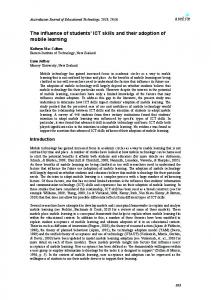
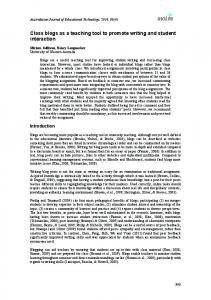
Figure 2: Technology adoption lifecycle by Moore taking the gap in between into account Taking a closer look on analyses of trends it can be ascertained that new technologies commonly follow a distinct progression; they are fast rising to an absolute maximum to go down rapidly alike and consolidate afterwards nearly endlessly in the interest of society. Since 1995 the “Gartner Hype Cycle” (Fig. 1) annually describes the progression of new technologies and points out the famous five phases – Technology Trigger, Peak of Inflated Expectations, Through of Disillusionment, Slope of Enlightenment and Plateau of Productivity. Similar the famous “Technology adoption lifecycle” of Moore (Meade & Rabelo, 2004) (Fig. 2) shows the different kind of users from innovators to laggards. The notably thing about Moor’s lifecycle is, that he “… suggests that for discontinuous or disruptive innovations, there is a gap or chasm between the first two adopter groups (innovators/early adopters), and the early majority.” (Moore, 2002).
- 4002 -
Bearing these phenomena in mind it must be seriously asked whether some technologies are simply hype driven by some very motivated people or have they already turned out to be a mass phenomenon. With other words from a university perspective it must be asked, what can be expected from today’s learners, what must be done by the university to meet their needs and what is simply a technical bubble that will never overcome Moore’s chasm (Fig. 2). For this purpose Graz University of Technology (TU Graz) is carrying out studies since years (Nagler & Ebner, 2009) (Ebner et al, 2008) to investigate different research questions and to prepare TU Graz for the next generation of learners. Therefore we address to the following questions: • Which trends can be seen towards technological equipments? • Which trends can be seen towards internet access at study home? • Which trends can be seen towards communication behavior? • Which trends can be seen towards the usage of e-learning platforms at secondary school level? • Which trends can be seen towards Web2.0 competence?
The Study Technology enhanced learning, briefly called e-learning had been exercised through multiple different initiatives and projects at Graz University of Technology (TU Graz) for many years since the late eighties. Because of several partly political reasons the time for a change has definitely come in 2006. The Vice Rector for Academics, the Office for Life Long Learning, the Institute of Information Systems and Computer Media (IICM) as well as the Computer and Information Services (CIS) – all departments from TU Graz – decided to bundle those individual activities for to become e-learning at TU Graz a centralised service. On the 1st of September 2006 the team “Social Learning” (SL) was set into being as a new part of the CIS. The team quickly established and grew to a new division of the CIS. Main focus of SL is to implement network based, communication oriented teaching and learning in a meaningful didactical sustainable way. Especially for a university of technology it is a must to support them students with latest technological, pedagogical and didactical teaching and learning possibilities. To meet the requirements of this target it is (amongst others) essential to survey the status quo of today’s students according to their ability to handle modern ways of communication and education. For this reason SL has undertaken a freshmen survey since three years in series. At the beginning of a new study year at the end of September new students had the opportunity to meet the so called “Welcome Days” lasting two days where they were introduced to main facts and possibilities of their study life at TU Graz. In the course of their university debut the students were asked to go through a paper pencil survey about their Web2.0 competences as well as their technological equipment regarding computers and mobile devices with a view on their communication behaviours using that equipment. By this year’s evaluation a sample of n=757 questionnaires had been analysed. Together with n=821 collected in 2008 and n=578 from 2007 we can compare a total of 2156 data sets. That is quite a good basis for an analysis of trends. On base of that analysis we can optimize the service and prepare future learning in time. The following chapter describes the results of this year’s study and outlines trends and findings considering all three years to answer the questions addressed in the introduction.
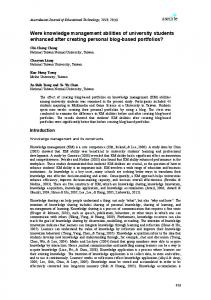
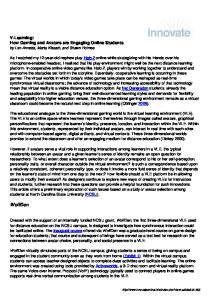
Results and Findings Which Trends Can be Seen Towards Technological Equipments? The first question covers the interest in the technological equipment to get an overview which devices are used by students. Figure 3 displays the results. Multiple answers were possible. Due to a misleading question the results according to the selections “Mobile + www” and “Mobile no www” cannot be compared within the three years. There are some remarkable notices. First of all the decrease of simple iPods and MP3-players can be for sure explained by the raise of iPhone, iPod touch and mobile smartphones which are able to play mp3 files as well as videos. Besides a very constant laptop ownership (about 80% of our students independent of their chosen study) Personal Computers (PC) are decreasing for more than 10%. The trend to mobility can also be seen in the fact that mobile phones with Internet access are owned by about 40%. Together with iPhones (7%) and other mobile phones with Wi-Fi (17%) about 65% (two third) of our students have the possibility to get mobile access to the Internet using their phones. This is not only to be attributed to the fact that new mobiles technically are Internet compatible
- 4003 -
by default, because the number of those having smartphones more than doubled whereas the number of those having mobiles with ordinary Internet access increases a bit – please note that 2007 th value for “Mobile + www” can not be compared, because the selection “Mobile no www” had not been asked, as well as 2008th high value for “Mobile no www” cannot be taken seriously because of misleading questioning – double answers were given. Anyway, the trend according to their technological equipment definitely heads for more mobility and better equipped devices. We can not state with significance that netbooks already have an effect on the distribution of laptops. Comparision of Devices 90,00%
2007
80,00%
2008 70,00%
2009
60,00% 50,00% 40,00% 30,00% 20,00% 10,00% 0,00%
iPod
iPod + Video MP3 Player
Laptop
Netbook
PC
MAC
iPhone
Mobile + WLAN
Mobile + www
Mobile no www
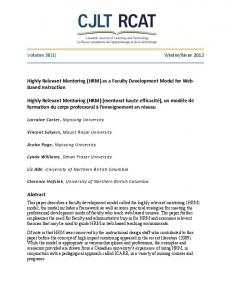
Figure 3: Comparison of devices used by first year’s student at TU Graz between 2007 and 2009; “Mobile no www” had not been asked in 2007 which effects a falsified high value for 2007 th “Mobile + www” Selections “Netbook”, “MAC” and “iPhone” had not been asked in 2007th and 2008th survey Which Trends Can be Seen Towards Internet Access at Study Home? The next question concerns the Internet access of students at their study home. Looking at three years on data there is a remarkable difference between modem access and access with high bandwidth (ADSL) (Fig. 4). Furthermore Figure 4 shows that the mobile access is increasing constantly, from more than 15% in 2007 to nearly 35% nowadays. 2008th fluctuation of the “ADSL” value can be taken as a result of the abnormal high value of “No access” in that year which can be explained by a earlier time of questioning than in the other years; so students not being Graz residents may not had established their Internet connection till then. Internet Access at Study Home 80,00% 70,00% 60,00%
2007
50,00% 40,00%
2008
30,00%
2009
20,00% 10,00% 0,00%
No Access
Modem
ADSL
Mobil
Others
Figure 4: Comparison of Internet access at study home of first year’s student at TU Graz between 2007 and 2009
- 4004 -
Due to the fact that the summary of all access possibilities is much higher than 100% it can be stated that there are a couple of students with multiple access to the Internet. No access to the World Wide Web can be more or less excluded – the student of today entering our university is connected to the Internet. So the trend according to Internet access is pointing at a constantly increasing mobile one. This underlines and correlates very well with the results from the research question about technological equipment. Furthermore we see that there is no peak or hype towards any of the selections offered. Which Trends Can be Seen Towards Communication Behavior? Another very interesting question deals with the communication behavior of freshmen. The students had to specify which ways they use for there digital communication and to what extent. They had to decide between “never”, “rarely (several times in a month)”, “often (several times in a week)” and “daily” for each way of communication. Because we were interested in the intensive use of communication ways, for the bars displayed in Figure 5 only the “often” and “daily” hits were taken. In case the selection “rarely” would have been added to the figure, there would be no significant difference to the shown results in relation but the portion of interest could not be presented obviously. Furthermore it must be pointed out that the selection “Others” does not include the possibility of Short Message Services (SMS) or MMS (Multimedia Messaging Service).
Figure 5: Comparison of communication behaviour of first year’s student at TU Graz between 2007 and 2009 Values similar to answers given for “often” plus “daily” use Remarkable increase of selection “Others” in 2009th survey Selections “Twitter” and “Weblog” had not been asked in 2007th and 2008th survey The results are not very surprisingly except the one remarkable increase of selection “Others” and the very low use of the microblogging platform Twitter. Email is used intensively by about 90% of the students consistently; nearly 100% use it in any way. Email still remains the main communication way. A slight increase regarding the use of the instant messaging application Skype at the expense of other instant messaging tools can be assumed not least because of a similar slight increase of “rarely” used VoIP technology (“rarely” parts are not shown in Fig. 5). So there are no relevant changes according to those variants of communication ways; no hype trends but smooth progressions with little significance.
- 4005 -
In contrast really unexpected is the result for the use of Twitter. Although the “Overall usage of Web2.0” (Fig. 7) levels the low values for Twitter use to what we would have assumed it is a fact that about 60% stated, they even do not know Twitter (Fig. 7). This is noteworthy insofar Twitter has gone through Gartner’s life cycle peak at the end of June this year (Fig. 1) in correlation with the death of Michael Jackson. According to Gartner’s life cycle Twitter should decline from now on, but still enjoys increasing popularity worldwide which can be seen easily at any webpage traffic stat analysis site (such as alexa.com). Taking a look at new Twitter accounts and their user’s behavior Gartner’s phase of disillusionment is already dawning (Sistrix, 2009). Another even more astonishing fact is the booming increase of other communication ways. One of the main findings of the survey is the enormous increase of social communities in general and of Facebook in particular. Because today’s social community platforms offer a lot of different possibilities to contact and communicate with each other the peak of “Others” can be argued by that. For there is no general decrease according to the rest of the communication behavior we assume that young students communicate more and like to use multiple ways to do so. Future studies will show whether social communities will have the power to displace traditional ways of communication just like email and instant messaging or not. Which Trends Can be Seen Towards the Usage of E-learning Platforms at Secondary School Level? The next question addresses the use of e-learning platforms in schools and in general. The students had to state their usage of e-learning platforms. In comparison to last years surveys (2007 and 2008) there is no significant difference. The usage of e-learning platforms at secondary schools is still no widespread standard. Even the free and open elearning platform software Moodle did not cause a hype of e-learning platforms used in secondary schools, although it is a fact that in case a school uses an e-learning platform it is no other than Moodle. Academic homepages are still more popular than e-learning platforms at all. There is little use of non academic e-learning platforms. Figure 6 displays the results. Usage of E-Learning Platforms before Study 90,00% 80,00% 70,00%
Schoole Moodle
60,00% 50,00%
Schoole Platform
40,00%
School Homepage
30,00% 20,00%
E-Learning Plattform outside School
10,00% 0,00%
never
rarely
often
daily
not checked
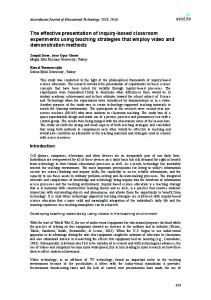
Figure 6: Usage of e-learning platforms of first year’s student at TU Graz in 2009 Which Trends Can be Seen Towards Web2.0 Competence? The most interesting question of the survey covers the Web2.0 competences of the young students. For the several Web2.0 applications they first had to state whether they actually know about it or not. In case they do know they had to give precise answers about their usage. They could choose between “unknown”, “passive (just reading)” or “active (writing and uploading)” usage as well as a usage for learning purposes. Figure 7 and Figure 8 display the results of this question. The pattern “in use” in Figure 7 comprise “passive”, “active” and “for learning”.
- 4006 -
Overall Usage of Web2.0 100% 90% 80% 70% 60% 50% 40%
not checked unknown
30%
in use
20% 10%
Social Bookm
andere microblogs
andere Media Sharing
Locr
andere virtuelle Welten
delicious
Second Life
QR
Andere Communy
Xing
Twitter
Flickr
andere Wikis
RSS
Videopods
Audiopods
Weblogs
MySpace
Facebook
StudiVz
YouTube
Wikipedia
0%
Figure 7: Overall usage of Web2.0 of first year’s student at TU Graz in 2009. Use of Web2.0 in Details 400,00%
350,00% Other Microblog Locr Other Virt. World delicious
300,00%
QR RSS Twitter Other MediaSharing
250,00%
Flickr YouTube 200,00%
Second Life Videopods Audiopods Other community
150,00%
Facebook Xing StudiVz Social Bookm Other Wikis
100,00%
Wikipedia MySpace Weblogs
50,00%
0,00% passive
active
for learning
not checked
Figure 8: Usage of Web2.0 in details of first year’s student at TU Graz in 2009.
- 4007 -
In general we can say that Web2.0 applications are more used than in the two years of the study before (Ebner et al, 2008) (Nagler & Ebner, 2009). The active usage has declined a bit whereas the passive use strongly increased. That means that the awareness level of Web2.0 applications has been strengthened but was no sufficient reason for more intensive usage. Overall Wikipedia and YouTube are still the most used Web2.0 application in that context closely followed by social communities. Rather uncommon media sharing-, microblogging- as well as social bookmarkingplatforms are of least interest to our new students although they are even better known than higher ranked applications. If a look is taken at the passive use at all we found out that YouTube is used most frequently (65%) followed by weblogs (33%) and podcasts (video as well as audio, each 30%). For the first time we can state that Wikipedia is more often used for learning efforts than Youtube in a passive way and that Wikipedia is passive more used than other wikis at all. Flickr doubled its passive usage (25%) as well as the one of the RSS technology did. There is a tiny pleasant increase according to the usage for learning purposes whereas the diversity in that category suffers a bit. Only Wikipedia is used by 66% (44% in 2008)) of the polled students for learning efforts; other wikis and YouTube hardly reached a 7% but such as videopods and audiopods they doubled in a year. All other applications are to be neglected for learning efforts. Nevertheless this again is a signal for teachers that Wikipedia should be taken serious for common search and knowledge acquisition as well as online media sharing slowly gains in importance. As mentioned before there is an outstanding raise of social communities to be noticed with Facebook strongly booming. To indicate values, studiVZ which is still the most popular community in Austria (and German speaking countries as well) hiked from 70% in 2008 to 80% this year, Facebook rockets from 16% last year to incredible 67%, MySpace gained to 55% from 45% as well as Xing from 5% to 12% which is interesting for people assumed to be not involved into the working environment so much yet. Even other communities enjoy a doubling up to 8%. If a closer look is done we find out that Facebook is actively used in nearly the same amount as studiVZ already. With 50% and 55% they leave the other Web2.0 applications far behind. Only MySpace with 27% and YouTube with 26% of active usage have appreciable results, which is as much as a passive usage of Wikipedia (26%). Compared to the Austrian wide active usage of Facebook which ranks about 10% (Wiese 2009) we can state that on the one hand Facebook currently hypes among the young generation and on the other it seems to be established among the general population. So the most frequently active usage of Web2.0 applications are social communities by far. But there are some more remarkable results. Although Twitter is apparently minimal used for communication efforts (Fig. 5) the overall usage of Twitter has powerfully increased to 20% from 2% in 2008. From that point of few the hype cycle of Twitter can be comprehended but remains controversial. QR-codes still are not booming as generally predicted as well as rather specific tools like the international very popular bookmarking platform “del.icio.us” or “locr” for media sharing with geotagging mainly used in German speaking countries (compare Schulmeister, 2009). So after three years of investigation for some of the applications questioned we slightly can predict that there will be no hype in future among our students. Furthermore trends have been approved such as the steady increase of videopods, audiopods and weblogs in general or the elapsed hype of virtual realities.
Discussion and Conclusion It is a fact that TU Graz offers its teachers and students a lot of different possibilities to execute a technology enhanced driven teaching and learning with focus on Web2.0 using multiple devices at the classroom or outside (Ebner et al, 2010). To optimize these services and prepare for future ones annual surveys among freshmen take place. In summary we can state that today’s students are not only very well equipped and have increasing mobile access to the Internet but the general tendency clearly indicates more mobility and more smart devices like mobiles with WLAN account of rather simple devices like ordinary mobiles or iPods without video functionality as well as MP3 players. The trend to more mobility can also be seen if a look is taken on the internet access at student’s home. Secondly there is a very distinct trend to social communities over the last three years. Whereas virtual worlds like “Second Life” have definitely never really boomed yet among the polled students although those realities are well know by a majority. Exemplarily QR-codes (Falas & Kashani, 2007) neither have reached common popularity in Austria yet nor are known among this year’s freshmen. This means in general that although some technologies follow the typical lifecycle by Gartner and enjoy high approval in one part of the world, it may bomb in another part and will not break Moore’s chasm to reach the phase of majority.
- 4008 -
The general booming of Facebook can be affirmed exceedingly for freshmen of TU Graz as well. But it is not only Facebook that takes it all, all surveyed social communities (studiVZ, MySpace, Xing as well as others) gain a high increase. The growing is a constantly one except for Facebook that has quadrupled within one year. It does not seem that Facebook already peaked out or even has reached the climax; according to Gartner’s hype cycle there is a little delay (Nitz, 2009) (Anderegg, 2009). But there is another effect the strongly intensified sympathy for Facebook evokes. We can document a very high increase of using “other communication ways” than those asked by name. In context with the outstanding rise of Facebook we can assume that communication using social communities has become very popular and is therefore breaking new grounds. Nevertheless there is no significant decrease of using standardized ways of communication like email, instant messaging or newsgroups. Because Facebook has been clever enough to open its platform for other common Web2.0 applications and makes it easy to integrate them individually a further side effect of the boom is that people slowly get used to work with those Web2.0 achievements like microblogging or smart media sharing habits as well as embedding items from different sources following mashup philosophy (Kulathuramaiyer & Maurer, 2007). This means that students get used to online editing practices more and more; the acceptance of Web2.0 is strengthened, the way for an online desktop working environment is being paved, cloud computing seems to switch from concept to practice. University teaching should take care about those results and work with social communities in an educated way. There are several publications telling us how to do so (Ebner & Maurer, 2009). The survey approves common trends in communication and Web2.0 behaviour. Popular Web2.0 applications and habits have been established, too specific ones will not in future; some are constantly used, some pass through a hype cycle currently. The way of communicating seems to be in flux as well as the way of using mobile devices. If a university takes care of its students this study again outlines the importance for universities not only to pay attention to those facts and progresses but to integrate them into every day teaching and learning life for to reach the Plateau of Productivity.
References Anderegg, L. (2009). Hype-Cycle: Verliert Facebook den Reiz?. Retrieved April 2010 from http://bernetblog.ch/2009/09/08/hype-cycle-verliert-facebook-den-reiz/ Bullen, M., Morgan, T., Belfer, K., & Oayyum, A. (2008). The digital learner at BCIT and implications for an e-strategy. EDEN Annual Conference, 2008 Conole, G., de Laat, M., Dillon, T., & Darby, J. (2006). LXP:Student experiences of technologies. Final Report: JISC UK. Retrieved December 2008 from http://www.jisc.ac.uk/whatwedo/programmes/elearningpedagogy/learneroutcomes Downes, S. (2005). E-Learning 2.0. ACM eLearn Magazine, October 2005 (10) Ebner, M., Scerbakov, N., Taraghi, B., Nagler, W., & Kamrat, I. (2010). Teaching and Learning in Higher Education – An Integral Approach. In C. Crawford et al. (Eds.), SITE International Conference 2010, AACE, 428-436. Ebner, M., Schiefner, M., & Nagler, W. (2008). Has the Net-Generation Arrived at the University? oder Studierende von Heute, Digital Natives? Offener Bildungsraum Hochschule, Medien in der Wissenschaft, 48, 113-123. Ebner, M., & Maurer, H. (2009). Can Weblogs and Microblogs Change Traditional Scientific Writing?. Future Internet 1, 1, 4758. Falas, T., & Kashani, H. (2007). Two-Dimensional Bar-Code Decoding with Camera-Equipped Mobile Phones. Fifth IEEE international Conference on Pervasive Computing and Communications Workshops, PERCOMW, IEEE Computer Society, 597- 600. Gartner Inc. (2009). Hype Cycle for Emerging Technologies, 2009. Retrieved April 2010 http://www.gartner.com/DisplayDocument?doc_cd=169368&ref=g_fromdoc Green, H., & Hannon, C. (2007). Their Space: Education for a digital generation. London: DEMOS. Retrieved December 2009 from http://www.demos.co.uk/files/Their%20space%20-%20web.pdf JIM Study (2008). JIM 2008, Jugend, Information, (Multi-)Media – Basisstudie zum Medienumgang 12- bis 19-jähriger in Deutschland. Retrieved December 2009 from http://www.mpfs.de/fileadmin/JIM-pdf08/JIM-Studie_2008.pdf JIM Study (2009). JIM 2009, Jugend, Information, (Multi-)Media – Basisstudie zum Medienumgang 12- bis 19-jähriger in Deutschland. Retrieved December 2009 from http://www.mpfs.de/fileadmin/JIM-pdf09/JIM-Studie2009.pdf Kulathuramaiyer, N., & Maurer, H. (2007). Current Developments of Mashups in Shaping Web Applications. EdMedia International Conference 2007, ACCE, 1172-1177
- 4009 -
Margaryan, A., & Littlejohn, A. (2008). Are digital natives a myth or reality?: Students’ use of technologies for learning. Draft paper. Meade, P. T., & Rabelo, L. (2004). The technology adoption life cycle attractor: Understanding the dynamics of high-tech markets. Technological Forecasting and Social Change, 71(7), 667-684. Moore, G. A. (2002). Crossing the Chasm. Harper Paperbacks, revised edition. Nagler, W., & Ebner, M. (2009). Is Your University Ready For the Ne(x)t Generation?. EdMedia International Conference 2009, AACE, 4344-4351. Nitz, O. (2009). Social Media Hype Cycle - Strategische Einschätzung von Web 2.0-Werkzeugen für das Online-Destinationsmanagement. Retrieved April 2010 from http://www.slideshare.net Pelevin, V., & Bromfield, A. (2002). Homo Zapiens. Penguin Prensky, M. (2001). Digital natives, Digital Immigrants, On the Horizon, 9 (5), p. 1-6. Oblinger, D. D., & Oblinger, J. L. (2005). Educating the Net Generation. Educause. Retrieved December 2008 from http://www.educause.edu/educatingthenetgen Oblinger, J. L. (2005). Is it age for IT: First steps Towards Understanding the Net Generation. Educating the Net Generation, 2.11.5. Retrieved December 2008 from http://www.educause.edu/ir/library/pdf/pub7101b.pdf Opaschowski, H. W. (1999). Generation @, Die Medienrevolution entläßt ihre Kinder: Leben im Informationszeitalter. Hamburg/Ostfildern: Kurt Mair Verlag. O’Reilly, T. (2004). What is Web 2.0: Design patterns and business models for the next generation of software. Retrieved December 2008 from http://www.oreillynet.com/pub/a/oreilly/tim/news/2005/09/30/what-is-web-20.html Schulmeister, R. (2009). Studierende, Internet, E-Learning und Web 2.0. GMW09, 129-140. Schulmeister, R. (2010). Gibt es eine Net Generation? [Does the Net Generation exist?]. Germany: University of Hamburg. Retrieved February 2010 from http://www.zhw.uni- hamburg.de/uploads/schulmeister-net-generation_v3.pdf Sistrix (2009). Twitter Wachstum. Retrieved April 2010 from http://www.sistrix.de/news/909-twitter-wachstum.html Tapscott, D. (1997). Growing up digital: The Rise of the Net Generation. New York: McGrwa-Hill. Van den Boogart, M. R. (2004). Uncovering the social impacts of Facebook on a college campus, Thesis. Manhattan, KS 66506: Kansas State University Wiese, J. (2009). Nutzerzahlen Österreich, Schweiz, Luxemburg. Retrieved April 2010 from http://facebookmarketing.de/allgemeines/nutzerzahlen-osterreich-schweiz-luxemburg Zhang, D. S., & Adipat, B.(2005). Challenges, methodologies, and issues in the usability testing of mobile applications. International Journal of Human-Computer Interaction, 18(3), 293-308.
- 4010 -