2010 Fourth International Conference on Genetic and Evolutionary Computing
Heart Rate Prediction Model based on Physical Activities using Evolutionary Neural Network Feng Xiao, Yi-min Chen, Ming Yuchi and Ming-yue Ding Life College of Science and Technology Huazhong University of Science and Technology Wuhan, China Email:
[email protected]
Actual HR from the monitor
Abstract—Physical activity (PA) can influence heart rate(HR). But the relationship between HR and PA is hard to describe. In our previous works, HR prediction models based on PA were designed. However, the prediction time length and accuracy are usually hard to compromise. In this study, a new HR prediction method is proposed. The predicted HR is used as the input in the next prediction step. Only HR at the initial time step and PA signals are needed in a long prediction time length. Evolutionary neural network is used as the mathematic basic of the predictor to ensure the prediction accuracy. The results show the predicted HR can trace the actual HR well.
HR(n)
…
PA(n)
̚
HR (n + 1) predictor
HR(n+1) PA(n+1)
Time step n
̚ ( n + 2) HR
predictor
…
One-step prediction
Time step n+1
Predicted HR directly used as the input in the next time step prediction HR(n)
…
Keywords-Heart Rate; Physical Activity; Evolutionary Neural Network; Multi-Step Prediction;
PA(n)
predictor
̚ HR ( n + 1)
Time step n
̚ HR (n + 1)
̚
PA(n+1)
predictor
HR (n + 2)
Time step n+1
…
Multi-step prediction
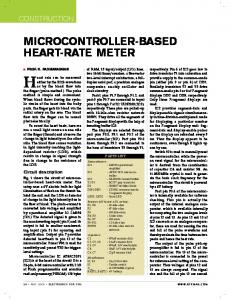
Figure 1: Single-step and multi-step prediction concept: HR with a wave line above is the predicted HR while actual HR does not have a wave line
I. I NTRODUCTION Heart Rate (HR) signal analysis is widely used in the medicine and medical research area. It is recognized [1] [2] [3] that physical activities (PA) have great effects on the changes of heart rate. However, few works had discussed the relationship between PA and HR: Pawar el al. [4] presented one body movement activity detection system which was based on ECG signal, but not HR. Meijer el al. [5] built a linear relationship between the HR and the body movements. However, the experiments were implemented in specific conditions and the body movement was recorded as the counted number of activities, which could not appropriately reflect the actual PA. The main purpose of this paper was to build a prediction model using the feedforward neural network to reflect the effects of PA on the HR. The model was based on the author’s previous works [6] [7] [8] where models for single time step and multiple time step prediction were designed respectively. The single time step prediction and multiple time step prediction was showed in Fig. 1. The multiple time step prediction [8] aims at performing a longer time length prediction, but comparing to the single time step prediction [6] [7], its accuracy was much worse. The object of this paper is to design a model for multi-step prediction with a relative high accuracy. Feedforward neural network (FFNN) [9] was chosen as the mathematical model of the predictor for its intrinsic 978-0-7695-4281-2/10 $26.00 © 2010 IEEE DOI 10.1109/ICGEC.2010.56
Jun Jo School of Information and Communication Technology Griffith University Queensland, Australia Email: j.jo@griffith.edu.au
nonlinearity and computational simplicity. Different from our previous works, Evolutionary Algorithm was used to optimise the structure and inner weight of the FFNN to ensure the accuracy of the mutiple time step predictor. Four signals were recorded: HR and accelerations in 3 directions:𝑥, 𝑦, 𝑧. After preprocessing, the four synchronized time sequences 𝐻𝑅(𝑛) and 𝐴𝑐𝑥(𝑛), 𝐴𝑐𝑦(𝑛), 𝐴𝑐𝑧(𝑛) were used as the training and test data set for the predictor. Considering that all of the signals are non-constrained and real-time data, the predictor has the potential to be used in various areas, such as: cardiopathy research and diagnosis, heart attack warning indicator, sports capability measure and mental activity evaluation, etc. II. T HE R ESEARCH M ETHOD A. HR Prediction Model To investigate the relationship between the HR and PA, all the signals need to be recorded simultaneously. The left part of Fig. 2 shows the subject (user) wearing the monitor. The specification of the monitor will be described in Section II-B. 198
and each acceleration segment has 𝑁𝑎𝑐 samples: ̚
HR(n) Heart rate hr(m) Physical Activity
𝑁𝑎𝑐 = 𝑆𝑎𝑚𝑝𝑙𝑖𝑛𝑔𝑅𝑎𝑡𝑒𝑎𝑐 × 𝜏.
̚
ACX(n) Preprocessor ACY(n)
HR (n + 1) Multi-step Predictor
When 𝝉 = 4s, HR segment has 1 sample/s× 4s = 4 samples (𝑁ℎ𝑟 ), and each acceleration segment has 75 samples/s×4s = 300 samples (𝑁𝑎𝑐 ). Then, the 𝑛𝑡ℎ (𝑛 = 1, . . .,𝑁 ) ℎ𝑟 segment is converted into 𝐻𝑅(𝑛) with the equation 4, and the 𝑛𝑡ℎ 𝑎𝑐𝑥, 𝑎𝑐𝑦, 𝑎𝑐𝑧 segments are converted into 𝐴𝑐𝑥(𝑛), 𝐴𝑐𝑦(𝑛), 𝐴𝑐𝑧(𝑛) with the equation 5.
ACZ(n)
acx(l), acy(l), acz(l)
Figure 2: The Block diagram of the whole system in this work: HR with a wave line above is the predicted heart rate while HR without a wave line is the real heart rate
𝑛×𝑁 ∑ℎ𝑟
Table I: Data Specifications of Alive Heart Monitor 𝑆𝑖𝑔𝑛𝑎𝑙 Channels/Axis Resolution Sampling Rate Dynamic Range Bandwidth
𝐸𝐶𝐺 Single Channel 8 bits 1 samples/sec -2.66𝑚𝑉 - 2.66𝑚𝑉 0.5𝐻𝑧 - 90𝐻𝑧
𝐻𝑅(𝑛) =
𝐴𝑐𝑐𝑒𝑙𝑒𝑟𝑜𝑚𝑒𝑡𝑒𝑟 3 Axes 8 bits 75 samples/sec -2.7𝑔 - 2.7𝑔 0𝐻𝑧 - 20𝐻𝑧
𝑚=(𝑛−1)×𝑁ℎ𝑟 +1
𝑛×𝑁 ∑𝑎𝑐
𝐴𝑐𝑥(𝑛) =
B. Heart Rate and Physical Activity Recorder
𝐴𝑐𝑦(𝑛) =
Many studies on HR are based on the experimental data gathered in specific conditions and/or environments, whereas, this research was conducted with the data collected from normal daily activities, without any pre-planned routine. Consequently, a portable device is needed, which can monitor and record the HR and PA signals simultaneously for a period of time with relatively high accuracy. According to the device requirements, one commercial product Alive Heart Monitor (AHM) is chosen for our experiments. The collected data can be saved in an internal SD memory card or transmitted to PC, smart phone or PDA using Bluetooth in real time. The data specification of the AHM is shown in Table. I.
𝐴𝑐𝑧(𝑛) =
;
𝑙=(𝑛−1)×𝑁𝑎𝑐 +1
𝑎𝑐𝑥(𝑙) ,
𝑁𝑎𝑐
𝑙=(𝑛−1)×𝑁𝑎𝑐 +1
𝑎𝑐𝑦(𝑙)
𝑁𝑎𝑐 𝑛×𝑁 ∑𝑎𝑐 𝑙=(𝑛−1)×𝑁𝑎𝑐 +1
𝑁𝑎𝑐
(4)
, 𝑎𝑐𝑧(𝑙) .
(5)
It should be noted that the function of 𝜏 is not only to synchronize the inputs to neural network, but also to help stabilize the prediction accuracy through averaging the noises. This works well, especially when some signals have random noises. D. Evolutionary Neural Network 𝐻𝑅(𝑛) and 𝐴𝑐𝑥(𝑛), 𝐴𝑐𝑦(𝑛), 𝐴𝑐𝑧(𝑛), 𝐻𝑅(𝑛) and 𝐻𝑅(𝑛 + 1) showed nonlinear relationships in the data set obtained from the AHM, especially when 𝜏 is a relatively large value. Therefore, a mathematical method aiming at nonlinear prediction is needed. FFNN appears to be a good candidate. With a certain structure, multi-layer FFNN can be used as a general function approximator [10]. Normally, the FFNN is trained with backpropagation method for its good local search ability, but trapping in the local extremum and slow convergence speed are still big problems. Here, Evolutionary Algorithm was adopted for the optimization and training of the FFNN, not only for the inner weights of FFNN, but also the neural network structure of FFNN. Because 3-layer FFNN can approximate any continuous function with arbitrary precision [11], 3layer FFNN was selected as the model of this predictor. Considering that the number of neuron is always integer and weight values are always real number, Simple Genetic Algorithm(SGA) [12] and Evolutionary Strategy(ES) [13] were selected for optimizing the hidden neuron number and inner weights respectively for their different encodings.
C. Signal Preprocess The sampling rates of HR and acceleration are set differently in the AHM, 1 samples/sec and 75 samples/sec respectively, but the inputs of the neural network are required to be sequences with same sampling rate. Here, ℎ𝑟(𝑚) and 𝑎𝑐𝑥(𝑙), 𝑎𝑐𝑦(𝑙), 𝑎𝑐𝑧(𝑙) are converted into four synchronized sequences 𝐻𝑅(𝑛) and 𝐴𝑐𝑥(𝑛), 𝐴𝑐𝑦(𝑛), 𝐴𝑐𝑧(𝑛) through a processing period 𝜏 . Assume the whole recording period is 𝑇 , the recorded data on each signal channel are evenly divided into N segments, where each segment has the length of 𝝉 : (1)
and 𝑓 𝑙𝑜𝑜𝑟(𝑥) rounds 𝑥 to the nearest integer towards minus infinity. The recorded data are divided into N segments on each channel. Each HR segment has 𝑁ℎ𝑟 samples: 𝑁ℎ𝑟 = 𝑆𝑎𝑚𝑝𝑙𝑖𝑛𝑔𝑅𝑎𝑡𝑒ℎ𝑟 × 𝜏,
ℎ𝑟(𝑚)
𝑁ℎ𝑟
𝑛×𝑁 ∑𝑎𝑐
𝑁 = 𝑓 𝑙𝑜𝑜𝑟(𝑇 /𝝉 ).
(3)
(2)
199
Inputs
Hidden layers
Output layers Start
SGA
ES
̚ HR(n) Layer Number FFNN Structure
ACX(n)
FFNN Weights and Biases
...
̚ HR(n+1)
ACY(n)
Data set
Calculation
FFNN Predictor
ACZ(n) Prediction Error
Figure 3: Two-layer FFNN structure No Stop criterion
III. E XPERIMENT
Yes
A. Experiment Specifications
End
In this paper, the experiment subject was a 33 years male with no record of heart disease. The recording time period was 90 minutes (preprocess interval=30s). During this continuous period, the subject wore an AHM and performed the daily activities. The recorded signals were evenly separated as two parts. In the two schemes, the first part of signals(45min) were adopted as the training set, which was used to train the FFNN; the remaining part of signals(45min) was for the test set, which was used to validate the trained neural network. Therefore, for both the training and test sets, N = 90.The signals 𝐻𝑅(𝑛) and 𝐴𝑐𝑥(𝑛), 𝐴𝑐𝑦(𝑛), 𝐴𝑐𝑧(𝑛) of the training set and test set were preprocessed using 4 and 5, and would be used in our follow experiment. C/C++ was chosen as the programming language. Threelayer FFNN was selected as the predictor for this experiment. The four inputs of the FFNN were the predicted HR of ˜ the previus time step 𝐻𝑅(𝑛) and 𝐴𝑐𝑥(𝑛), 𝐴𝑐𝑦(𝑛), 𝐴𝑐𝑧(𝑛). ˜ The output layer (the last layer) had one neuron, 𝐻𝑅(𝑛+1), the predicted HR of the next time step. The structure of FFNN was optimised using the SGA for 100 generations in which the weights and biases inside FFNN were searched by ES for 200 generations. Fig. 3 shows the general structure of FFNN used in this paper. Fig. 4 shows the whole process flowchart of this work.
Figure 4: the flowchart of the method
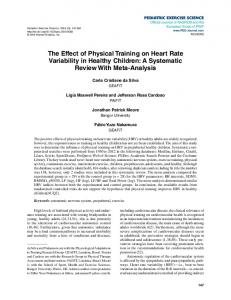
corresponding Mean Absolute Errors (MAEs) on training set and test set are 4.1680 and 4.3818. Considering that the experiment was worked on real-life data, the MAEs on both training and test sets are acceptable. However, the variances of the error are still large relatively: 7.6743 and 12.9578 for training set and test set respectively. It can be found that, some residual errors of test set are as big as 15-20, although most of the residual errors are smaller than 5. The MAEs of the predictor increased obviously as the prediction interval raised. However, a larger prediction interval could also bring more useful information into a same size training set and often represents a better performance of the predictor. IV. C ONCLUSION AND F UTURE W ORK In this experiment, prediction was performed every 30 seconds. Predicted results were close to the actual data. The mean absolute error could be restricted within a small range (inside 5). The consistency of the prediction needs be improved and will be addressed in the future work. To validate the universality of the proposed method and improve the neural network performance, more and deeper investigations should be implemented. Firstly, more and various Data from subjects of varying age, gender and health level should be tested. Secondly, more tests on different system parameters should be made, including prediction interval, the type of neural network. total time length and sampling rate of the hardware. And the most important factor to improve this system may be the PA Preprocess part. More useful signals preprocessed from PA (standard deviation,
B. Experiment Results The performance of the neural network predictor on the training set and test set is shown in Fig. 5. To make a clear identification, the predicted 𝐻𝑅(𝑛+1) is denoted with a red unbroken line, while the actual 𝐻𝑅(𝑛 + 1) is represented by a blue dashed line. The figures indicate that the predicted 𝐻𝑅(𝑛 + 1) can trace the variance of 𝐻𝑅(𝑛 + 1) on both the training set and test set after training. The Residual Errors(RE) between the actual 𝐻𝑅(𝑛 + 1) ˜+ 1) are also shown in Fig.5. The and the predicted 𝐻𝑅(𝑛
200
[4] T. Pawar, S. Chaudhuri and S.P. Duttagupta, Body movement activity recognition for ambulatory cardiac monitoring, IEEE Trans. on Biomed. Eng., vol.54: 874-882, 2007.
trainning set 130 actual predicted
120
[5] G.A. Meijer, K.R. Websterp and H. Koper, Assessment of energy expenditure by recording heart rate and body acceleration, Medicine and Science in Sports and Exercise, vol.21: 343-347, 1989.
Heart Rate
110 100 90
[6] M. Yuchi and J. Jo, Heart Rate Prediction Based on Physical Activity Using Feedforwad Neural Network, International Conference on Hybrid Information Technology: 344-350, 2008.
80 70
0
10
20
30
RE
20
40 50 prediction steps
60
70
80
90
[7] F. Xiao, M. Yuchi, M. Y. Ding, J. Jo and W. G. Hou, A Research of Physical Activitys Influence on Heart Rate Using Feedforward Neural Network, International Symposium on Neural Network: 1089-1096, 2009.
0 −20
0
10
20
30
40 50 prediction steps
60
70
80
90
(a)
[8] F. Xiao, M. Yuchi, M. Y. Ding, J. Jo and J. H. Kim, A Multistep Heart Rate Prediction Method based on Physical Activity using Adams-Bashforth Technique, IEEE International Symposium on Computational Intelligence in Robotics and Automation: 355-359, 2009.
test set 120 actual predicted
Heart Rate
110
100
[9] M.T. Hagan, H.B. Demuth and M.H.Beale, Neural Network Design, PWS Publishing, Boston, US, 1996.
90
[10] K. Hornik, M. Stinchcombe and H. White, Multilayer feedforward networks are universal approximators, Neural Networks, vol.2: 359-366, 1989.
80
70
0
10
20
30
RE
20
40 50 prediction steps
60
40 50 prediction steps
60
70
80
90
[11] R.H. Nielsen, Kolmogorov’s mapping neural network existence theorem, Proceedings of the International Conference on Neural Networks , vol.3:593-605, 1987.
0 −20
0
10
20
30
70
80
90
[12] J.H. Holland, Adaptation inNatural and Artificial Aystem, University of Michigan Press, Ann Arbor, 1975.
(b)
[13] H.G. Beyer and H.P. Schwefel, Evolutionary Strategies: A comprehensive introduction, Natural Computing, vol.1: 3-52, 2002.
Figure 5: The performance of the proposed predictor.(a) Training set; (b) Test set.
[14] S. Haykin, Neural Networks: A Comprehensive Foundation, Macmillan College Publication, NewYork, US, 1994.
gradient) could be added into the predictor as inputs. Another possible varying factors include: data structure and improved training algorithm. R EFERENCES [1] K. Rennie, T. Rowsell, S.A. Jebb, D. Holburn, and N.J. Wareham, A combined heart rate and movement sensor: proof of concept and preliminary testing study, European Journal of Clinical Nutrition, vol.54: 409-414, 2000 [2] H.L. Chan, M.A. Lin, P.K. Chao and C.H. Lin, Correlates of the shift in heart rate variability with postures and walking by time frequency analysis, Computer Methods and Programs in Biomedicine, vol.86: 124-130, 2007 [3] W. Wang, J.R. Wei, D.C. Zhang, S.Z. Xiao and F.C. Wang, A study on 6-minute walk test incorporating cardiac contractility and heart rate change measurements, Chinese Medical Equipment Journal, vol.24: 16-18, 2003.
201