HEART RATE VARIABILITY ESTIMATES SLEEPINESS EFFECTS ON THE PVT http://dx.doi.org/10.5665/sleep.1688
Heart Rate Variability Can Be Used to Estimate Sleepiness-related Decrements in Psychomotor Vigilance during Total Sleep Deprivation Eric Chern-Pin Chua, PhD1; Wen-Qi Tan, BEng2; Sing-Chen Yeo, BSc3; Pauline Lau, BSc1; Ivan Lee, BSc1; Ivan Ho Mien, BEng, MBBS4; Kathiravelu Puvanendran, MBBS, MRCP, FRCP, FAMS3; Joshua J. Gooley, PhD1
1 Program in Neuroscience and Behavioral Disorders, Duke-NUS Graduate Medical School Singapore; 2Division of Bioengineering, National University of Singapore; 3National Neuroscience Institute, Singapore; 4Graduate School for Integrative Sciences and Engineering, National University of Singapore
Study Objectives: To assess whether changes in psychomotor vigilance during sleep deprivation can be estimated using heart rate variability (HRV). Design: HRV, ocular, and electroencephalogram (EEG) measures were compared for their ability to predict lapses on the Psychomotor Vigilance Task (PVT). Setting: Chronobiology and Sleep Laboratory, Duke-NUS Graduate Medical School Singapore. Participants: Twenty-four healthy Chinese men (mean age ± SD = 25.9 ± 2.8 years). Interventions: Subjects were kept awake continuously for 40 hours under constant environmental conditions. Every 2 hours, subjects completed a 10-minute PVT to assess their ability to sustain visual attention. Measurements and Results: During each PVT, we examined the electrocardiogram (ECG), EEG, and percentage of time that the eyes were closed (PERCLOS). Similar to EEG power density and PERCLOS measures, the time course of ECG RR-interval power density in the 0.02- 0.08Hz range correlated with the 40-hour profile of PVT lapses. Based on receiver operating characteristic curves, RR-interval power density performed as well as EEG power density at identifying a sleepiness-related increase in PVT lapses above threshold. RR-interval power density (0.02-0.08 Hz) also classified subject performance with sensitivity and specificity similar to that of PERCLOS. Conclusions: The ECG carries information about a person’s vigilance state. Hence, HRV measures could potentially be used to predict when an individual is at increased risk of attentional failure. Our results suggest that HRV monitoring, either alone or in combination with other physiologic measures, could be incorporated into safety devices to warn drowsy operators when their performance is impaired. Keywords: Sleepiness, PVT, HRV, ECG, heart rate, EEG, PERCLOS Citation: Chua ECP; Tan WQ; Yeo SC; Lau P; Lee I; Mien IH; Puvanendran K; Gooley JJ. Heart rate variability can be used to estimate sleepinessrelated decrements in psychomotor vigilance during total sleep deprivation. SLEEP 2012;35(3):325-334.
INTRODUCTION Sleepiness is a major cause of vehicular and occupational accidents, resulting in a large societal and economic burden.1,2 Insufficient sleep results in a broad range of performance deficits, including decreased vigilance, slower response times, increased errors, and impaired decision making.3 These performance deficits and the inability to resist falling asleep contribute to automobile crashes and industrial accidents (e.g., the Exxon Valdez oil spill and nuclear accidents in Chernobyl and on Three Mile Island).4 Sleep loss can result from acute sleep deprivation, daily sleep restriction (e.g., ≤ 6 h of sleep per night), or when sleep is disrupted as part of a sleep disorder. The effects of sleepiness on performance have been compared with the effects of being intoxicated with alcohol. After 24 hours of sustained wakefulness, performance decrements on some tasks are similar to those observed at a blood alcohol concentration of 0.10%, beyond the legal limit for driving.5 A similar negative impact of sleep loss on performance has been demonstrated when individuals are tested after a week of sleep restriction
with only 6 hours of time in bed per night.6 Of particular concern, self-rated sleepiness and performance can become dissociated during sleep deprivation. Hence, a person’s perceived level of alertness often does not correspond with his or her actual decline in vigilance during sleep loss. Given that sleepiness increases a person’s risk for attentional failure, errors, and accidents, many technologies have been developed to assess vigilance and performance levels in real time.7 Such technologies aim to warn the user when a lapse in performance is likely to occur and, if coupled with an appropriate intervention, could potentially prevent an accident from taking place. Technologies that seek to monitor online an individual’s physiologic state have primarily focused on features of the eyes, face, and head. Several ocular measures have been examined as indicators of fatigue, including eye blinks, pupil responses, saccadic eye movements, and percentage of eyelid closure over the pupil over time (PERCLOS). Of these measures, PERCLOS has been shown to correlate with lapses in visual attention and measures of simulated driving performance during sleep loss.8,9 Although PERCLOS data can be collected noninvasively from dashboard-mounted cameras, it can be difficult to obtain quality retinal reflections from some users’ eyes, and PERCLOS does not always work well during the daytime when sunlight is being reflected inside the vehicle.10 Similar to ocular measures, electroencephalogram (EEG) monitoring can be used to track changes in drowsiness and fatigue.11,12 At present, however, such monitors are not very practical for ambulatory or in-vehicle use.Given that each fatigue-monitoring technology has its limitations, an integrated system that assess-
A commentary on this article appears in this issue on page 307. Submitted for publication April, 2011 Submitted in final revised form September, 2011 Accepted for publication October, 2011 Address correspondence to: Joshua J. Gooley, PhD, Duke-NUS Graduate Medical School, 8 College Road Singapore 169857; Tel: 65 6516 7430; Fax: 65 6221 8625; E-mail:
[email protected] SLEEP, Vol. 35, No. 3, 2012
325
Heart Rate Variability Correlates with Vigilance—Chua et al
es multiple bio-signals simultaneously may perform better than any one measure taken alone. Here, we examined heart rate variability (HRV) as a potential adjunct to existing measures of sleepiness derived from the eyes, face, and head. As demonstrated by routine clinical use of 24-hour Holter monitoring, electrocardiogram (ECG) signals can be collected continuously in diverse operational settings. In addition, new technologies allow for noncontact recording of heart-beat measurements.13 Recently, it was shown that some measures of HRV can be used to predict daytime performance levels.14 In the present study, we extend these findings by examining whether HRV can be used to estimate changes in sustained visual attention during total sleep deprivation. We show that, similar to EEG and PERCLOS measures, RR-interval power density in the 0.02- to 0.08-Hz frequency range correlates strongly with lapses on the Psychomotor Vigilance Task (PVT) and can be used to estimate decrements in PVT performance caused by sleepiness.
horizontally at the level of the subjects’ eyes was approximately 0.6 lux (range = 0.59 to 0.63 lux; 1.1 to 2.4 μW/cm2). After completing the CR procedure, participants were given a 12-hour sleep opportunity before being discharged from the study. Researchers were present at all times during the 4-day study to carry out research procedures and to ensure protocol compliance. Subjective Sleepiness and Performance Testing Every 2 hours during the CR procedure, subjects completed the Karolinska Sleepiness Scale (KSS),16 which is a 9-point scale for assessing sleepiness with responses ranging from “very alert (1)” to “very sleepy, great effort to keep awake, fighting sleep (9).” Subjects also completed a visual analogue scale (VAS),17 which asked participants to rate how they feel on a line labeled with the word pair “sleepy” and “alert” at opposite ends. Sustained visual attention was assessed using a 10-minute PVT. During the PVT, participants were required to maintain their fastest possible reaction time (RT) to a simple visual stimulus with random interstimulus intervals between 2 and 10 seconds.18 PVT lapses were defined as RTs that exceeded 0.5 seconds. The first test battery was given 4.5 hours after wake time, resulting in a total of 18 PVT test sessions during the CR procedure.
METHODS Subjects Young healthy Chinese men (n = 24) (mean age ± SD = 25.9 ± 2.8 years) were enrolled in a 4-day study at the Chronobiology and Sleep Laboratory (CSL), Duke-NUS Graduate Medical School Singapore. Health was assessed by screening questionnaires and self-reported medical history. Participants had an average body-mass index of 22.3 ± 2.7 kg/m2 and reported no use of medications or nicotine products. Individuals with an extreme chronotype (< 31 or > 69 on the Horne-Östberg questionnaire) or Pittsburgh Sleep Quality Index score of greater than 7 were excluded (mean ± SD = 3.5 ± 1.6). Subjects were ineligible if they had a history of shift work or if they travelled across time zones within 3 weeks prior to the start of the study. For at least 1 week before being admitted to the CSL, participants were required to maintain a fixed sleep-wake cycle of their choice (8 hours sleep, 16 hours wake), which was verified by actigraphy monitoring (Actiwatch-L, MiniMitter, Inc., Bend, OR). During prestudy screening, subjects were asked to avoid caffeine, alcohol, and over-the-counter medications. Informed consent was obtained from all participants, and research procedures were approved by the SingHealth Centralized Institutional Review Board. Procedures were in compliance with the Health Insurance Portability and Accountability Act regulations and the Declaration of Helsinki.
Physiologic Measurements and Signal Processing The ECG, EEG, and EOG were recorded continuously during the CR procedure. Signals were bandpass-filtered at 0.3 to 35 Hz and recorded at 200 Hz using a Comet Portable EEG system from Grass Technologies (Astro-Med, Inc., West Warwick, RI). Subjects were asked to press an event marker to mark the onset and offset of PVT testing in the EEG recording. Occasionally, participants forgot to press the event marker, in which case a research technician made an annotation manually in the EEG record using a separate event marker. Given that the timing of pressing the event marker did not always coincide exactly with the onset or offset of the PVT, performance and physiologic signals (see below) were assessed during the middle 8 minutes between marked events, to ensure that physiologic data were analyzed only during the PVT. The ECG
The ECG was recorded with a single-channel modified V5 lead. QRS peaks were detected using a Hilbert transform-based method,19 and the RR-interval time series was determined. Spectral analysis was performed on each RR-interval series using the Lomb-Scargle periodogram method.20 We examined conventional HRV spectral analysis metrics defined by the Task Force for Heart Rate Variability Analysis.21 These metrics include RR-interval spectral power in very-low-frequency (VLF, ≤ 0.04 Hz), low-frequency (LF, 0.04 – 0.15 Hz) and high-frequency (HF, 0.15 – 0.40 Hz) bands, normalized LF and HF power, and the ratio of LF to HF power. In separate analyses, RR-interval power density was determined in 0.02-Hz bins from 0.0 to 0.4 Hz.
Protocol Subjects lived individually for 4 days at the CSL in a soundattenuated and windowless environment that was shielded from external time cues. Participants arrived in the evening and went to bed at their regular prestudy sleep time. After an 8-hour sleep opportunity, subjects underwent a 40-hour constant routine (CR) procedure consisting of wakefulness enforced by research staff, semi-recumbent position in bed, and consumption of hourly equicaloric snacks.15 Ambient light was provided by ceiling-mounted light-emitting diode lamps that were dimmed to less than 5 lux (1.9 μW/cm2). Illuminance was measured at a height of 187 cm with an ILT1400 radiometer that was fitted with an SEL-033/ Y/W detector (International Light Technologies, Inc., Peabody, MA) aimed directly at the ceiling lamps. Illuminance measured SLEEP, Vol. 35, No. 3, 2012
The EEG
The EEG was recorded from the z-line using the International 10-20 System for electrode placement, with frontal (Fz), central (Cz), parietal (Pz) and occipital (Oz) derivations and 2 mastoid references (A1 and A2). Each derivation was averaged online 326
Heart Rate Variability Correlates with Vigilance—Chua et al
Data Analysis and Statistics
to obtain a single mastoid-referenced channel (e.g., Fz-AVG = [Fz-A1 + Fz-A2] / 2). Each EEG signal (i.e., Fz, Cz, Pz, Oz) was visually inspected for eye blinks, slow eye movements, and artifacts caused by body movements or cardiac activity. Twosecond non-overlapping epochs containing eye blinks, slow eye movements, muscle activity, or cardiac activity were excluded. On average, 23.2% ± 2.9% of epochs were free of artifacts, corresponding to 55.7 ± 6.9 epochs per PVT session. There was a small but significant decline in artifact-free epochs within each PVT session, ranging from 24.8% ± 3.3% during the first minute, to 21.7% ± 2.8% during the last minute of each 8-minute EEG segment (1-way repeated-measures analysis of variance; F22,7 = 5.37, P < 0.001). Data from 1 subject could not be used due to technical problems in the EEG recording. Artifact-free epochs during each PVT were subjected to spectral analysis using the modified periodogram method (200-Hz sampling rate, Hamming window, 512-point fast Fourier transform, 0.39-Hz bin resolution). For each PVT session, EEG power spectral density (PSD) was determined by averaging PSD in artifact-free epochs in 0.5-Hz bins from 0.5 to 16 Hz. In separate analyses, EEG PSD was averaged across delta (1.0-4.5 Hz), theta (4.5-8.5 Hz), alpha (8.5-12.5 Hz), and beta (12.5-15.5 Hz) frequency bands.22 To generate group plots, the EEG PSD in each frequency band was log transformed and averaged between subjects.
Correlation between PVT lapses and physiologic measures
We performed Pearson correlation analysis to determine the strength of the linear relationship between PVT lapses and each physiologic measure. After applying a z-transformation to normalize PVT performance and physiologic data within subjects, we determined the Pearson correlation coefficient (r) in each participant and then averaged between subjects. We also performed group correlation analyses, in which data from all subjects were combined prior to determining the Pearson correlation coefficient. Since all analyses were performed using normalized data, the group correlation coefficient for any given pairwise comparison was identical to the average of individual r values. Within subjects, statistical comparisons between r values for different physiologic measures vs PVT lapses were performed using the method described by Steiger, in which a Z statistic is calculated.24 The critical significance level was corrected for multiple comparisons using the Bonferroni correction (0.05 / n). Receiver operating characteristic analysis
Receiver operating characteristic (ROC) analysis was used to compare the relative performance of PERCLOS, RR-interval PSD (0.02-0.08 Hz), frontal EEG PSD (1.0-4.5 Hz), and subjective sleepiness (VAS) at predicting an increase in PVT lapses above threshold.25 The binary classification task was to identify a threshold increase (> 25%, > 50%, or > 75%) in the number of PVT lapses, measured relative to each subject’s performance during baseline (see below). These arbitrary thresholds were chosen to span different degrees of performance impairment. In most individuals, PVT lapses exceeded the 25% threshold within 2 hours after habitual bedtime; at this threshold, participants began to show an unambiguous decline in PVT performance and an increase in subjective sleepiness. Thereafter, PVT lapses increased monotonically and, in most participants, exceeded the 50% threshold during the middle of the night. The 75% threshold occurred close to habitual wake time, when most subjects were struggling to keep awake. PVT performance usually improved within the next few hours, with PVT lapses dropping below the 50% and 25% thresholds in some but not all participants. Baseline performance in individuals was determined as the median number of PVT lapses per session during the first 16 hours of wakefulness. For each subject, the range of PVT lapses was then taken as the difference of the session with the maximum number of lapses during the CR procedure and the median number of lapses during baseline. Hence, the threshold for a 25% increase in PVT lapses was computed as 0.25 times the range plus baseline. For each physiologic measure, data were z-transformed within subjects and then pooled to construct an ROC curve. The optimal classification threshold was one that maximized the function: Sensitivity – m(1–Specificity). Specifically, a slope of the tangent to the ROC curve m was defined as
The EOG
The EOG electrodes were placed lateral to the outer canthus of each eye, with leads located slightly above (right eye) and below (left eye) the bicanthal plane. Each EOG electrode was referenced to the contralateral mastoid electrode (A1 or A2). EOG data were manually scored for eye blinks by a single scorer. For each PVT session, the middle 8-minute EOG segment was divided into 240 two-second, non-overlapping epochs. The number of epochs containing at least 1 eye blink was determined for each PVT session. Eye-tracking
To assess PERCLOS, eye-tracking data were collected during the PVT in a subset of subjects (n = 15). Pupil diameter of the left eye was recorded at 120 Hz using an ISCAN eyetracker (ISCAN, Inc., Woburn, MA). PERCLOS was defined as the percentage of time that the pupil was at least 80% covered by the eyelid.8 Given that PERCLOS assesses slow eyelid closures, rather than blinks, we excluded eye-closure events shorter than 400 ms; this threshold for eye-blink duration falls within the range recommended for determining PERCLOS (300 to 500 ms).23 Core body temperature
Core body temperature was collected wirelessly using an ingestible VitalSense temperature transmitter (Minimitter, Inc., Bend, OR). Subjects swallowed the telemetric sensor just prior to bedtime on the first day of the study. Core temperature was transmitted to a VitalSense Integrated Physiologic Monitor placed near the subject. Five subjects who passed the sensor during the CR procedure were given a second telemetry transmitter, and data from 3 subjects were lost due to equipment failure. Temperature data were collected every minute and averaged during each PVT session. SLEEP, Vol. 35, No. 3, 2012
where FP is false positive, FN is false negative, and p is the pretest probability.26 Cost ratios were selected using SigmaPlot 327
Heart Rate Variability Correlates with Vigilance—Chua et al
A
Sleep
1
Day of study
11 software (ROC Curves Module; Systat Software Inc., San Jose, CA) and were set at 1.0, 0.5, and 0.25 for 25%, 50%, and 75% PVT lapse thresholds. Pretest probability was estimated empirically from the data, giving p equal to 0.41 for a greater than 25% increase in PVT lapses, p equal to 0.25 for a greater than 50% increase in PVT lapses, and p equal to 0.13 for a greater than 75% increase in PVT lapses. To assess the relative performance of different physiologic measures at classifying whether a subject had performance above threshold vs performance below threshold on the PVT, we compared the area under ROC curves (AUC) using a nonparametric approach, as previously described.25,27 The χ2 statistic and associated P value for pairwise AUC comparisons were determined using SigmaPlot 11 software.
Constant routine * * * * * *
2 3
*
*
*
Constant routine * * * * * *
*
*
*
Sleep
Sleep
4 8
12
16
20
24
4
8
Clock time (h)
B Number of lapses
25
RESULTS
PVT lapses
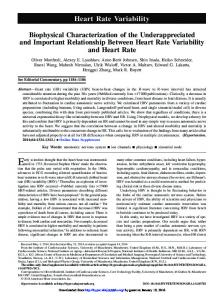
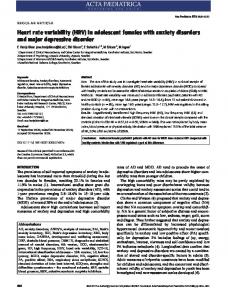
Time Course of PVT Performance and Physiologic Measures Subjects were kept awake continuously for 40 hours, during which they completed a 10-minute PVT every 2 hours to assess their ability to sustain visual attention (Figure 1A). During the usual hours of sleep, RT and the number of PVT lapses per session (RT > 0.5 s) increased sharply, reaching their highest levels at about 24 hours after wake (Figure 1B and Figure S1A). Thereafter, PVT performance improved but did not recover fully to baseline levels when subjects were rested (i.e., performance during the first 16 h of wake). This partial improvement in PVT performance after 24 hours of wakefulness was presumably due to increased circadian drive for alertness, which closely tracks the circadian rhythm of body temperature (Figure S1B).22 The profile of subjective sleepiness was similar to that observed for PVT lapses (r = 0.59 ± 0.04, P < 0.001), with highest levels of sleepiness reported between 20 and 26 hours after wake time (Figure 1C and Figure S1C). To determine whether HRV can be used to track changes in PVT performance during sleep deprivation, we examined the RR-interval time series during each PVT session (Figure 2A-B). Heart rate (i.e., 60 divided by the average of RR intervals) showed a strong circadian rhythm similar to the body-temperature profile, whereas the standard deviation of RR intervals (SDNN) showed a time course that more closely resembled the profile for PVT lapses (Figure S2). Next, we examined conventional HRV spectral analysis metrics, including spectral power in VLF, LF, and HF bands of the RR-interval time series. The profiles of VLF spectral power and PVT lapses were similar, suggesting that some measures of RR-interval PSD track a person’s ability to sustain visual attention (Figure S2). To examine this possibility in greater detail, we assessed the time course of RR-interval PSD in 0.02-Hz bins from 0.0 to 0.4 Hz. PSD in the 0.02- to 0.08-Hz frequency range, which spans the upper part of the VLF band and the lower part of the LF band, correlated most strongly with PVT lapses (r = 0.68 ± 0.03, P < 0.001; Table 1 and Figure 2C). In this frequency range, the correlation coefficient (r ) for RR-interval PSD versus PVT lapses was significantly greater than the r value for either VLF or LF PSD vs PVT lapses (Z = 4.66, P < 0.001; Z = 5.66, P < 0.001). Similar to the profile for PVT lapses, RR-interval PSD in the 0.02- to 0.08-Hz frequency range increased during the habitual hours of sleep and then showed
20 15 10 5 0
0
8
16
24
32
40
32
40
Time since wake (h)
C
Sleepy →
80
Subjective sleepiness
60
40
20
0
8
16
24
Time since wake (h) Figure 1—Protocol for measuring sleepiness-related changes in physiology and performance. (A) Subjects participated in a 4-day laboratory protocol that included a 40-h constant routine procedure in dim light (< 5 lux). The protocol shown is for a representative subject with habitual bedtime at midnight. Black bars show scheduled sleep episodes in darkness. Every 2 hours, subjects completed the Karolinska Sleepiness Scale, a visual analogue scale for sleepiness, and a 10-minute Psychomotor Vigilance Task (PVT; asterisks). (B) Lapses on the PVT increased during the usual hours of sleep and reached their highest levels at about 24 h after wake. Thereafter, performance showed partial recovery toward the baseline rested state. (C) Subjective sleepiness measured with the visual analogue scale (VAS) showed a similar profile to PVT lapses, with highest levels of sleepiness reported between 20 and 26 h after wake. Vertical reference lines in B and C indicate habitual bedtime and wake time. Error bars show SEM. SLEEP, Vol. 35, No. 3, 2012
328
Heart Rate Variability Correlates with Vigilance—Chua et al
A
B
RR-interval
2.5
RR interval (s)
2.0
ECG (mV)
1.4
Well-rested
1.2
1.5 1.0 0.5
1.0 0.8 1.2
0.0
1.0
-0.5
0.8
0
1
2
3
4
5
Sleep-deprived
1.4
0
2
0.8
D
RR-interval PSD
0.6
3.8
0.2 0.0
3.2
-0.2 0.0
0.1
0.2
0.3
3.0
0.4
F
EEG PSD
0.6
0
8
24
2.0
32
40
1.0-4.5 Hz
1.9
0.4 0.2 0.0
1.8 1.6
-0.2 -0.4
0
2
4
6
8
10
12
14
1.6
16
0
8
160
H
Eye blinks
140 120 100 80 60 0
8
16
24
16
24
32
40
Time since wake (h)
32
40
Percentage eye closure
Number of epochs
16
Time since wake (h)
Log µV 2
Correlation with lapses (r)
0.8
40
10
0.02-0.08 Hz
Frequency (Hz)
G
8
3.4
Frequency (Hz)
E
6
3.6
0.4
-0.4
4
Time (min)
Log ms2
C
Correlation with lapses (r)
Time (s)
PERCLOS
40 30 20 10 0 0
Time since wake (h)
8
16
24
32
40
Time since wake (h)
Figure 2—Time course of heart rate variability, electroencephalographic (EEG) spectral power, and ocular measures during sleep deprivation. (A) The RR-interval time series during each Psychomotor Vigilance Task (PVT) was determined from the peak of consecutive QRS complexes (open circles) in the electrocardiogram (ECG). (B) As shown in a representative subject, variability in the RR-interval time series was low during the habitual hours of wakefulness, and increased during sleep deprivation. (C) RR-interval power spectral density (PSD) in the 0.02- to 0.08-Hz frequency band correlated most strongly with PVT lapses. (D) The time course of RR-interval PSD in this frequency range increased during the usual hours of sleep, and then decreased after 24 h of wake, similar to the profile of PVT lapses shown in Figure 1B. (E) For EEG PSD-derived measures, delta power (1.0-4.5 Hz) measured in the frontal derivation correlated most strongly with PVT performance. (F) The time course of delta power tracked the profile of PVT lapses and subjective sleepiness. (G) Eye blinks showed an inverted profile relative to PVT lapses, whereas (H) the time course of PERCLOS matched the profile of PVT performance during 40 h of sustained wakefulness. Vertical reference lines in D, F, G, and H indicate habitual bedtime and wake time. Error bars show SEM. SLEEP, Vol. 35, No. 3, 2012
329
Heart Rate Variability Correlates with Vigilance—Chua et al
Table 1—Correlation of different physiologic measures with PVT lapses during 40 hours of sustained wakefulness
Measure Signal type PERCLOS Eye-tracking RR-interval PSD (0.02 - 0.08 Hz) ECG RR-interval SDNN ECG Delta power (Fz) EEG VAS (Sleepiness) Self-report RR-interval VLF power ECG RR-interval LF power ECG KSS Self-report Delta power (Cz) EEG Eye blinks EOG Theta power (Pz) EEG Theta power (Cz) EEG Time since wake Time Delta power (Oz) EEG Theta power (Oz) EEG Delta power (Pz) EEG Theta power (Fz) EEG Core body temperature Temperature Heart rate ECG Alpha power (Oz) EEG RR-interval HF power ECG Alpha power (Pz) EEG Alpha power (Fz) EEG Alpha power (Cz) EEG Beta power (Fz) EEG Beta power (Oz) EEG Beta power (Cz) EEG Beta power (Pz) EEG
Correlation coefficient (r ± SEM) 0.77 ± 0.04* 0.68 ± 0.03* 0.67 ± 0.04* 0.65 ± 0.04* 0.59 ± 0.04* 0.57 ± 0.05* 0.56 ± 0.05* 0.56 ± 0.04* 0.54 ± 0.06* -0.51 ± 0.07* 0.49 ± 0.06* 0.46 ± 0.07* 0.45 ± 0.04* 0.45 ± 0.06* 0.45 ± 0.09* 0.44 ± 0.08* 0.37 ± 0.07* -0.30 ± 0.06* -0.26 ± 0.07* -0.21 ± 0.11* 0.19 ± 0.06* -0.11 ± 0.10 -0.09 ± 0.10 -0.09 ± 0.10 -0.05 ± 0.09 -0.02 ± 0.08 -0.02 ± 0.09 0.02 ± 0.10
% of subjects with correlation P < 0.05 86.7 90.0 90.0 87.0 66.7 80.0 65.0 66.7 60.9 60.9 60.9 52.2 50.0 47.8 65.2 60.9 47.8 20.0 25.0 56.5 20.0 39.1 39.1 43.5 30.4 30.4 26.1 26.1
PSD, delta activity was relatively stable during the first 16 hours of wakefulness, followed by a sharp increase during the usual hours of sleep. After a peak in delta activity 22 to 26 hours after wake, delta power decreased but remained higher than levels measured 24 hours earlier at the same relative clock times (Figure 2F). By comparison, theta (4.5-8.5 Hz) activity increased during the night but remained elevated after 24 hours of wake, alpha power (8.5-12.5 Hz) was lowest during the usual hours of sleep, and power in the beta band increased monotonically shortly after habitual bedtime (Figure S4). PERCLOS correlated positively with PVT performance (r = 0.77 ± 0.04, P < 0.001), whereas eye blinks showed an inverted profile relative to PVT lapses (r = -0.51 ± 0.07, P < 0.001; Figure 2G-H). Hence, as PVT performance became increasingly impaired from 16 to 24 hours after wake, subjects blinked less frequently, but the percentage of time that their eyes were closed increased.22 Of all physiologic measures examined, PERCLOS correlated most strongly with PVT lapses (Table 1), with an r value that was significantly greater than that observed for RR-interval PSD (0.02-0.08 Hz), frontal EEG delta power, and self-rated sleepiness (Z > 3.28 and P < 0.001 for all pairwise comparisons).
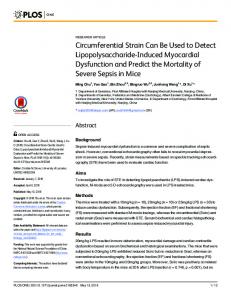
ROC Curves for Estimating PVT Lapses To compare the relative performance of HRV at predicting an increase in PVT lapses vs other measures of sleepiness, we constructed ROC curves for RR-interval PSD (0.02-0.08 Hz), frontal EEG PSD (1.0-4.5 Hz), PERCLOS, and self-reported sleepiness (Table 2 and Figure 3A). For each PVT session, the binary classification task was to deterThe Pearson correlation coefficient (r ) was determined for each physiologic measure mine whether a subject would show a greater than vs Psychomotor Vigilance Task (PVT) lapses. Here, the mean r ± SEM is shown across 25% increase in lapses from baseline, measured subjects, with r values ranked in descending order of magnitude. Asterisks indicate significant relative to each individual’s range of PVT perforgroup correlations (P < 0.001). The percentage of subjects with a significant correlation mance during 40 hours of wakefulness. between each physiologic measure and PVT lapses is shown in the far right column. ECG, ROC curves for RR-interval PSD (0.02-0.08 electrocardiogram; EEG, electroencephalogram; EOG, electrooculogram; PERCLOS, Hz) and PERCLOS were similar, with mean AUC percentage of eyelid closure over the pupil over time; PSD, power spectral density; SDNN: values of 0.87 ± 0.02 and 0.89 ± 0.02, respectively standard deviation of RR intervals; VLF, very low frequency; LF, low frequency; HF, high (χ2 = 0.56, P = 0.45; Table 2). At their respective frequency; VAS, visual analogue scale; KSS, Karolinska sleepiness scale. optimal thresholds, RR-interval PSD classified subject performance with 76% sensitivity and 89% partial recovery toward the baseline rested state after 24 hours specificity, and PERCLOS classified subject performance with of wakefulness (Figure 2D). 78% sensitivity and 88% specificity. By comparison, self-reportNext, we compared our findings for HRV with validated ed sleepiness and frontal EEG delta power performed worse at measures of sleepiness derived from EEG PSD and ocular meadetermining a greater than 25% increase in PVT lapses; AUC sures (Table 1). We examined EEG PSD in 0.5-Hz bins from values for these measures were 0.83 ± 0.02 and 0.82 ± 0.02, re0.5 to 16 Hz (Fz, Cz, Pz, and Oz; Figure 2E and Figure S3). The spectively (Table 2). EEG frequency band that correlated most strongly with PVT To address the possibility that the relative performance of lapses was delta (1.0-4.5 Hz) measured from the frontal derivaRR-interval PSD at classifying subject performance would tion (r = 0.65 ± 0.04, P < 0.001). Although the correlation coefchange at different thresholds for PVT lapses, we also compared ficient for RR-interval PSD (0.02-0.08 Hz) vs PVT lapses was AUC for greater than 50% and greater than 75% increases in higher than that observed for frontal EEG delta power (0.68 and PVT lapses (Table 2). Across different thresholds, RR-interval 0.65, respectively), the difference in r values was not significant PSD provided the closest performance relative to PERCLOS (Z = 1.05, P = 0.29). Similar to PVT lapses and RR-interval at correctly identifying an increase in the number of PVT lapsSLEEP, Vol. 35, No. 3, 2012
330
Heart Rate Variability Correlates with Vigilance—Chua et al
es. PERCLOS outperformed Table 2—Relative performance of different physiologic measures at identifying an increase in PVT lapses above RR-interval PSD at the 50% threshold threshold (χ2 = 6.71, P = 0.01), Sensitivity (%) Specificity (%) but not at the 75% threshold P value Measure AUC ± SE (95% CI) (95% CI) χ2 2 for PVT lapses (χ = 2.58, 25% PVT lapse threshold P = 0.11). By comparison, PERCLOS 0.89 ± 0.02 78.0 (69.0 – 85.4) 87.6 (81.5 – 92.2) PERCLOS outperformed EEG RR-interval PSD 0.87 ± 0.02 75.8 (68.2 – 82.5) 89.1 (84.1 – 93.0) 0.56 0.45 PSD and self-rated sleepiness Sleepiness (VAS) 0.83 ± 0.02 66.9 (59.4 – 73.7) 83.5 (78.3 – 87.8) 7.37 0.007 at all thresholds tested (χ2 > 7.3 Delta power (Fz) 0.82 ± 0.02 76.3 (69.2 – 82.5) 76.3 (70.5 – 81.5) 8.74 0.003 and P < 0.01 for all pairwise 50% PVT lapse threshold comparisons). PERCLOS 0.89 ± 0.02 76.9 (64.8 – 86.5) 87.3 (82.0 – 91.6) Given that PERCLOS was RR-interval PSD 0.85 ± 0.02 73.4 (63.3 – 82.0) 84.6 (79.7 – 88.7) 6.71 0.01 measured in a subset of parDelta power (Fz) 0.82 ± 0.03 70.8 (61.1 – 79.2) 83.8 (79.2 – 87.7) 16.25 < 0.0001 ticipants, we also compared Sleepiness (VAS) 0.78 ± 0.02 60.6 (50.7 – 69.8) 80.5 (75.8 – 84.7) 16.38 < 0.0001 AUC only in subjects in whom 75% PVT lapse threshold eye-tracking data were collectPERCLOS 0.91 ± 0.02 81.3 (63.6 – 92.8) 87.4 (82.5 – 91.3) ed (n = 14 without any missRR-interval PSD 0.86 ± 0.02 87.5 (74.8 – 95.3) 78.5 (73.6 – 83.0) 2.58 0.11 ing data). Consistent with our Delta power (Fz) 0.82 ± 0.03 77.8 (64.4 – 88.0) 76.9 (72.2 – 81.2) 18.53 < 0.0001 findings in the larger group, Sleepiness (VAS) 0.79 ± 0.03 60.0 (45.9 – 73.0) 81.7 (77.4 – 85.5) 18.75 < 0.0001 PERCLOS performed better than RR-interval PSD at Physiologic measures are ranked by area under the curve (AUC) of receiver operating characteristic (ROC) curves the 50% threshold (χ2 = 6.18, in descending order of magnitude at different Psychomotor Vigilance Task (PVT) lapse thresholds. Sensitivity P = 0.01) but not at the 25% or and specificity values were determined at the optimal classification threshold, with 95% confidence intervals (CI) 75% thresholds for PVT lapses shown in parentheses. At each PVT lapse threshold tested, the AUC of ROC curves for RR-interval PSD (0.02-0.08 (χ2 = 1.70, P = 0.19; χ2 = 2.79, Hz), self-reported sleepiness (visual-analog scale [VAS]), and electroencephalographic (EEG) delta power were P = 0.10; Table S1). PERCLOS compared to the AUC for percentage of eyelid closure over the pupil over time (PERCLOS). For each pairwise comparison, the χ2 statistic is shown. outperformed frontal EEG delta power at all thresholds tested (χ2 ≥ 6.03 and P ≤ 0.01), in addition to self-reported sleepiness at 50% and 75% thresholds results indicate that it is possible to estimate whether a subject for PVT lapses (χ2 ≥ 8.20 and P < 0.01). At the 25% threshold, will show an increase in PVT lapses above threshold by comhowever, the difference in AUC for PERCLOS vs self-rated paring his RR-interval PSD (0.02-0.08 Hz) at any point in time sleepiness did not reach statistical significance (χ2 = 3.00 and with his RR-interval PSD when he is well rested. P = 0.08). In the analyses described above, physiologic measures that DISCUSSION were collected during sleep deprivation were z-transformed Our results demonstrate that HRV can be used to estimate within subjects prior to ROC analysis. In a real-world setting, sleepiness-related lapses in psychomotor vigilance. During 40 a person’s physiologic response to sleep deprivation would not hours of sustained wakefulness, RR-interval PSD in the 0.02be known in advance; hence, it would be necessary to estimate to 0.08-Hz range performed nearly as well as PERCLOS at a person’s normalization parameters using only his physiologic classifying subject performance on the PVT. These laboratory data at baseline. We therefore tested our HRV-based approach findings suggest that ECG-derived measures could potentially for estimating subject performance using leave-1-subject-out be used to assess an individual’s sleepiness level, similar to excross-validation to z-transform each individual’s RR-interval isting technologies that derive fatigue or sleepiness estimates PSD data. In the training group, the normalization parameters μ from ocular measures or the EEG. and σ were regressed linearly on mean and standard deviation of RR-interval PSD (0.02-0.08 Hz) measured during the first 16 Estimating Performance Using ECG-Derived Measures hours of wakefulness. The resulting curves were then used to In humans, sleepiness is regulated by the interaction of hoestimate μ and σ in each test subject, based on his RR-interval meostatic and circadian processes.28 Hence, physiologic sigPSD measured during baseline. Transformed data were then nals that are used to estimate sleepiness-related decrements in pooled across subjects to generate ROC curves (Figure 3B). performance should be sensitive to homeostatic and circadian At the optimal classification threshold, RR-interval PSD in the modulation. Similar to the profile of PVT lapses, we found 0.02- to 0.08-Hz range classified a greater than 25% increase in that RR-interval PSD (0.02-0.08 Hz) increased monotoniPVT lapses with 81% sensitivity and 85% specificity. By comcally during the usual hours of sleep, as subjects became inparing AUC of ROC curves, we found that RR-interval PSD creasingly sleep deprived. After about 24 hours of sustained and PERCLOS performed equally well at identifying a greater wakefulness, however, RR-interval PSD and PVT lapses than 25% increase in PVT lapses relative to baseline (χ2 = 1.07, decreased, as the circadian rhythm of alertness opposed the P = 0.30; Figure 3C). AUC was also similar for RR-interval build-up of homeostatic sleep pressure. These results indicate PSD vs PERCLOS at 50% and 75% PVT performance threshthat RR-interval PSD tracks changes in PVT performance inolds (χ2 = 1.07, P = 0.30; χ2 = 1.07, P = 0.30; Figure 3C). These duced by interaction of the homeostatic drive to sleep and the SLEEP, Vol. 35, No. 3, 2012
331
Heart Rate Variability Correlates with Vigilance—Chua et al
A
circadian sleep-wake cycle. Our findings also extend those by Chua et al., in which it was shown that some measures of HRV correlate with PVT performance during the daytime, in the absence of sleep deprivation.14 We found that RR-interval PSD in the 0.02- to 0.08-Hz range correlated more strongly with PVT lapses compared to PSD in the VLF and LF bands (≤ 0.04 Hz and 0.04 to 0.15 Hz, respectively).21 Our findings for heart rate, its overall variability, and PSD in the VLF, LF, and HF bands are consistent, however, with previous reports using similar methodology.29-31 For example, the time course for PSD in the HF band, which is thought to reflect vagal activity, showed strong circadian variation during the first 24 hours of sustained wakefulness.31-33 By examining HRV over a longer CR procedure than in previous studies, however, we show that HF power was much lower during the second day of sleep deprivation compared with HF power measured 24 hours earlier at the same relative clock times. Additionally, normalized LF power and the LF/HF power ratio remained elevated beyond 24 hours of continuous wakefulness, with little or no recovery toward the baseline rested state.34 These findings are consistent with previous reports that sleep deprivation increases sympathetic tone.34-36 Taken together, our results demonstrate that various measures of HRV are differentially sensitive to the effects of total sleep deprivation. By examining PSD of the RR-interval time series across different frequency bands, we found that power in the 0.02- to 0.08-Hz range tracked PVT performance closely during sleep deprivation, suggesting that this measure of HRV could potentially be used to predict sleepiness-related decrements in psychomotor vigilance.
1.0
Sensitivity
0.8 0.6 0.4
PERCLOS RR-interval PSD Sleepiness (VAS) EEG PSD
0.2 0.0 0.0
0.2
0.4
0.6
0.8
1.0
1 - Specificity
B
1.0
Sensitivity
0.8 0.6 0.4 PERCLOS RR-interval PSD
0.2 0.0 0.0
0.2
0.4
0.6
0.8
1.0
1 - Specificity
C
1.0
Technical Considerations The primary behavioral outcome in our study was PVT lapses, which is a measure of sustained visual attention. The PVT has been used extensively to assess the effects of sleep deprivation,22 sleep restriction,6 and sleep-disordered breathing37 on vigilance levels. We did not, however, test whether sleepinessrelated decrements in other cognitive functions can be estimated by RR-interval PSD, PERCLOS, or EEG PSD. Similar to other studies, we observed large interindividual differences in PVT performance during sleep deprivation.38 Based on cumulative distribution plots for PVT lapses per session (Figure S5), 5 lapses represented roughly the 10th percentile of performance in some participants, corresponding to low levels of sleepiness during the first 16 hours of wakefulness. In other subjects, the same number of lapses corresponded to the 80th percentile of performance, when subjects were sleep deprived and fighting the urge to fall asleep. To account for these interindividual differences, we used a relative threshold for defining performance that was based on each person’s range of PVT lapses during sustained wakefulness. A drawback of this approach is that our model does not predict absolute performance levels. Rather, our method addresses the question: How much worse is this person’s performance right now, relative to his normal ‘rested’ performance level? As such, our approach requires individualized calibration with a baseline measure of RR-interval PSD when the subject is not deprived of sleep. This could prove difficult in a real-world setting, as many individuals are chronically sleep deprived. Additionally, for our
AUC
0.9 0.8 0.7 0.6
25
50
75
Percentage increase in PVT lapses Figure 3—RR-interval power spectral density (PSD) can be used to identify an increase in Psychomotor Vigilance Task (PVT) lapses above threshold. (A) Receiver operating characteristic (ROC) curves show the relative performance of different physiologic and subjective measures at identifying a > 25% increase in PVT lapses, measured relative to each individual’s range of PVT performance. (B) Using leave-1-out crossvalidation to normalize data for classification, ROC curves are shown for RR-interval PSD (0.02-0.08 Hz) versus percentage of eyelid closure over the pupil over time (PERCLOS) for classifying subject performance at the 25% PVT lapse threshold. (C) Based on area under the curve (AUC) for ROC curves at different PVT lapse thresholds, RR-interval PSD (red bars) and PERCLOS (black bars) were similar in their ability to predict a relative increase in PVT lapses. Error bars show the standard error of AUC values. SLEEP, Vol. 35, No. 3, 2012
332
Heart Rate Variability Correlates with Vigilance—Chua et al
approach to work, the user’s RR-interval PSD would need to be z-transformed using normalization parameters derived from population data; such data would need to be collected prospectively in field studies. For our laboratory findings to translate to a real-world setting, it will be important to demonstrate that RR-interval PSD can be used to predict lapses when other factors that can modulate HRV are present. For example, changes in HRV occur in cardiovascular disease21 and in response to some medications21 and may vary by sex and age.39,40 Also, it is possible that changes in posture or activity may affect RR-interval PSD in the 0.02- to 0.08-Hz frequency range. Given that we studied only young healthy men in a highly controlled laboratory environment, more studies are required to determine the influence of sex, age, health status, and activity on the relationship between HRV and sleepiness. To reduce variability in HRV in a field setting, it may be necessary to collect a person’s HRV data under a standardized set of conditions or during a task in which changes in posture and activity are minimized.
appropriately time breaks, naps, or pharmacologic interventions to reduce sleepiness levels. In conclusion, our findings demonstrate that HRV can be used to estimate decrements in PVT performance resulting from total sleep deprivation. In a laboratory setting, RR-interval PSD in the 0.02- to 0.08-Hz frequency range performed nearly as well as PERCLOS at identifying a relative increase in PVT lapses caused by sleepiness. In future studies, it will be important to test whether our findings can be translated to a real-world environment. Given that ECG acquisition is minimally intrusive and potentially does not require contact with the body, our results suggest that HRV measures could be incorporated into fatigue-monitoring systems in diverse operational settings. ABBREVIATIONS ECG, electrocardiogram EEG, electroencephalogram EOG, electrooculogram HF, high frequency HRV, heart rate variability KSS, Karolinska Sleepiness Scale LF, low frequency PSD, power spectral density PERCLOS, percentage of eyelid closure over the pupil over time PVT, psychomotor vigilance task RT, reaction time ROC, receiver operating characteristic VAS, visual analogue scale VLF, very low frequency
Potential Applications of HRV in Fatigue Monitoring and Detection Our laboratory results suggest that HRV deserves further evaluation as a potential indicator of sleepiness. A significant advantage of HRV over most other bio-signals is that portable and nonintrusive technologies already exist for long-term physiologic monitoring of the ECG. Telemetric cardiac monitoring has been used clinically for 50 years, and methods for collecting RR-interval data have matured substantially, with the first generation of noncontact heart rate monitors now available.13 Current approaches for assessing a person’s level of sleepiness include ocular, EEG, and video-based monitoring. Consistent with a previous study that compared different fatigue-monitoring technologies,8 we found that PERCLOS outperformed EEG and eye-blink measures at estimating PVT performance. By comparison, RR-interval PSD and PERCLOS classified PVT performance with similar sensitivity and specificity. Given that PERCLOS associates reliably with lapses in attention and driving performance,8 in future studies it will be important to test whether RR-interval PSD can also be used to predict drowsiness-related lapses in simulated driving performance. Also, because we examined HRV only during total sleep deprivation, in future studies, it will be important to test whether RR-interval PSD can be used to estimate sleepinessrelated decrements in performance during chronic sleep restriction or acute partial sleep loss. In the present study, we did not examine whether HRV measures can be used to assess sleepiness on a moment-tomoment basis. It is possible that a person could temporarily increase his alertness level or RR-interval PSD in the 0.02- to 0.08-Hz frequency range by performing a stimulating activity (e.g., by singing aloud to music, exercising, or pinching himself). Such strategies are sometimes employed by drowsy drivers in an attempt to override the urge to fall asleep at the wheel. Although ocular measures, EEG, or video-based monitoring systems may outperform HRV metrics in detecting when an operator has fallen sleep, our results nonetheless suggest that HRV measures could potentially be used to track an individual’s overall sleepiness level during tasks that require sustained visual attention. Such information could be used to SLEEP, Vol. 35, No. 3, 2012
ACKNOWLEDGMENTS The authors thank Jonathan Bostick, Victor Pachas, Isabelle Jang, Hui-Ning Lim, Luuan-Chin Tan, and Eric Fang for their assistance in carrying out these studies, and the staff at the SingHealth Investigational Medicine Unit for medical supervision. Work for this study was performed at Duke-NUS Graduate Medical School Singapore. This work was supported by the Duke-NUS Signature Research Program funded by the Agency for Science, Technology and Research, Singapore, and the Ministry of Health, Singapore; National Medical Research Council, Singapore under NIG09may007 (to Dr. Gooley); SingHealth Foundation, Singapore, under SHF/FG410P/2009 (to Dr. Puvanendran). DISCLOSURE STATEMENT This was not an industry supported study. The authors have indicated no financial conflicts of interest. REFERENCES
1. Lyznicki JM, Doege TC, Davis RM, Williams MA. Sleepiness, driving, and motor vehicle crashes. Council on Scientific Affairs, American Medical Association. JAMA 1998;279:1908-13. 2. Leger D. The cost of sleep-related accidents: a report for the National Commission on Sleep Disorders Research. Sleep 1994;17:84-93. 3. Lim J, Dinges DF. Sleep deprivation and vigilant attention. Ann N Y Acad Sci 2008;1129:305-22. 4. Williamson A, Lombardi DA, Folkard S, Stutts J, Courtney TK, Connor JL. The link between fatigue and safety. Accid Anal Prev 2011;43:498-515. 5. Dawson D, Reid K. Fatigue, alcohol and performance impairment. Nature 1997;388:235.
333
Heart Rate Variability Correlates with Vigilance—Chua et al
24. Steiger JH. Tests for comparing elements of a correlation matrix. Psychol Bull 1980;87:245-51. 25. Lasko TA, Bhagwat JG, Zou KH, Ohno-Machado L. The use of receiver operating characteristic curves in biomedical informatics. J Biomed Inform 2005;38:404-15. 26. Zweig MH, Campbell G. Receiver-operating characteristic (ROC) plots: a fundamental evaluation tool in clinical medicine. Clin Chem 1993;39:561-77. 27. DeLong ER, DeLong DM, Clarke-Pearson DL. Comparing the areas under two or more correlated receiver operating characteristic curves: a nonparametric approach. Biometrics 1988;44:837-45. 28. Czeisler CA, Gooley JJ. Sleep and circadian rhythms in humans. Cold Spring Harb Symp Quant Biol 2007;72:579-97. 29. Krauchi K, Wirz-Justice A. Circadian rhythm of heat production, heart rate, and skin and core temperature under unmasking conditions in men. Am J Physiol 1994;267:R819-R829. 30. Viola AU, James LM, Archer SN, Dijk DJ. PER3 polymorphism and cardiac autonomic control: effects of sleep debt and circadian phase. Am J Physiol Heart Circ Physiol 2008;295:H2156-H2163. 31. Vandewalle G, Middleton B, Rajaratnam SM, et al. Robust circadian rhythm in heart rate and its variability: influence of exogenous melatonin and photoperiod. J Sleep Res 2007;16:148-55. 32. Burgess HJ, Trinder J, Kim Y, Luke D. Sleep and circadian influences on cardiac autonomic nervous system activity. Am J Physiol 1997;273:H1761-H1768. 33. van Eekelen AP, Houtveen JH, Kerkhof GA. Circadian variation in base rate measures of cardiac autonomic activity. Eur J Appl Physiol 2004;93:39-46. 34. Zhong X, Hilton HJ, Gates GJ, et al. Increased sympathetic and decreased parasympathetic cardiovascular modulation in normal humans with acute sleep deprivation. J Appl Physiol 2005;98:2024-32. 35. Ruger M, Scheer FA. Effects of circadian disruption on the cardiometabolic system. Rev Endocr Metab Disord 2009;10:245-60. 36. Mullington JM, Haack M, Toth M, Serrador JM, Meier-Ewert HK. Cardiovascular, inflammatory, and metabolic consequences of sleep deprivation. Prog Cardiovasc Dis 2009;51:294-302. 37. Powell NB, Riley RW, Schechtman KB, Blumen MB, Dinges DF, Guilleminault C. A comparative model: reaction time performance in sleepdisordered breathing versus alcohol-impaired controls. Laryngoscope 1999;109:1648-54. 38. Van Dongen HP, Baynard MD, Maislin G, Dinges DF. Systematic interindividual differences in neurobehavioral impairment from sleep loss: evidence of trait-like differential vulnerability. Sleep 2004;27:423-33. 39. Stein PK, Kleiger RE, Rottman JN. Differing effects of age on heart rate variability in men and women. Am J Cardiol 1997;80:302-5. 40. Sinnreich R, Kark JD, Friedlander Y, Sapoznikov D, Luria MH. Five minute recordings of heart rate variability for population studies: repeatability and age-sex characteristics. Heart 1998;80:156-62.
6. Van Dongen HP, Maislin G, Mullington JM, Dinges DF. The cumulative cost of additional wakefulness: dose-response effects on neurobehavioral functions and sleep physiology from chronic sleep restriction and total sleep deprivation. Sleep 2003;26:117-26. 7. Balkin TJ, Horrey WJ, Graeber RC, Czeisler CA, Dinges DF. The challenges and opportunities of technological approaches to fatigue management. Accid Anal Prev 2011;43:565-72. 8. Dinges DF, Mallis M., Maislin G., Powell JW. Final report: Evaluation of techniques for ocular measurement as an index of fatigue and the basis for alertness management. Washington, DC: National Highway Traffic Safety Administration; 1998. Report No.: DOT HS 808 762. 9. Wierwille WW, Lewin MG, Fairbanks RJ, III. Final report: Research on vehicle-based driver status/performance monitoring, Part III. Washington, DC: National Highway Traffic Safety Administration; 1996. Report No.: DOT HS 808 640. 10. Hartley L, Horberry T, Mabbott N, Krueger GP. Review of fatigue detection and prediction technologies. Melbourne, Australia: National Road Transport Commission; 2000. 11. Lal SK, Craig A. Driver fatigue: electroencephalography and psychological assessment. Psychophysiology 2002;39:313-21. 12. Lal SK, Craig A, Boord P, Kirkup L, Nguyen H. Development of an algorithm for an EEG-based driver fatigue countermeasure. J Safety Res 2003;34:321-8. 13. Droitcour AD, Boric-Lubecke O, Lubecke VM, Lin J, Kovacs GTA. Range correlation and I/Q performance benefits in single-chip silicon doppler radars for noncontact cardiopulmonary monitoring. IEEE T Microw Theory 2004;52:838-48. 14. Chua CP, McDarby G, Heneghan C. Combined electrocardiogram and photoplethysmogram measurements as an indicator of objective sleepiness. Physiol Meas 2008;29:857-68. 15. Duffy JF, Dijk DJ. Getting through to circadian oscillators: why use constant routines? J Biol Rhythms 2002;17:4-13. 16. Akerstedt T, Gillberg M. Subjective and objective sleepiness in the active individual. Int J Neurosci 1990;52:29-37. 17. Babkoff H, Caspy T, Mikulincer M. Subjective sleepiness ratings: the effects of sleep deprivation, circadian rhythmicity and cognitive performance. Sleep 1991;14:534-9. 18. Dinges DF, Powell JW. Microcomputer analyses of performance on a portable simple visual RT task during sustained operations. Behav Res Meth Instr Comp 1985;17:652-5. 19. Benitez D, Gaydecki PA, Zaidi A, Fitzpatrick AP. The use of the Hilbert transform in ECG signal analysis. Comput Biol Med 2001;31:399-406. 20. Moody G.B. Spectral analysis of heart rate without resampling. Comput Cardiol 1993;20:715-8. 21. Heart rate variability: standards of measurement, physiological interpretation and clinical use. Task Force of the European Society of Cardiology and the North American Society of Pacing and Electrophysiology. Circulation 1996;93:1043-65. 22. Cajochen C, Khalsa SB, Wyatt JK, Czeisler CA, Dijk DJ. EEG and ocular correlates of circadian melatonin phase and human performance decrements during sleep loss. Am J Physiol 1999;277:R640-R649. 23. Hammoud RI, Zhang H. Alertometer: Detecting and mitigating driver drowsiness and fatigue using an integrated human factors and computer vision approach. In: Hammoud RI, ed. Passive Eye Monitoring: Algorithms, Applications and Experiments, 1st ed. Berlin, Germany: Springer; 2008:301-22.
SLEEP, Vol. 35, No. 3, 2012
334
Heart Rate Variability Correlates with Vigilance—Chua et al
Mean log RT (ms)
A
2.9
PVT RT
2.8 2.7 2.6 2.5 2.4
0
8
16
24
32
40
Time since wake (h)
B
37.4
°C
37.0
36.6
CBT 36.2
0
8
16
24
32
40
Time since wake (h)
C
9
Sleepy →
7 5 3
KSS 1
0
8
16
24
32
40
Time since wake (h) Figure S1—Time course of performance and subjective sleepiness during 40 h of sustained wakefulness. (A) Mean log reaction time (RT) on the Psychomotor Vigilance Task (PVT) increased during the usual hours of sleep. RTs were slowest at about 24 h after wake and then improved over the next several hours. (B) This improvement in performance coincided with the rising phase of core body temperature (CBT) rhythm. (C) Subjective ratings of sleepiness on the Karolinska Sleepiness Scale (KSS) showed a time course that was similar to the profile for PVT performance. Vertical reference lines indicate habitual bedtime and wake time. Error bars show SEM.
SLEEP, Vol. 35, No. 3, 2012
334A
Heart Rate Variability Correlates with Vigilance—Chua et al
Time since wake (h) 8
16
24
32
140
HR
66 62
8
16
24
32
40
SDNN
100
58
80
54
60 80
VLF Percentage
3.8 3.6 3.4
LF (n)
75 70 65 60
3.2 3.8
40
LF
Percentage
Log ms2
0
120
4.0
Log ms2
40
ms
Beats per minute
0
Time since wake (h)
3.6 3.4
HF (n)
35 30 25
3.2
20
3.2
LF / HF
4
Ratio
Log ms2
5
HF
3.0
3 2
2.8
0
8
16
24
32
40
0
Time since wake (h)
8
16
24
32
40
Time since wake (h)
Figure S2—Time course of heart rate variability measures during 40 h of sustained wakefulness. Heart rate variability was measured during a 10-min PVT given every two hours. From top to bottom: HR, heart rate; SDNN, standard deviation of RR intervals; VLF, spectral power in the very low frequency band of the RR-interval time series (≤ 0.04 Hz); LF(n), normalized power in the low frequency band (0.04-0.15 Hz); LF, spectral power in the low frequency band; HF(n), normalized power in the high frequency band (0.15-0.40 Hz); HF, spectral power in the high frequency band; LF/HF; ratio of LF to HF power. Vertical reference lines indicate habitual bedtime and wake time. Error bars show SEM.
SLEEP, Vol. 35, No. 3, 2012
334B
Heart Rate Variability Correlates with Vigilance—Chua et al
Correlation with lapses (r )
A
0.8
Cz
0.6 0.4 0.2 0.0 -0.2 -0.4
Correlation with lapses (r )
B
0.8
Pz
0.6 0.4 0.2 0.0 -0.2 -0.4
Correlation with lapses (r )
C
0.8
Oz
0.6 0.4 0.2 0.0 -0.2 -0.4
0
2
4
6
8
10
12
14
16
Frequency (Hz) Figure S3—Correlation of electroencephalographic (EEG) spectral power with PVT lapses during 40 h of sustained wakefulness. EEG power was determined in 0.5 Hz bins during each Psychomotor Vigilance Task (PVT) session. Pearson correlation coefficients (r ) are shown for power measured in each frequency bin vs PVT lapses. The r values were averaged across subjects, and error bars show SEM. Correlations are shown for EEG power spectral density (PSD) versus PVT lapses in (A) central, (B) parietal, and (C) occipital derivations.
SLEEP, Vol. 35, No. 3, 2012
334C
Heart Rate Variability Correlates with Vigilance—Chua et al
Derivation Fz
Delta (1.0-4.5 Hz)
1.5
Cz
Pz
Oz
0.5 -0.5 -1.5
Theta (4.5-8.5 Hz)
0.5 -0.5 -1.5 1.5
Alpha (8.5-12.5 Hz)
EEG PSD (z-scores)
1.5
0.5 -0.5 -1.5
Beta (12.5-15.5 Hz)
1.5 0.5 -0.5 -1.5 0
8
16
24
32
40
0
8
16
24
32
40
0
8
16
24
32
40
0
8
16
24
32
40
Time since wake (h) Figure S4—Time course of electroencephalographic (EEG) power spectral density (PSD) during 40 h of sustained wakefulness. From left to right: EEG PSD measured in frontal (Fz), central (Cz), parietal (Pz) and occipital (Oz) derivations along the z-line. From top to bottom: delta (1.0-4.5 Hz), theta (4.5-8.5 Hz), alpha (8.5-12.5 Hz), and beta (12.5-15.5 Hz) frequency bands. Vertical reference lines indicate habitual bedtime and wake time. Error bars show SEM.
SLEEP, Vol. 35, No. 3, 2012
334D
Heart Rate Variability Correlates with Vigilance—Chua et al
Number of lapses
A
40 30 20 10 0 0
8
16
24
32
40
Time since wake (h)
B
1.0
Percentile
0.8 0.6 0.4 0.2 0.0
0
10
20
30
40
Number of lapses Figure S5—Interindividual differences in Psychomotor Vigilance Task (PVT) performance. (A) The time course of PVT lapses is shown in all subjects (n = 24), demonstrating large intersubject variability in performance. (B) Cumulative distribution plots are shown for PVT lapses (18 sessions) measured during 40 h of sustained wakefulness. Each trace shows PVT performance in a different subject.
SLEEP, Vol. 35, No. 3, 2012
334E
Heart Rate Variability Correlates with Vigilance—Chua et al
Table S1—Relative performance of different physiologic measures at identifying an increase in PVT lapses above threshold (Sub-group analysis for subjects with PERCLOS measurements and no missing data for other physiological measurements; n = 14). Measure 25% PVT lapse threshold PERCLOS RR-interval PSD Sleepiness (VAS) Delta power (Fz)
AUC ± SE
Sensitivity (%) (95% CI)
Specificity (%) (95% CI)
χ2
P value
0.89 ± 0.02 0.86 ± 0.02 0.84 ± 0.03 0.79 ± 0.03
79.2 (70.0 – 86.6) 81.2 (72.2 – 88.3) 75.3 (65.7 – 83.3) 65.2 (55.2 – 74.5)
87.4 (81.5 – 92.3) 82.8 (75.8 – 88.4) 83.4 (76.5 – 89.0) 86.6 (80.3 – 91.7)
1.70 3.00 6.59
0.19 0.08 0.01
50% PVT lapse threshold PERCLOS RR-interval PSD Sleepiness (VAS) Delta power (Fz)
0.89 ± 0.02 0.82 ± 0.03 0.79 ± 0.03 0.79 ± 0.03
79.0 (66.8 – 88.3) 72.6 (59.8 – 83.2) 59.7 (46.5 – 72.0) 81.4 (68.6 – 89.6)
86.3 (80.6 – 90.9) 84.7 (78.8 – 89.5) 84.7 (78.8 – 89.5) 82.3 (75.9 – 87.3)
6.18 8.20 6.03
0.01 0.004 0.01
75% PVT lapse threshold PERCLOS RR-interval PSD Sleepiness (VAS) Delta power (Fz)
0.90 ± 0.02 0.86 ± 0.03 0.77 ± 0.04 0.72 ± 0.05
80.7 (62.5 – 92.6) 87.1 (70.2 – 96.4) 61.3 (42.2 – 78.2) 60.0 (42.2 – 78.2)
86.4 (81.2 – 90.7) 79.2 (73.2 – 84.3) 80.1 (74.2 – 85.2) 85.8 (80.1 – 90.3)
2.79 11.94 11.68
0.10 < 0.0001 < 0.0001
Physiologic measures are ranked by area under the curve (AUC) of receiver operating characteristic (ROC) curves in descending order of magnitude at different PVT lapse thresholds. Sensitivity and specificity values were determined at the optimal classification threshold, with 95% confidence intervals shown in parentheses. At each PVT lapse threshold tested, the AUC of ROC curves for RR-interval PSD (0.02-0.08 Hz), self-reported sleepiness (visualanalog scale [VAS]), and electroencephalographic (EEG) delta power were compared to the AUC for percentage of eyelid closure over the pupil over time (PERCLOS). For each pairwise comparison, the χ2 statistic is shown in the far right column.
SLEEP, Vol. 35, No. 3, 2012
334F
Heart Rate Variability Correlates with Vigilance—Chua et al