Department of Chemistry and The James Franck Institute, The University of Chicago, Chicago, ... One potential, due to Marcus and Rice, is designed to describe.
PHYSICAL REVIEW E
VOLUME 61, NUMBER 1
JANUARY 2000
Hexagonal to square lattice conversion in bilayer systems Ronen Zangi and Stuart A. Rice Department of Chemistry and The James Franck Institute, The University of Chicago, Chicago, Illinois 60637 共Received 6 July 1999兲 We report the results of extensive molecular dynamics simulations of the reconstructive hexagonal to square lattice conversion in bilayer colloid systems. Two types of interparticle potential were used to represent the colloid-colloid interactions in the suspension. One potential, due to Marcus and Rice, is designed to describe the interaction of sterically stabilized colloid particles. This potential has a term that represents the attraction between colloid particles when there is incipient overlap between the stabilizing brushes on their surfaces, a 共soft repulsion兲 term that represents the entropy cost associated with interpenetration of the stabilizing brushes, and a term that represents core-core repulsion. The other potential we used is an almost hard core repulsion with continuous derivatives. Our results clearly show that the character of the reconstructive hexagonal to square lattice conversion in bilayer colloid systems is potential dependent. For a system with colloid-colloid interactions of the Marcus-Rice type, the packing of particles in the square array exhibits a large interlayer lattice spacing, with the particles located at the minima of the attractive well. In this case the hexagonal to square lattice transition is first order. For a system with hard core colloid-colloid interactions there are two degenerate stable intermediate phases, linear and zigzag rhombic, that are separated from the square lattice by strong first order transitions, and from the hexagonal lattice by either weak first or second order transitions. PACS number共s兲: 82.70.Dd, 61.20.Ja, 83.70.Hq, 82.70.Kj I. INTRODUCTION
Densely packed colloidal suspensions confined between parallel plates only a few particle diameters apart exhibit a number of interesting phase transitions as the plate separation and/or the density is varied. This paper is concerned with the character of the hexagonal to square lattice transition that occurs in bilayers confined between plates. This transition must be reconstructive as there is no groupsubgroup relation between the two phases. There are two types of reconstructive phase transitions; one includes transitions realized by diffusion processes, and the other those realized by cooperative displacements of atoms. Group-subgroup related structural phase transitions, as a rule, satisfy the Landau criterion that the restructuring process is described by the modes of one of the irreducible representations of the parent-phase symmetry group. The crystal lattice change that occurs in a reconstructive phase transition cannot be described by the modes of a single irreducible representation. A feature peculiar to reconstructive transitions is that, along with displacement modes, lattice deformation plays an important role in the transformation of the crystal structure. An example of this type of transition is the bcc→fcc transformation that is realized by shear defor¯ 0 兴 direction. Such tranmation of 共110兲 planes along the 关 11 sitions, called Martensitic transitions, typically have anomalous properties 关1兴. Consider, now, the possible particle packings in one and two layer systems. In a one layer, two-dimensional system, packing of the particles in a square lattice is unstable relative to packing of the particles in a hexagonal lattice. In simple terms, in a one layer system in which the particles interact via central forces, the lowest energy configuration has the maximum number of nearest neighbors. On the other hand, in a two layer system a two layer square lattice is stable. It is worth noting that a stable one layer square lattice is possible if the particle-particle interaction has appropriately sized two 1063-651X/2000/61共1兲/671共11兲/$15.00
PRE 61
and three body contributions 关2兴. This form of packing has been observed in a system of membrane-spanning bacterial toxin proteins 关3兴. Two types of cooperative particle displacements, with different symmetries, can transform a plane hexagonal lattice to a plane square lattice. If stable phases can be found along those displacement modes, the two types of rearrangements generate two phases with different symmetries. Indeed, intermediate phases between the hexagonal and the square phases are known, namely, the so-called linear and zigzag rhombic phases 关4,5兴. In each of these intermediate phases the number of in-plane nearest neighbors is four. In the linear phase the nearest neighbors are arranged with rectangular symmetry, and in the zigzag rhombic phase they have a kite shaped configuration. Let 䉭 denote a layer with hexagonal lattice symmetry, and 䊐 a layer with square lattice symmetry. The investigations reported in this paper concern the character of the 2䉭→2䊐 transition when the separation between the confining walls is 1.80 particle diameters. This transition is one in the sequence 1䉭→2䊐→2䉭→3䊐→3䉭→¯
共1.1兲
that occurs in a confined system as the distance between the two confining walls increases 关6兴. Alternatively, the n䉭 →n䊐 transition can be induced by decreasing the density of the system for a constant value of the gap between the two confining walls. A microscopic basis for the sequence of observed transitions, based on free volume theory, has been proposed 关7兴. The result of these calculations for the case of a two layer hard sphere system is that the hexagonal to square lattice transition is first order, and direct 共i.e., without intermediate phases兲. However, the analysis did not allow for the existence of intermediate phases, different from n䉭 and n䊐, 671
©2000 The American Physical Society
672
RONEN ZANGI AND STUART A. RICE
that have particle packings that increase the free volume of the system. When, in the vicinity of a phase transition, the correlation length of the density-density correlation function is large relative to the range of intermolecular interactions, it is believed that the specific form of the intermolecular interactions, and consequently the system Hamiltonian, plays a minor role in determining the character of that phase transition. This notion underlies the introduction of universality classes and the prediction that the character of transitions that belong to the same university class is the same. The results of our studies clearly show that the 2䉭→2䊐 transition depends on the interparticle potential. For a system with colloid-colloid interactions of the Marcus-Rice type, the two layer packing of particles in the square array exhibits a large interlayer lattice spacing, with the particles located at the minima of the attractive well. In this case the hexagonal to square lattice transition is first order. On the other hand, for a two layer system with hard core colloid-colloid interactions there are two degenerate stable intermediate states, linear and zigzag rhombic phases, that are separated from the square lattice by strong first order transitions, and from the hexagonal lattice by either weak first order or by second order transitions. II. MODEL SYSTEM AND COMPUTATIONAL. DETAILS
The model system that we have used to study the 2䉭→2䊐 phase transition consists of 4032 particles contained in a rectangular box with side lengths in the ratio x:y⫽7:(8)/2). The wall separation was fixed at 1.80 particle diameters. Since our simulations are concerned with the transition between solids with different symmetries, we checked the effect of the shape of the box on the symmetry of the equilibrated crystal. For sample densities that support crystals with hexagonal and square symmetries we carried out simulations with the above mentioned rectangular box for the case that the initial configuration is a perfect hexagonal lattice, and with a square box 共containing 4050 particles兲 with a perfect square lattice as the initial configuration. We found that the only difference between the equilibrated structures in the different simulation boxes is that a small number of defects 共less than 2%兲 is present in those cases for which the crystal symmetry does not match the shape of the simulation box. The presence of those defects had an insignificant effect on the calculated properties of the system. Armed with this result, and noting that the number of defects when the hexagonal lattice was present in the square simulation box was larger than the number of defects when the square lattice was present in the rectangular box, we have found it convenient to carry out our simulations in a rectangular box. Our calculations were carried out, and the results are reported below, in terms of the reduced variables r * ⫽r/ , z * ⫽z/ , T * ⫽k B T/, * ⫽ 2 , and m⫽1, with the diameter of the particle, the depth of the attractive potential well, the number density, and m the mass of the particle. Although the particles can move from one layer to another, on average the number of particles of each layer is the same, so we choose to characterize the state of the system with a one layer-two-dimensional 共2D兲 number density 2D ⫽N/(2A), where A is the area of the simulation cell in the
PRE 61
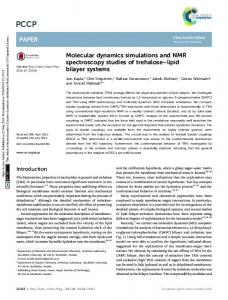
FIG. 1. Marcus-Rice-type interparticle potential 共solid line兲 and a nearly hard sphere interparticle potential 共dashed line兲.
xy plane, and N is the total number of particles in the simulation. Periodic boundary conditions were imposed on the simulation cell in the x and y directions, but not in the z direction. The same number of particles was present in the simulation cell for all of the densities studied. To study the properties of the system with different particle densities we changed the area of the simulation cell in the xy plane. Our calculations were carried out for particles subject to two different interactions. The first of these is the same pair interaction as the used in our previous work, namely,
冋冉 冋冉
u 共 r * 兲 ⫽⫺ exp ⫺
r * ⫺wc * ww *
⫹1.2 exp ⫺
冊册 冊册
冉
4
⫹2⫻10⫺19 r * ⫺
r * ⫺0.96 0.074
1 2
冊
⫺64
8
共2.1兲
.
This pair potential 共see Fig. 1兲 was designed by Marcus and Rice to have the features of colloidal particles that are sterically stabilized by grafted polymer brushes to prevent aggregation induced by van der Waals forces. The first term in Eq. 共2.1兲 represents the attraction between colloid particles when there is incipient overlap between the stabilizing brushes on their surfaces; for simplicity we have taken the functional form of this attraction to be an inverse even power exponent with depth ⫽1.0k B T and width ww/ ⫽ww * ⫽0.006, centered at wc * ⫽1.05. The second term in Eq. 共2.1兲 is the corecore repulsion, which is the dominant contribution to u(r * ) when r * ⭐1; the functional form chosen is very nearly a hard core repulsion but has continuous derivatives. The last term in Eq. 共2.1兲 is an interpolating soft repulsion, representing the entropy cost associated with interpenetration of the stabilizing brushes attached to the surfaces of the colloid particles; it plays the role of a spline function between the aforementioned attractive and repulsive terms. The other colloid-colloid interaction that we used is an almost hard core repulsion with continuous derivatives,
冉
u 共 r * 兲 ⫽1⫻10⫺38 r * ⫺
1 2
冊
⫺128
.
共2.2兲
The potentials represented in Eqs. 共2.1兲 and 共2.2兲 are displayed in Fig. 1.
PRE 61
HEXAGONAL TO SQUARE LATTICE CONVERSION IN . . .
The particles in the model system were also subjected to a one body external potential in the z direction. Consequently, all of the thermodynamic properties of the model system are functions of the strength of this external potential. However, the shape of the potential, u ext共 z * 兲 ⫽D 共 z * 兲 ,
共2.3兲
is such as to confine the system to form a slab with well specified thickness H, so we can represent its thermodynamic properties with the variables N, T, A, and H in place of N, T, V, and the strength of the external potential. In Eq. 共2.3兲, z * is the distance from the center of the cell to the center of mass of the particle and ⫽128, D⫽1⫻1051; this potential confines the particles as if they were in a cell with an effective wall separation of 1.80 . Since the linear momentum in the z direction is not conserved in our model system 共because there is no periodic boundary condition in this degree of freedom兲, the temperature is related to the kinetic energy K and the total number of degrees of freedom, 3N⫺2, by T⫽
2K . 3N⫺2
共2.4兲
The required temperature was created by multiplication of the velocities by an appropriate constant. The results of the simulations that we present in this paper correspond to T * ⫽1.00. For densities inside the coexistence region of the system with Marcus-Rice-type interactions, where the hexagonal packing changes to square packing, we had to increase the temperature of the system to T * ⫽3.00 and then to reduce it gradually back to T * ⫽1.00 in order to observe ordered coexisting phases. The same equilibration process was used, for the corresponding density region, for the system with hard core interactions. The lateral pressure, p l , was calculated from the lateral virial Wl , N
1 Wl ⫽⫺ 2 i⫽1
冏
N
x 2i j ⫹y 2i j u 共 r 兲 rij r
兺兺 j⬎i
.
共2.5兲
r⫽r i j
673
ticles around their lattice sites. The assignments of the particles to one or the other of the phases do not change throughout this time interval. Part of our analysis of the results of the simulations depends on the construction of a two-dimensional Voronoi polygon mapping of the particle configurations. The interlayer nearest neighbors were identified using a cutoff distance of 1.2 between particles in different layers. Having determined the n Voronoi vertices around each particle, the area of each Voronoi polygon was calculated by triangulation from 1 A⫽ 2
n⫺1
兺
i⫽0
共 x i y i⫹1 ⫺y i x i⫹1 兲 ,
共2.8兲
where (x i ,y i ) are the coordinates of the Voronoi vertex i, labeled counterclockwise with a cyclic permutation, i.e., the index n is equal to 0. The molecular dynamics 共MD兲 simulations were carried out using the velocity Verlet algorithm and the Verlet neighbor list method for the calculation of the potential energy. The distance at which the potential was cut off was 1.5, and the neighbor list cutoff was 2.4 times the projected in-plane average spacing of the particles. The need for updating of the neighbor list was checked at every time step. The average time step used was, in reduced units, 5⫻10⫺4 ; the associated rms fluctuation in total energy did not exceed one part in 105 . The initial configuration for the simulation of the system with the highest one layer areal density ( * ⫽1.100) was taken to be a perfect triangular lattice with half of the particles located in the plane z⫽0.4, and the other half in the plane z⫽⫺0.4. The lattice points of the layers were arranged out-of-registry with respect to one another. The equilibrium configuration corresponding to this density was used as the intial configuration for calculations with lower densities. The highest density configuration was equilibrated for 1 ⫻107 MD steps, and the configurations at each of the other densities were equilibrated for 5⫻106 MD steps. Trajectory data were collected for 4⫻105 MD steps, every 400 time steps.
We find Nk B T⫹ 具 Wl 典 . p l⫽ V
III. RESULTS
共2.6兲
In order to investigate the mean square displacements of the particles as a function of time in each of the phases for a configuration with coexisting phases, we calculated N
1 ␣ 关 rជ 共 t 兲 ⫺rជ i 共 0 兲兴 2 . 具 r 共 t 兲典 ␣⫽ N ␣ i⫽1 i 2
兺
共2.7兲
The sum is over the N ␣ particles of phase ␣, where ␣⫽䉭, 䊐. We identified particles that belong to phases with hexagonal and square packings as those that at t⫽0 are intralayer six and four coordinated, respectively, knowing that the only phases present in the system had these packing symmetries. The mean square displacements were computed for a time period that permitted the maximum displacements of the par-
A. System with Marcus-Rice-type interactions
We have studied the phase transitions that occur in the * ⭐1.1000 in a two layer confined density range 0.3800⭐ 2D colloidal suspension in which the colloid-colloid interaction is of the Marcus-Rice form. The equilibrium state of the * ⭓0.9900 is a two layer hexagonal solid, and system for 2D * ⭐0.9200 is a two layer square solid. The stability for 2D domain of the two layer square solid ends with a melting transition. We analyze the change in symmetry accompanying the 2䉭→2䊐 transition using the distribution of the angle between the lines that connect the centers of three adjacent neighbors in the same layer 共which we call the lattice angle兲. The value of the lattice angle is 60° for the hexagonal phase, and 90° for the square phase, and it has two values, 1 and 2 , that are related by 2 ⫽180°⫺ 1 for the linear and the
674
RONEN ZANGI AND STUART A. RICE
PRE 61
* ⫽0.9500) FIG. 3. The lateral configuration of a density ( 2D close to the middle of the coexistence between 2䉭 and 2䊐 for the system with Marcus-Rice-type interactions. The upper layer is denoted by empty circles, and the lower layer is denoted by filled circles and is mostly hidden. FIG. 2. The distribution of the lattice angle for the system with * ⫽0.9900, 共b兲 2D * ⫽0.9700, Marcus-Rice-type interactions. 共a兲 2D * ⫽0.9500, 共d兲 2D * ⫽0.9400, 共e兲 2D * ⫽0.9300, and 共f兲 2D * 共c兲 2D ⫽0.9200.
zigzag rhombic phases. The distributions of 1 and 2 for the linear and the zigzag rhombic phases have equal amplitudes. Figure 2 shows the distribution of the lattice angle for the * ⭐0.9900 that span the conrange of densities 0.9200⭐ 2D version of the hexagonal phase to the square phase. This distribution suggests that the 䉭→2䊐 conversion is a direct first order transition. The in-plane configuration of the particles for a density in the middle of the coexistance region * ⫽0.9500) is shown in Fig. 3; the domains of the coex( 2D isting solids are clearly identifiable. There is a correlation between the structures of the upper and the lower layers of the system: specifically, the same region in the xy plane that exhibits one of the packing structures in one layer, exhibits the same packing structure in the other layer, but with staggered registry. We note that the domain wall between the two solid structures is composed of five-coordinated atoms. The first order nature of the transition is also evident in the isothermal dependence of the lateral pressure on density 共Fig. 4兲, in which there is a clearly developed van der Waals loop. Analysis of the intralayer and interlayer particle spacing distributions 共Fig. 5兲 for the configuration displayed in Fig. 3 show that the former distribution is unimodal 共except for a small shoulder at around r * ⫽1.02兲, and is centered around the minimum of the attractive well of the Marcus-Rice potential. On the other hand, the interlayer particle spacing distribution is bimodal; one of the peaks of the particle-particle distance distribution corresponds to the minimum of the attractive well, and the other is on the soft repulsion part of the Marcus-Rice potential. We can map those two interlayer
particle-particle distances on the xy plane by using a cutoff distance which is at the mininmum between the peaks of the distribution (r * ⫽1.028). The two groups of particle-particle separations found define coherent domains in the xy plane 共see Fig. 6兲. These data show that the short interlayer particle-particle separation is associated with the hexagonal lattice, and the long interlayer particle-particle separation is associated with the square lattice. The fact that packing in the square lattice exploits positioning of the particles in the attractive well of the potential plays a crucial role in determining the character of the 2䉭→2䊐 transition. As shown in Fig. 1, the attractive well of the Marcus-Rice potential is centered at 1.05, so only nearest neighbor interactions contribute to the energy of the system. Thus, when the bilayer has hexagonal packing there are nine 共six intra-
FIG. 4. The lateral pressure as a function of the one layer-two dimensional number density for the system with Marcus-Rice-type interactions.
PRE 61
HEXAGONAL TO SQUARE LATTICE CONVERSION IN . . .
675
FIG. 7. Energy 共potential plus kinetic兲 per particle distribution for the system with Marcus-Rice-type interactions for the densities: * ⫽0.9900 共empty triangle兲, 2D * ⫽0.9500 共filled circle兲, and 2D * 2D ⫽0.9200 共empty square兲.
FIG. 5. Intralayer 共upper figure兲 and interlayer 共lower figure兲 particle-particle distance distribution for the configuration shown in Fig. 3.
layer and three interlayer兲 nearest neighbor interactions per particle, and when the bilayer has square packing there are eight 共four intralayer and four interlayer兲 nearest neighbor interactions per particle. Nevertheless, the distribution of the energy per particle, displayed in Fig. 7 for three densities that correspond to pure hexagonal packing 共for a density just * ⫽0.9900), coabove the end of the coexistence region, 2D
FIG. 6. The projection of the short 共black line兲 and long 共gray line兲 particle-particle separation on the xy plane for the configuration shown in Fig. 3.
* ⫽0.9500) existence of hexagonal and square packing ( 2D and pure square packing 共for a density just below the end of * ⫽0.9200兲, reveal that the square the coexistence region, 2D packing configuration has a lower energy per particle than the hexagonal packing configuration. In Fig. 8 we show the results obtained from a twodimensional Voronoi polygon analysis of each of the layers in the bilayer system. Specifically, the figure displays the * ⫽0.9900, distributions of Voronoi polygon area when 2D 0.9500, and 0.9200. The Voronoi polygon area associated with a particle in the square lattice is seen to be larger than that associated with a particle in the hexagonal lattice. Note * ⫽0.9500 the peaks of the bimodal distribution that when 2D of Voronoi polygon area are slightly shifted relative to the values associated with the pure phases. We attribute this difference to hysteresis which often occurs at a first order phase transition; i.e., at the selected densities the square lattice and the hexagonal lattice are just inside the metastable region so
FIG. 8. The Voronoi polygon area distribution for the system * ⫽0.9900 with Marcus-Rice-type interactions for the densities: 2D * ⫽0.9500 共filled circle兲, and 2D * ⫽0.9200 共empty triangle兲, 2D 共empty square兲.
676
RONEN ZANGI AND STUART A. RICE
PRE 61
FIG. 9. The mean square displacement as a function of time 共in reduced units兲. The dashed lines are the in-plane 共xy兲 components of the displacement vector. For the hexagonal lattice, most of the displacement is in the plane.
the former is slightly compressed relative to its equilibrium configuration and the latter is slightly expanded relative to its equilibrium configuration. The Voronoi polygon analysis of a two-dimensional configuration of particles defines a tiling of the xy plane with the area of each polygon uniquely associated with the particle inside the polygon. Noting that there is more space for motion in the z direction for a particle in the square lattice than for a particle in the hexagonal lattice, we conclude that if the particles were hard spheres there would be more free volume per particle in the square lattice than in the hexagonal lattice, hence a larger entropy per particle in the square lattice than in the hexagonal lattice. This conclusion cannot be valid when the particle-particle interaction is of the Marcus-Rice form, since we have just shown that in the coexistence region under examination the energy per particle is lower in the square lattice than it is in the hexagonal lattice. The resolution of this apparent contradiction is, of course, to be found in the different amplitudes of particle motion in the two lattices. In Fig. 9 we show the mean square displacement of the particles of the configuration shown in Fig. 3. To better analyze the situation, we have shown separately the mean square displacement function and the xy component of the displacement in the square and in the hexagonal lattices. The results show that the maximum displacements of the particles from the lattice points in the square lattice are smaller than those of the particles from the lattice points in the hexagonal lattice. We also find that, for a particle in the square lattice, the out-of-plane component of the displacement is greater than that for a particle in the hexagonal lattice. Thus, for the square lattice, the positioning of the particles in the attractive well of the potential results in a restriction of the in-plane motion of particles coupled with a reduction in the energy per particle. Given the preceding interpretation of the symbiosis between the form of the particle-particle potential and the stabilization of the square lattice, what should we expect to be the character of the 2䉭→2䊐 transition in a system in which the particle-particle interaction lacks an attractive well? To answer this question we have carried out molecular dynam-
FIG. 10. The distribution of the lattice angle for the system with * ⫽1.0300, 共b兲 2D * ⫽1.0200, 共c兲 2D * hard core repulsions. 共a兲 2D * ⫽0.9800, 共e兲 2D * ⫽0.9600, and 共f兲 2D * ⫽0.9300. ⫽1.0000, 共d兲 2D
ics simulations of confined bilayer systems in which the particle-particle interaction is a hard core repulsion. B. System with hard sphere interactions
We have studied the 2䉭→2䊐 transition in the density * ⭐1.1000 in a two layer confined colloidal range 0.8800⭐ 2D suspension in which the colloid-colloid interaction is an almost hard core repulsion with continuous derivatives 关see Eq. 共2.2兲兴. As in the preceding study, the wall separation was * fixed at 1.80. The equilibrium state of the system for 2D * ⭓1.0300 is a two layer hexagonal solid, and for 2D ⭐0.9300 is a two layer square solid. The distribution of the lattice angle for the density range * ⭐1.0300 is shown in Fig. 10. When 2D * 0.9300⭐ 2D ⫽1.0200, there is a rhombic phase whose smaller lattice * angle, 1 , increases with decreasing density until 2D ⫽0.9700, where 1 ⫽75°, signaling the onset of coexistence between the rhombic phase and the 2䊐 phase. The lateral pressure as a function of the one layer-two-dimensional number density is shown in Fig. 11. In the density range * ⭐0.9800, this isotherm displays a van der 0.9500⭐ 2D Waals loop. The density range over which the van der Waals loop exists matches that for coexistence between the twolayer-rhombic and 2䊐 phases, which clearly identifies the first order character of that transition. Identification of the character of the 2䉭→two-layerrhombic transition is harder. Our results indicate that this transition can be either weakly first order or continuous. The ambiguity in our results is a consequence of the fact that the * transition spans a very small density range. When 2D
PRE 61
HEXAGONAL TO SQUARE LATTICE CONVERSION IN . . .
677
FIG. 11. The lateral pressure as a function of the one layer-two dimensional number density for the system with hard core repulsions.
⫽1.1200, 1 ⫽68°, and our data show that the stable phase is rhombic. For slightly higher densities the existence of a stable rhombic phase with a value of 1 that is close to 60° can be masked by thermal fluctuations. * The in-plane configuration of the particles when 2D ⫽0.9800 共corresponding to the rhombic phase just before the onset of coxistence with the 2䊐 phase兲 is shown in Fig. 12. The coexistence between linear and zigzag rhombic phases is readily identified after examination of a small section of this configuration that includes both phases 共Fig. 13兲. If we suppose the rhombic phase to be generated by distortion of the hexagonal lattice via particle displacement, the structure of the distortion can be realized by connecting the six closest neighbors of a central particle. The structure of the distortion for the zigzag rhombic phase is shown in the lower right of
FIG. 13. Small section of Fig. 12 showing coexistence between linear 共upper part兲 and zigzag 共lower part兲 rhombic phases. The two hexagons on the right show the distortions of the hexagonal lattice to form the rhombic phases, and on the left are the arrangements of the nearest neighbors in each of the phases. Just one layer is shown, and the size of the circles is smaller than the actual size of the particles.
Fig. 13. Note that two of the six neighbors are no longer nearest neighbors, and the nearest neighbor configuration is kite shaped 共lower left兲. The corresponding distortion for the linear rhombic phase is shown in the upper part of Fig. 13, where the shape of the arrangement of the four nearest neighbors is rectangular. The results of our simulations show that * ⭐0.9800, the lateral for the pure rhombic phase, 1.0200⭐ 2D pressure isotherm does not show a van der Waals loop 共Fig. 11兲. Since we have found only one set of values for 1 and 2 , a unimodal distribution of the energy per particle 共Fig. 14兲 and a unimodal distribution of the Voronoi polygon area 共Fig. 15兲 for any density that corresponds to the rhombic phase, we infer that the linear and zigzag rhombic phases are degenerate and have the same lattice angle, as already suggested by Schmidt and Lo¨wen 关5兴. IV. DISCUSSION
* ⫽0.9800) FIG. 12. The lateral configuration of a density ( 2D that corresponds to the rhombic phase for the system with hard core repulsions. The upper layer is denoted by empty circles, and the lower layer is denoted by filled circles and is mostly hidden.
In a system in which the particle-particle interactions are hard sphere repulsions, the 2䉭→2䊐 transition is entropy driven. In contrast, in a system in which the particle-particle interactions are of the Marcus-Rice form, the existence of the attractive well plays a crucial role in the 2䉭→2䊐 transition: it stabilizes the hexagonal phase and the square phase at the expense of the rhombic phase. We suggest that this stabilization is a consequence of the number of nearest neighbor interactions in each of the phases. Although the bilayer with square packing has eight nearest neighbor interactions and the bilayer with hexagonal packing has nine nearest neighbor interactions, for some density range the former is more stable because of the occupation of sites with interlayer particleparticle separations that correspond to the position of the attractive well, and hence decrease the energy of the system. The bilayer with rhombic packing on the other hand has only
678
RONEN ZANGI AND STUART A. RICE
FIG. 14. Energy 共potential plus kinetic兲 per particle distribution for the system with hard core repulsions for densities that corre* ⫽1.0200 共empty triangle兲, 2D * sponds to the rhombic phase: 2D * ⫽0.9800 共empty square兲. ⫽1.0000 共filled circle兲, and 2D
seven 共four intralayer and three interlayer兲 nearest neighbor interactions. The close packed density of the rhombic phase is larger than that of the square phase but smaller than that of the hexagonal phase. Then, at a fixed density where the rhombic phase can be found, it is preferable to have the coexistence of square and hexagonal phases rather than a pure rhombic phase. In a single layer colloid suspension in which the particleparticle interaction is of the Marcus-Rice form, there can be coexistence of different particle-particle separations without phase separation 关8兴. Zangi and Rice showed that there is a density range in which the one layer hexagonal solid is a single phase with mixed short and long particle-particle separations. The long particle-particle separations correspond to the position of the attractive well in the interparticle potential. The short particle-particle separations, which decrease continuously as the density increases, correspond to positions along the soft repulsive part of the Marcus-Rice potential, and the transition from a phase with only long
FIG. 15. The Voronoi polygon area distribution for the system with hard core repulsions for densities that correspond to the rhom* ⫽1.0200 共empty triangle兲, 2D * ⫽1.0000 共filled bic phase: 2D * ⫽0.9800 共empty square兲. circle兲, and 2D
PRE 61
FIG. 16. The interlayer lattice spacing distribution for the system with a Marcus-Rice interparticle potential in the density range * ⭐0.9900 that corresponds to the 2䉭→2䊐 transition. 0.9200⭐ 2D
particle-particle separations to one with only short particleparticle separations is continuous. The explanation proposed for this behavior starts with the observation that the one layer system exhibits only hexagonal packing. Then the potential energy of the system is the same for a fixed number of short and long particle-particle spacings, independent on their spatial distribution, and the equilibrium distribution of particleparticle separations is determined by maximizing the entropy of the system. A similar situation is encountered in the two layer system studied in this paper when the wall separation is in the range 1.80 ⭐H⭐2.30 . In that case we find that there is a continuous transformation between the limiting configurations associated with the long and short particleparticle separations in each of the layers, without any phase separation. Throughout this transformation the system retains two layer hexagonal packing 共buckled or unbuckled兲. For the wall separation range 1.90 ⭐H⭐2.30 two layer square
FIG. 17. Voronoi polygon construction 共empty squares are the Voronoi vertices兲 for a perfect arrangement of a square lattice.
PRE 61
HEXAGONAL TO SQUARE LATTICE CONVERSION IN . . .
FIG. 18. Voronoi polygon construction 共empty squares are the Voronoi vertices兲 for a slightly distorted arrangement of a square lattice that is generated by moving the upper right particle of Fig. 17 by 10% of the interparticle distance to the left.
packing is unstable with respect to two layer hexagonal packing at all densities. Over the density range the 2䉭 phase 共buckled or unbuckled兲 is stable we find, just as in the one layer case, coexistence of interlayer long and short particleparticle spacings and a continuous transition between the two limiting configurations. It appears to be the case that just when the wall separation reaches a value which permits the two layer square packed phase to be stable (H⫽1.80 ), coupling of the interlayer particle-particle separation transition to the 2䉭→2䊐 transition yields a situation where the values of the short and long interlayer particle-particle distances are fixed for the entire range of densities that span the transition 共Fig. 16兲. In this case the potential energy of the system is no longer independent of the spatial distribution of the short and long interlayer particle-particle spacings; the phase separation that is observed corresponds to the configuration that minimizes the energy 共and thereby also the free energy兲 of the system, and the transition becomes strongly first order.
679
FIG. 19. The configuration of a square lattice from a bilayer system 共just one layer is shown兲.
The Voronoi polygon associated with particle i, V(i), is determined by the intersection of the half-planes that bisect the vectors ri j from the center of particle i to the centers of the neighboring particles. It can be shown that the particle that is the closest to particle i defines an edge of V(i). Moreover it turns out, for cases in which the interparticle distance is of the order of the particle size, that every particle in the first coordination shell defines an edge of V(i). Although the converse is not, in general, true, it is customary to associate the particles in the first coordination shell with the edges of V(i). In the Varonoi polygon mapping of a perfect lattice at T⫽0 every edge of a polygon is associated with 共defines兲 a nearest neighbor particle, because all the particles associated with these edges have the same distance from particle i and are, equally, the closest to it. Noting that in our application the Voronoi mapping is applied to an instantaneous configuration sampled from an equilibrium ensemble, we recognize
ACKNOWLEDGMENTS
The research reported in this paper was supported by the National Science Foundation via Grant No. NSF CHE9528923, with assistance from the Materials Research Science and Engineering Center at The University of Chicago, supported by Grant No. NSF DMR-9400379. APPENDIX: NEAREST NEIGHBOR SEARCH
Our analysis of the structure of a confined two layer colloidal suspension exploits the character of the first coordination shell of a particle. We carry out this analysis via a Voronoi polygon mapping of the particle configuration, a method that is widely used in computational geometry 关9,10兴.
FIG. 20. The pair correlation function of the structure shown in Fig. 19.
680
PRE 61
RONEN ZANGI AND STUART A. RICE
TABLE I. The results for nearest neighbor search for a slightly distorted square lattice with 2025 sites. Population determined by Number of NN’s
Number of Voronoi edges
Cutoff distance of r⫽1.35
Voronoi polygon symmetry
3 4 5 6 7 8 9 and up
0 45 484 970 478 48 0
0 2025 0 0 0 0 0
0 2025 0 0 0 0 0
that the fluctuations characteristic of thermal equilibrium slightly distort the structure of the map, and that the distribution of separations between the central particle and those in the first coordination shell has a nonzero width. Since we are assuming cases for which every particle in the first coordination shell defines an edge of V(i), these slightly distorted Voronoi polygons can generate situations where the number of edges of V(i) is equal to or larger than the number of nearest neighbors to particle i. It can be shown 关9兴 that the maximum number of unit spheres that can be in contact with a given sphere is an upper bound to the average number of Voronoi polygon edges for any set of points 共it is six for two dimensions, 12 for three dimensions, etc.兲. Hence, the association of the particles in the first coordination shell with the edges of V(i) is adequate for any system in which the average number of nearest neighbors is maximal. This inference follows from the observation that in such a system for any positive defect in the Voronoi polygon structure there is a compensating negative defect. In the application of a Voronoi mapping to the square lattice we note that each vertex is a point that is equidistant from four particles 共Fig. 17兲. The two particles that lie on the diagonals of the square are not nearest neighbors of each other, and the perpendicular bisector of the line between those two particles does not enter the Voronoi polygon. Rather, that line passes through one of Voronoi polygon vertices, and we again conclude that each edge of the Voronoi polygon is associated with a nearest neighbor. The degeneracy described breaks down when there is a small distortion of the square lattice. In that case a vertex of the Voronoi polygon for the perfect lattice splits into two vertices, thereby introducing an additional edge to the Voronoi polygon for the distorted lattice 共Fig. 18兲. The bisected particleparticle separation that is the source of the new edge belongs to the second coordination shell, so that the list of Voronoi edges then includes both those associated with the nearest neighbor particles and with other particles. However, the number of edges is subject to the constraint that the average number of Voronoi polygon edges can not exceed six. We must extract from this extended list just the particles of the first coordination shell. Just this problem was also encountered in the work of Weiss, Oxtoby, and Grier 关11兴.
The Voronoi polygon edges that are associated with particles that are not in the first coordination shell are in general small. Consequently, the orientations of the Voronoi polygon vertices do not change much relative to where they were for the perfect square lattice 共see Fig. 18兲. Then the number of particles in the first coordination shell determines the shape of the Voronoi polygon, and we can use its symmetry to calculate the number of nearest neighbors. To this end, we calculated the modulus of the quantity 1 ⌿ mi ⫽ ni
ni
兺
j⫽1
e im i j .
共A1兲
for m⫽n i ,n i ⫺1, . . . ,3, where n i is the number of vertices of V(i), 3 is the smallest closed polygon and i j is the angle between an arbitrary fixed axis and the line connecting particle i and vertex j of its Voronoi polygon. The symmetry of ˜ , which is the value the Voronoi polygon is determined by m ˜ nearest neighbors to of m that maximizes 兩 ⌿ mi 兩 2 . The m ˜ particles with the smallest ri j . particles i are thus the m To check the accuracy of our method of calculating the number of nearest neighbors, we analyzed the Voronoi polygon mapping of the configuration of 2025 particles in one layer of a two layer thermally equilibrated system with square lattice symmetry 共Fig. 19兲. We also calculated the pair correlation function of this layer 共Fig. 20兲, and determined that the minimum between the first and second peaks is at r⫽1.35 . The number of nearest neighbors was then calculated from 共i兲 the number of Voronoi polygon edges, 共ii兲 the number of particles that are closer than 1.35 to a selected particle, and 共iii兲 the Voronoi polygon symmetry. The results obtained are summarized in Table I. We find that the results of calculations 共ii兲 and 共iii兲 agree in all details. We note that the average number of Voronoi polygon edges for this slightly distorted square lattice is six. The determination of the number of nearest neighbors by the method described here also correctly reproduces the coexistence of four, five, six, and seven coordinated sites. There is a density range for which, in the rhombic phase, the lattice angle 1 is close to 60°. When this is the case thermal fluctuations of the lattice angle can be larger than the difference between 1 and 60°, and the number of nearest neighbors determined by the Voronoi polygon symmetry analysis is six rather than four. To overcome this problem we used information obtained from the particle spacing distribution. If the number of apparent nearest neighbors is determined for the rhombic phase to be six, then two of those must be more distant from the central particle than the other four. For densities with a bimodal particle spacing distribution we reduced the number of nearest neighbors from six to four. The reduction of the number of nearest neighbors was applied just for sites where the two largest apparent nearest neighbor distances were, on average, larger than the average value of the four smallest nearest neighbor separations plus the width of the distribution of separations. In the other limiting case, when 1 is close to 90°, there is coexistence between a rhombic phase with 1 ⯝75° and a square phase, so the determination of the number of nearest neighbors from the Voronoi polygon symmetry is not compromised.
PRE 61
HEXAGONAL TO SQUARE LATTICE CONVERSION IN . . .
关1兴 Yu. A. Izyumov and V. N. Syromyatnikov, Phase Transitions and Crystal Symmetry 共Kluwer, Dordrecht, 1990兲. 关2兴 Thomas A. Weber and Frank H. Stillinger, Phys. Rev. E 48, 4351 共1993兲. 关3兴 I. Amato, Science 255, 684 共1992兲. 关4兴 B. Pansu, Pi. Pieranski, and Pa. Pieranski, J. Phys. 共France兲 45, 331 共1983兲. 关5兴 Matthias Schmidt and Hartmut Lo¨wen, Phys. Rev. E 55, 7228 共1997兲. 关6兴 B. Pansu, P. Pieranski, and L. Strzelecki, J. Phys. 共France兲 44, 531 共1983兲.
681
关7兴 Alain Bonissent, Piotr Pieranski, and Pawel Pieranski, Philos. Mag. A 50, 57 共1984兲. 关8兴 Ronen Zangi and Stuart A. Rice, Phys. Rev. E 58, 7529 共1998兲. 关9兴 F. P. Preparata and M. I. Shamos, Computational Geometry, An Introduction 共Springer-Verlag, New York, 1985兲. 关10兴 Joseph O’Rourke, Computational Geometry in C 共Cambridge University Press, Cambridge, 1994兲. 关11兴 Jessica A. Weiss, David W. Oxtoby, and David G. Grier, J. Chem. Phys. 103, 1180 共1995兲.