Invited Paper
Hidden object detection: security applications of terahertz technology William R. Tribe, David A. Newnham, Philip F. Taday, and Michael C. Kemp* TeraView Limited, 302/304 Cambridge Science Park, Milton Road, Cambridge, CB4 0WG, United Kingdom ABSTRACT Recent events have led to dramatic changes to the methods employed in security screening. For example, following the failed shoe bombing, it is now common for shoes to be removed and X-rayed at airport checkpoints. There is therefore an increasing focus on new technologies that can be applied to security screening, either to simplify or speed up the checking process, or to provide additional functionality. Terahertz (THz) technology is a promising, emerging candidate. In previous publications we have shown how our THz pulsed imaging systems can be used to image threat items, and have demonstrated that explosive materials have characteristic THz spectra.1 We have also demonstrated that nonmetallic weaponry can be imaged when concealed beneath clothing. In this work we examine more closely the properties of barrier and potential confusion materials. We demonstrate that barrier materials have smooth spectra with relatively low attenuation. We further demonstrate that the terahertz spectra of several common chemicals and medicines are distinct from those of threat materials. Keywords: security screening, terahertz, applications, explosive detection, people screening, imaging, spectroscopy
1. INTRODUCTION 1.1 Critical issues in security screening Recent events have demonstrated the need for ever more effective security screening, and for systems capable of detecting contraband. A wide variety of techniques are already available, for the detection of a variety of threats, such as weapons or explosives, or illicit items, ranging from drugs to illegal immigrants. Current methods of bag screening in the United States and elsewhere typically use X-ray inspection techniques with some use of further image analysis, manual search and chemical trace detection. Passenger screening relies heavily on archway and handheld metal detectors that are deployed throughout most airports. However, these techniques are not foolproof, and beneficial enhancements could be made in detecting the following : •
Weapons containing a small amount of metal;
•
Ceramic weapons;
•
Explosive materials;
•
Chemical and biological threats.
Emerging technologies, such as X-ray backscatter and millimeter wave imaging might be employed to address some current deficiencies. However, the routine use of ionising X-rays raises health concerns, whilst millimeter wave approaches have a limited spatial resolution. It is also unclear whether either technique can provide spectroscopic substance identification. Thus, X-ray and millimeter wave portals are likely to prompt frequent further searching whenever an image indicates a suspect item or area. False alarms can greatly increase the cost and reduce the throughput of screening systems; throughput is crucial in highvolume situations such as in major airports. A further factor is the high dependence of current techniques on human
*
168
[email protected]; phone: 44 1223 435504; fax: 44 1223 435382; www.teraview.com
Terahertz and Gigahertz Electronics and Photonics III, edited by R. Jennifer Hwu, Proc. of SPIE Vol. 5354 (SPIE, Bellingham, WA, 2004) · 0277-786X/04/$15 · doi: 10.1117/12.543049
operators. Any new technique that can enhance capability, and aid in the targeting of manual search operations to specific high-risk objects or areas, would be of major benefit. New detection technologies can play an important role in addressing these issues. Whilst there will be stand-alone applications, new approaches will more frequently complement rather than replace established techniques. This will provide ‘richer’ data that can be fused to provide the basis of highly automated detection systems in multi-threat, multimodal screening portals. 1.2 Terahertz radiation and its properties The “terahertz gap” - where up until recently bright sources of light and sensitive means of detection did not exist - lies between 40 GHz (1.2 cm-1) and 10 THz (300 cm-1). This is between the millimetre/microwave part of the spectrum and the mid-infrared. Conventional microwave sources do not work fast enough to produce radiation efficiently at frequencies above a few hundred gigahertz, whereas diode laser sources have been limited by thermal effects to the infrared and visible. However, in recent years, several approaches have been developed that enable the efficient generation and detection of terahertz radiation, using experimental schemes that are truly commercially viable. The most mature technology uses ultra-fast pulsed laser technology, and produces very short terahertz pulses. As a pulsed technique, with picosecond timescales, the method is intrinsically broadband. Radiation at terahertz frequencies has unique properties that may be advantageous for security applications. It penetrates many non-conducting materials, but unlike X-rays is non-ionising. The short pulses produced by laser techniques also allow radar-like imaging in three dimensions, as well as the simultaneous collection of spectroscopic information as in magnetic resonance imaging (MRI) or optical spectroscopy. This is important because many substances have characteristic intermolecular vibrations at terahertz frequencies that can be used to characterise them as molecules. This contrasts with the detection of bond vibrations of individual molecules, that is the basis of infrared spectroscopy. The four key properties of terahertz imaging which make it a potentially powerful technique in security screening applications are: •
2D imaging – the terahertz reflection and absorption properties of materials differ from their optical and X-ray behavior: clothing, paper, and card are effectively transparent while plastic and ceramic objects are easily visible in terahertz imaging. Plastics and ceramic materials are hard to pick out using backscatter X-ray techniques as there is little contrast between the human body and these materials.
•
High resolution 3D imaging – the extremely short pulses used in pulsed terahertz techniques enable 3D imaging, much like radar. For example, thin layers of powder and individual pages can be resolved inside an envelope.
•
Spectroscopy – this enables characteristic signatures of different chemicals to be detected, even when sealed inside a packet or concealed in clothing.
•
Safety – terahertz radiation is non-ionizing2
These properties also lead to applications in other areas, for example in medical imaging where it can detect skin cancer,3 in pharmaceutical manufacturing for polymorph detection,4 and in a variety of industrial inspection applications. The millimeter and microwave region can give spectroscopic rotational information about gaseous molecules while the mid-infrared accesses the molecular finger-print region, where features are due to intra-molecular stretching and bending vibrations between atoms. Assignment of these vibrational modes can lead to an understanding of the conformation of the molecule. In the terahertz region the spectral information comes from the collective modes of lattice structure (or phonon vibrations) in solid materials. This makes the technique very sensitive to both the crystalline conformation and polymorphic form of the material in the solid phase, and to some higher frequency molecular rotations in gas phase materials. The liquid phase spectroscopic information is a complex mixture of rotational and transitional modes.
Proc. of SPIE Vol. 5354
169
1.3 Terahertz pulsed spectroscopy Terahertz pulsed spectroscopy (TPS) is a promising new technique which may have much relevance to the security industry. Until recently, working in the terahertz region was difficult with researchers having to use low sensitivity pyroelectric detectors or liquid helium-cooled bolometers and weak blackbody sources; only 1 part in 108 of the total output from a 104 K blackbody is in the range 1 to 2 THz. In the early 1990s developments using ultra-short pulse lasers allowed the generation of terahertz pulses. Today, this mature technology is sufficiently developed to allow turnkey ultra-fast lasers to be incorporated into commercial terahertz instrumentation. Terahertz technology relies on the fact that when an ultra-short pulse is focused onto a suitable semiconductor, or electro-optic crystal, a short-pulse of coherent terahertz radiation is emitted. This can be detected using electro-optic sampling5 or a photoconductive receiver. The technique works at room temperature and, as a result of the very short time gate provided by the pulsed laser, the detectors are extremely sensitive, and approach the fundamental noise limits. Even at low power levels it is possible to readily obtain measurements with very high dynamic range and signal-to-noise ratios (>105). In addition, because it is a coherent technique both amplitude and phase information are measured from which both spectral absorption coefficients, α(ω), and the refractive indices, n(ω), of the material under investigation can be extracted. For both photoconductive and electro-optic generation the emitted radiation can be coupled to free-space Gaussian modes, and therefore it is easy to manipulate, leading to the application of terahertz imaging. The TeraView group7 have used terahertz pulsed imaging to investigate basal cell carcinomas and shown that there is a significant difference between the tumor and healthy tissue in this spectral region. The contrast mechanism is believed to be a change in the water content of the cancerous skin. Water has very intense absorption features in the terahertz region making it an excellent molecular marker for diseased tissues. Another possible medical application is the terahertz imaging of teeth.8 The terahertz pulses generated from the semiconductor are broadband in nature, and can thus be used for spectroscopic applications. In previous work1 we have shown that all the major plastic explosives have discrete, well-described spectral signatures and hence may be useful in security screening applications. There is also interest in combining the imaging capability of terahertz radiation with the full spectroscopic data for non-destructive testing and detection of illicit drugs.9 Walther et al.10 used terahertz pulsed spectroscopy to study the temperature-dependent absorption spectra of a range of polycrystalline saccharides. Sugars are of interest to pharmaceutical industry as they are often used in coatings or as a sweetener in tablets. Saccharides are also excellent model systems to aid in the further understanding of terahertz pulsed spectroscopy as their crystalline structure typically contains not only hydrogen bonds but also weak van der Waals interactions which, using temperature-dependent spectra, allows phenomenological investigations of phonon vibrations. Competition was observed between relatively strong hydrogen bonding and the weaker van der Waals interactions, demonstrating that the crystalline structure in saccharides could be a delicate balance between the two different types of bonding. The data obtained by this group should allow a better theoretical understanding of weak non-covalent bonds to be developed. Taday et al.11 exploited the sensitivity of the technique to crystalline structure to observe the differences between the polymorphs of ranitidine hydrochloride. Quantitative analysis of materials using terahertz spectroscopy also appears to be possible.12 The purpose of this work is to examine further the possible application of terahertz technology to security screening, in the light of our recent measurements of potential barrier and confusion materials. There has been widespread speculation that while the approach is interesting, the spectral features and attenuation from these materials might inhibit its widespread application. In order to address these concerns, quantitative information is needed to determine how well terahertz radiation penetrates various materials, and whether the materials have distinctive spectral fingerprints that will enable identification or cause confusion with ‘threat’ substances. This is achieved by experimental measurement of terahertz transmission and reflection by samples of the materials identified as of interest. Either integrated absorption/refractive index measurements across the full bandwidth of a terahertz pulsed imaging (TPI) imaging system, or spectral fingerprints are recorded using a TPS system and compiled into an electronic spectrum library.
170
Proc. of SPIE Vol. 5354
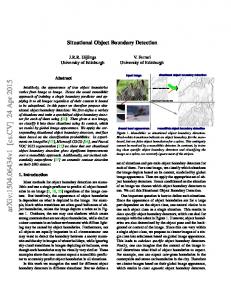
2. METHODOLOGY 2.1 Terahertz pulsed spectrometer All terahertz pulsed spectra were measured in transmission using a laboratory version of the TPI™ spectra 1000 instrument (TeraView Limited). The main difference between the commercial spectrometer and the laboratory system is the use in the latter of electro-optic detection rather than photoconductive receivers, resulting in narrower bandwidth and lower signal-to-noise. A schematic diagram of the experimental set-up of the terahertz pulsed spectrometer is shown in Fig. 1. Terahertz pulses are generated when ultra-short laser pulses from a bandwidth limited titanium (Ti):sapphire mode-locked ultrafast laser (Vitesse, Coherent Inc) are focused onto a GaAs photoconductive switch. The laser produces sub-100 fs pulses at a repetition rate of 80 MHz and an average power of 300 mW; however only a few tens of mW are needed for the terahertz generation and detection processes. A large DC voltage is applied across the electrodes of the switch. With suitably designed semiconductor devices the ultra-short laser pulse generates charge carriers in the semiconductor. A transient current is then able to flow across the closed switch, and terahertz radiation is coupled to free-space using a suitable designed antenna structure. The electric field E(t) of the terahertz pulse is proportional to the rate of change of current with respect to time (i.e. δJ(t)/ δt, where J(t) is the transient current). The terahertz radiation emitted into free-space by the GaAs substrate is collected by parabolic mirrors and focused to a diffraction-limited spot in an evacuated or nitrogen-purged chamber. The sample to be investigated is usually placed at the focal position. Detection of the terahertz radiation is achieved using a zinc telluride electro-optic detection system. This operates by detecting the rotation of the polarization within the laser pulse, caused by the birefringence induced in the crystal by the terahertz electric field. By stepping the laser pulse through the terahertz pulse in the time domain, using the variable optical delay, we are then able to measure the amplitude of the complete terahertz pulse. Fig. 1. Schematic diagram of the terahertz pulsed spectrometer system used for THz transmission measurements.
Beam Splitter
THz Generation
Sample OAP
antenna
THz detection
antenna
Variable Optical Delay
OAP
Computer Control
Proc. of SPIE Vol. 5354
171
2.2 Sample preparation and handling Small quantities of high-purity (>99%) chemical materials were used as supplied. Representative, clean samples of clothing and luggage with different compositions were cut from the bulk items and measured by placing them in the terahertz beam. Powder samples were prepared by grinding and milling the target material to a fine powder and mixing with spectrophotometric-grade polyethylene (PE) powder (Aldrich) at a ratio of 25 wt% sample in 75% PE. For each material three tablets comprising 5 mm diameter, 1.0 (±0.1) mm thick discs were prepared by compressing 20 ± 5 mg samples from each mixture under approximately 2-tons with a hydraulic press. Polyethylene was chosen as a suitable analysis matrix as it is nearly transparent and has very low dispersion with a frequency-independent index of refraction of 1.53 ± 0.02 in the far-infrared region below 170 cm-1. Measurements on wax/gel, liquid, and gas/vapour materials, not presented here, were made with the sample contained in spectroscopic cells with suitable optical windows. 2.3 Sample measurements The measurements reported here were performed with 100 ms integration time per data point over a total optical delay line of 31.8 ps. The resulting maximum spectral resolution of 36 GHz (1.2 cm-1) was adequate to fully resolve spectral features of the target materials. For each of the three samples prepared using each target material, three repeat terahertz spectra were recorded. This confirmed that observed spectral features were reproducible and permitted assessment of uncertainties e.g. due to imperfect mixing of powders. All measurements were performed at room temperature, 296 ± 1 K. For tablet and sample cell measurements the terahertz beam path was evacuated to a pressure below 0.1 hPa, while for clothing and baggage sample measurements a dry nitrogen purge removed atmospheric absorption features. Background (reference) spectra recorded before and after each sample measurement were averaged to account for any linear instrumental baseline drift.
3. RESULTS Typical raw terahertz waveforms, prior to signal processing, are plotted in Fig. 2. The smaller oscillations after the main pulse in the background are due to dispersion in the terahertz beam path and back-reflections from the GaAs antenna substrate. The power spectra, obtained from Fourier transform of the time-domain waveform data in Fig. 2 is shown in Fig. 3. The instrument bandwidth covers 300 GHz (10 cm-1) to 3.5 THz (120 cm-1).
0.008 0.006
(a)
0.004 0.002
(+0.004) (b)
0.000 -0.002 0
10 20 Optical time delay/ps
30
Fig. 2. Representative terahertz time domain raw data, for (a) background and (b) sample measurements. The background plot is offset vertically for clarity.
172
4.2
1
Signal (arb. units)
Electric field (arb. units)
Frequency/THz 0.0 0.6 1.2 1.8 2.4 3.0 3.6
Proc. of SPIE Vol. 5354
10 0 10 -1 10 10 -2 -3 10 -4 10 -5 10
(a)
(b)
0
20
40 60 80 100 120 140 Wavenumber/cm-1
Fig. 3. Terahertz single-beam spectra for (a) background and (b) sample measurements, generated by Fourier transform of the data in Fig. 1.
The raw spectroscopic data were processed to determine absorbance (decadic) spectra and refractive indices for each material of interest. The ratio of the terahertz electric field strengths before transmission, Er, and afterwards, Es, is given by: Es E r
= T (n) exp − αd + inωd 2 c 0
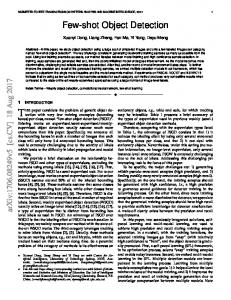
where d is the sample thickness, ω the angular frequency of the radiation, c0 the speed of light in vacuum and T(n) is the Fresnel reflection loss at the sample surface. Thus by measuring the ratios of the electric fields it is straightforward to obtain both the absorption coefficient α and the frequency-dependent refractive index n of the media. For tablet materials it is necessary to account for the dilution in polyethylene powder in determining d. Example data sets resulting from our THz transmission measurements on 84 materials are shown in Figs. 4-8. For clearer representation the data have been offset vertically by the amounts indicated in the figures. The weak oscillations at low frequencies are artefacts, e.g. due to etalon effects such as multiple reflections of the terahertz beam between the plane parallel surfaces of the tablet samples. Typical baseline signal-to-noise ratio (rms) at 60 cm-1 (2.0 THz) is 125:1. To investigate the ability of terahertz spectroscopy to detect explosives, we previously measured the absorption spectra of several explosives samples in the range 300 GHz to 3 THz. Figure 4 shows spectra for the raw explosives trinitrotoluene (TNT), tetranitro-tetracyclooctane (HMX), pentaerythritol tetranitrate (PETN), and trinitrotriazcyclohexane (RDX) together with spectra for the compound explosives PE4 and Semtex H. PE4 consists of RDX mixed with a plasticiser while Semtex H is a mixture of RDX, PETN, and plasticiser. All the raw explosives have distinctive spectra with several absorbance peaks in the measurement range whilst the compound explosives have peaks arising from their constituents. The measured absorbance spectra of several potential confusion materials are shown in Figures 5 and 6. For sucrose the observed spectral signature agrees with that reported at 300 K by Walther et al10., with features above 100 cm-1 clearer due to higher signal-to-noise in our measurement. Marzipan, a material that can be easily mistaken for threat materials, can be seen to have essentially the same spectrum as sucrose, its main ingredient. Values of the observed peak positions for the materials presented in Figs. 4-6 are listed in Table 1. It should be noted that even where bands overlap for different materials the shapes and relative intensities of the features differ, permitting identification using spectral library data in standard algorithms. Band center positions Material
Wavenumber/cm-1
Frequency/THz
Semtex-H (RDX+PETN+plasticiser) PE4 (RDX+plasticiser) RDX PETN HMX TNT Lactose α monohydrate Icing sugar Co-codamol Aspirin, soluble Aspirin, caplets
24, 43, 58, 63, 72, 82, 86 24, 43, 58, 65, 74, 83, 90 24, 42, 58 58, 84 53, 64, 74, 86 48, 64 18, 40, 46, 61, 85, 96, 110 48, 54, 61, 75, 86, 95, 115 62, 70, 98 46, 109 75
0.72, 1.29, 1.73, 1.88, 2.15, 2.45, 2.57 0.72, 1.29, 1.73, 1.94, 2.21, 2.48, 2.69 0.72, 1.26, 1.73 1.73, 2.51 1.58, 1.91, 2.21, 2.57 1.44, 1.91 0.54, 1.20, 1.38, 1.82, 2.54, 2.87, 3.29 1.44, 1.61, 1.82, 2.24, 2.57, 2.84, 3.44 1.85, 2.09, 2.93 1.38, 3.26 2.24
Table 1. Absorbance peak positions for explosive and potential confusion materials.
Proc. of SPIE Vol. 5354
173
0.3
Frequency/THz 1.2 2.1 3.0
(c) (d)
10
(e) (f)
5
130
Fig. 4. Terahertz spectral signatures are distinct for different common high explosive materials (a) Semtex H, (b) PE4, (c) RDX, (d) PETN, (e) HMX, and (f) TNT. Plots (a)-(e) are offset vertically for clarity.
0.3 50
Frequency/THz 1.2 2.1 3.0
4
(a)
3
(+3.0)
2
(b)
1
(+1.5) (c) 10
0.3
Attenuation (dB/layer)
30 20
40 70 100 Wavenumber/cm-1
130
Frequency/THz 1.2 2.1 3.0
3.9
60
40 (a) (+5.0)
10
40 (+5.0)
(a)
20
(b)
(b)
0
0 10
40
70
100
130
Wavenumber/cm-1
Fig. 7. Common clothing materials (a) polyester and (b) cotton have sufficient terahertz transmission to permit detection of hidden explosive materials. Plot (a) is offset vertically for clarity.
Proc. of SPIE Vol. 5354
10
40
4 (a) 3
(+3.0)
2
(b)
1
(+1.2) (c)
0
Fig. 5. Unique terahertz spectral signatures of (a) lactose α monohydrate, (b) icing sugar – principally sucrose, and (c) marzipan. Plots (a) and (b) are offset vertically for clarity.
3.9
3.9
5
0 40 70 100 Wavenumber/cm-1
Frequency/THz 1.2 2.1 3.0
0.3
Absorbance ( decadic)
15
Absorbance ( decadic)
(b)
10
174
3.9
5
0
Attenuation (dB/layer)
Frequency/THz 1.2 2.1 3.0
0.3 6
(a)
20 Absorbance ( decadic)
3.9
70
100
130
Wavenumber/cm-1
Fig. 8. Luggage and packaging materials such as (a) artificial leather from a suitcase and (b) cardboard are non-opaque at frequencies below 4 THz. Plot (a) is offset vertically for clarity.
10
40 70 100 Wavenumber/cm-1
130
Fig. 6. The terahertz spectral signatures of common medicines (a) co-codamol, (b) soluble aspirin, and (c) aspirin caplets are sufficiently distinct to avoid potential confusion with threat materials. Plots (a) and (b) are offset vertically for clarity.
For clothing and baggage materials the transmittance data is converted to attenuation per layer of material, defined as:
10 log(P0 P ) = −10 log τ = 10 A where P0 is the THz power incident on the material, P is the THz power exiting one layer of the material, τ is the material transmittance, and A is the material absorbance (decadic). We use this definition rather than the usual one of attenuation as a loss per unit thickness of material, due to the risk of introducing uncertainties in determining thickness of compressible clothing and baggage materials. Furthermore, it is the attenuation per layer that is the critical factor in determining whether terahertz measurements can indeed be performed through barrier materials. The examples in Figures 7 and 8 demonstrate that many of these materials show smooth, featureless terahertz absorption with only modest attenuation below 2 THz (60 cm-1).
4. CONCLUSIONS We have measured terahertz spectra of a wide range of materials relevant to security screening in categories of threat and potential confusion substances, clothing, and luggage or packaging. The explosive substances studied have unique terahertz signatures in the spectral range 500 GHz (17 cm-1) to 2.5 THz (83 cm-1), readily distinguishable from those of potential confusion materials. Many plastics, paper, clothing and packaging materials have smooth, featureless terahertz absorption with modest attenuation below 2 THz (60 cm-1). We therefore believe that there are excellent prospects for using terahertz to develop practical spectroscopic and imaging systems for detecting hidden explosives, or for the detection of concealed hidden weapons, such as ceramic weaponry, that would defeat current metal detection technologies.
ACKNOWLEDGEMENTS Thomas Prikosovits of the Technische Universität Vienna, Austria provided assistance in the terahertz transmission measurements carried out at TeraView Limited. Support from the UK Department of Trade and Industry through SMART Award Ref. SEC 117/338 is acknowledged
REFERENCES 1.
M. C. Kemp, P. F. Taday, B. E. Cole, J. A. Cluff, A. J. Fitzgerald, and W. R. Tribe, “Security applications of terahertz technology”, Proc. SPIE, 5070, 44-52 (2003). 2. See for example for about terahertz safety www.frascati.enea.it/thz-bridge/ 3. R. M. Woodward, V. P. Wallace, R. J. Pye, B. E. Cole, D. D. Arnone, E. H. Linfield, and M. Pepper “Terahertz pulse imaging of ex vivo basal cell carcinoma”, J. Invest. Derm., 120 (1) 72-78 (2003). 4. P. F. Taday, “Applications of terahertz spectroscopy to pharmaceutical sciences”, Phil. Trans. Roy. Soc.: Mathematical, Physical & Engineering Sciences, to be published January 2004. 5. Q. Wu and X. C. Zhang, “Free-space electro-optics sampling of mid-infrared pulses”, Appl. Phys. Lett., 71 (10), 1285-1286 (1997). 6. M. van Exter and D. Grischkowsky, “Characterization of an optoelectronic terahertz beam system”, IEEE Trans. Microwave Th. Techo., 38, 1684-1691 (1990). 7. V. P. Wallace, P. F. Taday, A. J. Fitzgerald, R. M. Woodward, J. Cluff, and D. D. Arnone, “Terahertz pulsed imaging and spectroscopy for biomedical and pharmaceutical applications”, Faraday Discuss., 126 (in press, 2004). 8. D. Crawley, C. Longbottom, V. P. Wallace, B. Cole, D. Arnone, and M. Pepper “Three-dimensional terahertz pulse imaging of dental tissue”, J. Biomed. Opt., 8 (2) 303-307 (2003). 9. K. Kawase, Y. Ogawa, Y. Watanabe, and H. Inoue,” Non-destructive terahertz imaging of illicit drugs using spectral fingerprints”, Opt. Express, 11, 2549-2554 (2003). 10. M. Walther, B. M. Fischer, and P. U. Jepsen, “Non covalent intermolecular forces in polycrystalline and amorphous saccharides in the far infrared”, Chem. Phys., 288, 261-268 (2003).
Proc. of SPIE Vol. 5354
175
11. P. F. Taday, I. V. Bradley, D. D. Arnone, and M. Pepper, “Using Terahertz Pulse Spectroscopy to study the crystalline structure of a drug: A case study of the polymorphs of ranitidine hydrochloride”, J. Pharmaceutical Sciences, 92 (4) 831-838 (2003). 12. P. F. Taday, “Applications of terahertz spectroscopy to pharmaceutical sciences”, Phil. Trans. Roy. Soc.: Mathematical, Physical & Engineering Sciences, (in press, 2004).
176
Proc. of SPIE Vol. 5354