NeuroImage 124 (2016) 238–247
Contents lists available at ScienceDirect
NeuroImage journal homepage: www.elsevier.com/locate/ynimg
Hierarchical error representation in medial prefrontal cortex Noah Zarr a, Joshua W. Brown a,⁎ a
Department of Psychological and Brain Sciences, Indiana University, 1101 E. 10th St, Bloomington, IN 47405, USA
a r t i c l e
i n f o
Article history: Received 26 March 2015 Accepted 28 August 2015 Available online 4 September 2015 Keywords: Prediction error Medial prefrontal cortex Hierarchy Abstraction Gradient fMRI
a b s t r a c t The medial prefrontal cortex (mPFC) is reliably activated by both performance and prediction errors. Error signals have typically been treated as a scalar, and it is unknown to what extent multiple error signals may co-exist within mPFC. Previous studies have shown that lateral frontal cortex (LFC) is arranged in a hierarchy of abstraction, such that more abstract concepts and rules are represented in more anterior cortical regions. Given the close interaction between lateral and medial prefrontal cortex, we explored the hypothesis that mPFC would be organized along a similar rostro-caudal gradient of abstraction, such that more abstract prediction errors are represented further anterior and more concrete errors further posterior. We show that multiple prediction error signals can be found in mPFC, and furthermore, these are arranged in a rostro-caudal gradient of abstraction which parallels that found in LFC. We used a task that requires a three-level hierarchy of rules to be followed, in which the rules changed without warning at each level of the hierarchy. Task feedback indicated which level of the rule hierarchy changed and led to corresponding prediction error signals in mPFC. Moreover, each identified region of mPFC was preferentially functionally connected to correspondingly anterior regions of LFC. These results suggest the presence of a parallel structure between lateral and medial prefrontal cortex, with the medial regions monitoring and evaluating performance based on rules maintained in the corresponding lateral regions. © 2015 Elsevier Inc. All rights reserved.
Introduction The hierarchical structure of behavior has persistently been recognized by researchers in psychology and related fields (Botvinick, 2008; Lashley, 1951; Miller et al., 1960). Behaviors are organized into chunks composed of a series of actions which jointly bring about a particular outcome. In many cases, each of the actions in such a series can be further decomposed into yet more actions. This process does not necessarily require any conscious effort and is present even in creatures as simple as wasps (Baerends, 1976). Similar patterns are present in higher animals including birds, monkeys, and humans (Baerends, 1976; Botvinick, 2008; Botvinick et al., 2009). The hierarchical structure of behavior is both visible externally and introspectively, but is that structure instantiated in the brain? A variety of both modeling and neuroscience research suggests that this may be the case (Badre and D'Esposito, 2009; Botvinick, 2008; Cooper and Shallice, 2000). One way such a system could be implemented neurally involves primary motor cortex representing motor primitives, premotor cortex representing combinations of those primitives, posterior prefrontal cortex representing combinations of those combinations and so on, moving progressively anterior. While the precise regions involved at each level vary across studies, the presence of a rostro-caudal gradient of
⁎ Corresponding author at: Department of Psychological & Brain Sciences, 1101 E. 10th St., Bloomington, IN 47405, USA. E-mail address:
[email protected] (J.W. Brown).
http://dx.doi.org/10.1016/j.neuroimage.2015.08.063 1053-8119/© 2015 Elsevier Inc. All rights reserved.
abstraction in the lateral prefrontal cortex (PFC) has been repeatedly verified by imaging data (Badre and D'Esposito, 2007; Christoff et al., 2009; Koechlin et al., 2003; Nee and Brown, 2012; but see Crittenden and Duncan, 2012). The notion of abstraction generally refers to representations that are more distant from concrete action. Various possible definitions include compositional containment, in which actions are chunked into hierarchies, or temporal abstraction, in which information represents events that are (or will be) more distant in time (Nee et al., 2014). Here we use the term “hierarchy of abstraction” specifically to denote higher level rules that specify which lower level rules will be implemented, or how they will be implemented. We recently showed that in the lateral PFC, the hierarchy of abstraction was not defined by temporal distance. Instead, more anterior regions represented rules that indicated which lower level rules should be implemented, and under what combination of circumstances (Nee et al., 2014). Relatedly, we found that more anterior lateral PFC regions do not discriminate among specific details of an action. Rather, they discriminate among rules that guide the implementation of lower level rules (Nee and Brown, 2012). Thus the more abstract representations in the hierarchy of abstraction here are essentially rules that guide the implementation of lower level rules. Though the existence of an abstraction gradient has been relatively well studied in lateral frontal cortex (LFC), its existence in other brain regions has been investigated to a much lesser degree. Medial prefrontal cortex (mPFC) is a particularly attractive region for such an investigation due to its frequent activation in cognitive tasks and its topographic connectivity with LFC (Barbas and Pandya, 1989; Taren et al., 2011). The
N. Zarr, J.W. Brown / NeuroImage 124 (2016) 238–247
anterior cingulate cortex (ACC) in particular is a subset of the mPFC and has often been ascribed a performance monitoring role. This is due in part to the robust finding that the ACC becomes active as a result of errors. This has been observed in monkey electrophysiology data (Gemba et al., 1986; Niki and Watanabe, 1979), EEG data in humans (Debener et al., 2005; Falkenstein et al., 1990; Gehring et al., 1990), and neuroimaging data (Carter et al., 1998; Debener et al., 2005). The ACC does not respond only to affectively negative errors. The ACC also shows robust activation to prediction errors, which occur whenever a different-than-expected outcome is observed even if that outcome does entail loss of reward or incorrect performance (Jahn et al., 2014; Wessel et al., 2012). Strong evidence indicates that the ACC is generally responsive to prediction errors rather than negative affect per se (Alexander and Brown, 2014; Ferdinand et al., 2012; Garofalo et al., 2014; Jessup et al., 2010; Oliveira et al., 2007). Prediction errors signal a discrepancy between the actual world and maintained rules or models of the world, necessitating the subject to update the rules or model guiding their behavior. This picture is supported by the observed role of mPFC in task switching (Rushworth et al., 2002) and error-related modulation of LFC by mPFC (Ridderinkhof et al., 2004). While prediction errors are a distinct construct from performance errors, the two often coincide because performance errors are often the result of an inadequate understanding of the current environment and conversely prediction errors often result in incorrect performance. Moreover, performance errors are typically infrequent, which leads to a confound between the two. The joint conclusions that there is a rostro-caudal gradient of abstraction in LFC and that mPFC monitors the performance of goals and/or models of the world suggest a further possibility, namely that there may be a hierarchy of prediction error monitoring. Humans can easily distinguish lower-level prediction errors from higher-level prediction errors. For example, imagine someone searching for an item in a dark building. A low level prediction error would occur if one flips a switch expecting the light to come on but instead it does not, while a high level prediction error would occur if the object is not found in the searched room. These distinct unexpected outcomes require different behavioral adjustments, the former being more directly connected to concrete motor actions than the latter. That humans can effectively make use of this information suggests that the performance of distinct action sequences at various levels in the action hierarchy are monitored independently. If each unit of task representation maintained in LFC requires its own unit of performance monitoring in mPFC, we might therefore expect a rostro-caudal gradient of abstraction in mPFC analogous to the one observed in LFC. While this topic hasn't been as thoroughly examined in mPFC compared to more lateral areas, a number of investigations have suggested this possibility (Egner, 2009; Kouneiher et al., 2009; Venkatraman et al., 2009). Furthermore, if distinct areas of mPFC monitor the performance of goals maintained in distinct lateral areas, then we should also observe a pattern of connectivity such that more anterior regions of mPFC are preferentially connected to more anterior regions of LFC, which has in fact been observed (Margulies et al., 2007; Taren et al., 2011). While error-related activity in the mPFC has been widely reported, it has not been used to investigate the existence of a rostro-caudal gradient of abstraction. If the mPFC is monitoring for prediction errors relating to several simultaneously active task rules at different levels of abstraction, there should be an independent neural response associated with the distinct prediction errors accompanying the rules unexpectedly changing. Treating prediction error as a vector (with multiple distinct prediction errors) rather than a scalar (with only a single prediction error) has been utilized in some computational modeling (Alexander and Brown, 2011). Other accounts, particularly those which attempt to model dopamine signals, imply a scalar value (Holroyd and Coles, 2002). Importantly, a vector prediction error signal can contain multiple signals simultaneously, providing information about which aspect of an
239
event went differently than expected rather than merely signaling that some aspect or other of an event was unexpected. Multiple prediction error signals have been detected in the ventral striatum (Diuk et al., 2013), and there is evidence of an outcome-error system in medial–frontal cortex and a distinct motor-error system in posterior parietal cortex (Krigolson and Holroyd, 2006; Krigolson et al., 2008; Logan and Crump, 2010). Still, the existence of multiple outcome-errors within mPFC has not been demonstrated. We investigated whether we could detect distinct error signals in mPFC while participants completed a hierarchical task in which they encountered error feedback at varying levels of the task hierarchy. We predicted that not only would we observe distinct error signals in mPFC but that they would be arranged in a rostro-caudal gradient of abstraction. That is, prediction errors related to the most abstract rule should elicit the most anterior activity, while errors pertaining to the least abstract rule should elicit the most posterior activity within mPFC. Such a finding would not only provide further support for the theory that the mPFC is organized according to a hierarchy of abstraction, it would be the first to do so using error-based activity. It would also have modeling implications, supporting the notion of a vector representation of error rather than a scalar representation. Materials and methods The Institutional Review Board of Indiana University approved the experimental procedures reported here. Participants In all, 34 participants (23 female) completed the final (i.e., non-pilot) version of the behavioral task of which 27 performed with 90% accuracy or greater. Of these, 21 were both willing to participate in the fMRI session and fulfilled all our criteria. Three subjects were excluded with their data unanalyzed due to equipment failures and procedural errors, leaving 18 subjects (11 female, mean age = 22) for the analyses. Participants were right-handed and reported no history of psychiatric or neurological disorder or use of psychoactive medications. Participants were compensated $25/hour for their time in addition to a bonus of up to $10 based on their performance on the task. Task We created a novel hierarchical task which allowed prediction errors to occur at different levels of the hierarchy without being confounded by error frequency (see Fig. 1). Prediction errors indicated the need to update a task rule, which in turn indicated which lower level rules were to be implemented, or how they were to be implemented, consistent with our earlier definition. The experiment was created using OpenSesame, an open-source experiment development package using python (Mathôt et al., 2012). On each trial, an object appeared in the leftmost “bin” (the white square). The object had two relevant properties—its shape (oval vs triangle) and its color (cool vs warm). The participant was then able to make one of two responses, using their left or right index fingers on the respective hand paddles. The participant's goal was to sort the object into one of the two bins on the right. The correct response on each trial depended on the currently active rules. There were three distinct rules at various levels of abstraction. The least abstract, low-level rule consisted of a mapping between the two response buttons and the two target bins on the right. Each button was always mapped to exactly one of the bins, so that pressing the button sent the shape to the bin. The mid-level rule associated stimulus features with each of the two target bins. For instance, the top bin might be assigned ‘triangle’ and ‘warm.’ In this case, the lower bin would be assigned the complement, ‘oval’ and ‘cool.’ These associations signified which types of objects should be sorted to each of the target bins. However, because the two dimensions of object properties were
240
N. Zarr, J.W. Brown / NeuroImage 124 (2016) 238–247
Fig. 1. The shape sorting task. First, an object (a colored shape) appeared in the leftmost bin. After participants made a decision, the border around the left bin became bold, indicating that a response had been registered. After a variable delay of at least 8 s, participants saw a feedback screen which provided information about the current values of each of the rules. The lowlevel rule could be determined based on which button was pressed and which bin the object moves to. A text display in the upper left indicated whether the current bin is correct on each of the dimensions by putting a green check-mark or red X next to the corresponding rule. Finally a white box around one of the rules indicated which dimension is relevant according to the high-level rule. After participants advance from the feedback, a fixation cross was presented for the intertrial interval of at least 8 s.
independent of each other, it was entirely possible for a cool triangle to be presented in which case it would not be clear which target bin was correct. The high-level rule told participants which dimension, color or shape, to base their sorting on which resolved this ambiguity. This rule can be seen as specifying the targets of attention or as specifying the task the participant was supposed to do, i.e., a shape-sorting task or a color sorting task. In this way, the information provided by the high level rule is the furthest from concrete motor actions, picking out a unique task rule. In contrast, the low level rule specifies the immediate consequence of the available motor actions, namely which bin each button will send the shape to. The mid-level rule sits between these two extremes, specifying where objects ought to be sorted, given a high-level task specification, without indicating exactly which actions are required to move the objects to those locations. During the interval between object presentation and the response, no rule information was displayed on the screen—any knowledge of the rules needed to be maintained in working memory. Participants could take as much time as they liked to make a response and after making a decision, the dashed border around the bin on the left became bold to indicate that a response had been recorded. This screen was maintained for a jittered delay with a baseline of 8 s, after which the subject saw the feedback screen. The delay period had an exponential distribution such that approximately 80% of trials utilized the minimum delay of 8 s but there was a 20% chance that it would be increased by 2 s. If this occurred, the check was done again to possibly extend it a further 2 s again with a 20% chance and so on, with an overall cap of 12 s. The feedback screen provided enough information to infer the values of all the rules, assuming the participant remembered which key they had pressed. Participants could determine the low-level rule, i.e. the mapping between keys and target bins, by observing which bin the object had moved into. A text display in the upper left of the screen informed participants whether the shape corresponded with the chosen bin on the shape dimension and/or on the color dimension (the midlevel rule). One of the two lines in this text display also had a white box around it, indicating the current high-level rule. For instance, if
participants were supposed to sort according to color, the text “Correct color bin,” would be surrounded by a white border. On most trials, the active rules did not change from the previous trial. However, at the beginning of some trials, exactly one rule changed without informing participants. If they responded based on the previous rule-set, they would make a categorization error and sort the object into the wrong bin. The feedback indicated which rule they were mistaken about when they made their decision. Throughout the 96 trials, there were eight “switch-trials” for every level in the rule hierarchy. On average, there were three “same-trials” between each switch-trial with a minimum of two and a maximum of eight. In addition to providing information about the currently active rules, the feedback screen also displayed the participant's current number of points which were eventually used to calculate bonus compensation. One natural method for awarding points, which we ultimately did not use, would add one point for each trial in which the decision corresponded with the rules and subtract a point for every decision which violated them. Instead, we chose to award a point whenever the participant responded in accordance with the last-known rules (i.e., the rules as indicated by the feedback screen on the previous trial). Points were deducted when the participant did not respond according to the last-known rules. This method of awarding points also ensured that participants did not try to anticipate when the rules would change. Crucially, this also allowed us to dissociate performance errors (in the sense that entails failure and negative affect) from prediction errors (which entail surprise). Thus rule changes lead to prediction errors and feedback that the response was incorrect, but such trials are not errors in the sense of failure to obtain reward. For these reasons, tasks switches may be thought of here as driven by prediction errors rather than performance errors. While the elements of the feedback screen already described provided enough information to determine that a rule had changed, we provided an additional cue in that the text showing the change in points (“+1” or “−1”) was orange instead of the green and red normally associated with earning and losing a point, respectively.
N. Zarr, J.W. Brown / NeuroImage 124 (2016) 238–247
How long to spend on the feedback screen was left up to the participants, and they advanced by pressing a button with their right middle finger. They then saw a black screen with a fixation cross for another jittered delay between 8 and 12 s before the next trial began with a shape appearing in the left bin. The trials were organized into 8-minute blocks to align with the scan sequence. At the beginning of each block there was a 20 second lead-in period where only a fixation cross was displayed. Because the trials were self-paced, it was not possible to use a predetermined lead-out period. The script determined when to begin the lead-out period based on how long the block had been underway and how long the participant was taking on average to complete a trial with the goal of making the delay last approximately 20 s. Because of the self-paced nature of the task, most participants completed all 96 trials within five blocks while three participants required six blocks. Prior to performance of the task in the scanner, participants performed a slightly modified task sitting at a computer. Before completing the set of 84 trials, participants completed a practice section that explained each rule individually and provided practice responding according that rule. At the end of the practice, the experimenter explained the rules of the task and participants were free to ask questions. Only participants who correctly utilized the last known rule 90% or more of the time were eligible for the fMRI portion of the study. fMRI acquisition and data preprocessing Imaging data were collected on a Siemens Magnetom Trio 3.0-Tesla MRI scanner and a 32-channel head coil. Foam padding was inserted around the sides of the head to increase participant comfort and reduce head motion. Imaging data was acquired at a 30° angle from the anterior commissure–posterior commissure line (Deichmann et al., 2003). Functional T2* weighted images were acquired using a gradient echo planar imaging sequence (30 × 3.8 mm interleaved slices; TE = 25 ms; TR = 2000 ms; flip angle = 70 °; 64 × 64 voxel matrix; 220 × 220 mm field of view). A structural scan was collected in each session using threedimensional MPRAGE imaging using a high-resolution T1-weighted imaging sequence, (TE = 2.67 ms; TR = 1800 ms; flip angle = 9°) with nonselective excitation consisting of 192 sagittal slices (512 × 448 grid, 1.0 × 1.0 × 1.0 mm voxels, 1-mm thickness, 256 × 256 mm field of view). Preprocessing was done using SPM5 (Wellcome Trust Centre for Neuroimaging, 2005), except where otherwise specified. The structural scan was skull-stripped using FSL's BET2 with default parameters (Péchaud et al., 2006). Functional data were spike-corrected on a voxel-by-voxel basis to reduce the impact of artifacts using AFNI's 3dDespike. The functional images were slice-timing corrected using sync interpolation (Oppenheim et al., 1999), motion corrected by means of a least-squares six-parameter rigid body, and coregistered with the structural scan. Once the structural scan was normalized to the SPM MNI template and the warps were applied to the functional data, the resulting normalized images were smoothed with an 8-mm3 full-width-at-half-maximum isotropic Gaussian kernel. fMRI analysis Event-related responses were estimated using a general linear model (GLM) with regressors for each event type convolved with a canonical hemodynamic response function. Eight regressors were used in the GLM. One regressor (CUE) modeled the initial presentation of the screen showing the object to be classified while two regressors (RESP_LEFT, RESP_RIGHT) modeled the left and right button responses that marked a decision. The remaining five regressors modeled different types of possible feedback. One regressor (FB_NOSWITCH) modeled the feedback occurring on a successful trial when no prediction error occurred whereas (FB_FAIL) modeled the feedback which occurred when participants did not follow the last previously known rules and
241
therefore lost a point. While these events were errors in the sense that participants lost a point, they were not the type of errors examined in our analysis. Finally, three regressors modeled the feedback provided when participants responded according to the previously known rules and the low, medium, or high level rules had changed (FB_LOWSWITCH, FB_MIDSWITCH, FB_HIGHSWITCH). Unless otherwise stated, all results were thresholded at the voxellevel at p b .001. Corrections for multiple comparisons were achieved by cluster-correction (p b 0.05 corrected) using SPM. Results Behavioral results Participants in the fMRI portion of the experiment completed the task with an overall accuracy of 96%. For these purposes a “correct” response is considered one that was made according to the last known rule set. After being presented with the object to be sorted, participants took 1.7 s on average (SD = 1.7 s) to make a decision. After a jittered delay, participants then saw the feedback screen which remained until they advanced, which took 2.7 s on average (SD = 3.3 s). fMRI results We first investigated whether the mPFC responded when any of the rules changed using the contrast specified by (FB_LOWSWITCH + FB_MIDSWITCH + FB_HIGHSWITCH) − FB_NOSWITCH. We found a large cluster in pre-SMA/dorsal ACC (MNI = 4, 22, 44; k = 656; Voxel-level threshold = p b .001; Peak z value = 6.03; p b .001; see Fig. 2), which is consistent with findings that ACC is routinely found to respond to feedback that is surprising (Jessup et al., 2010) and requires a change (O'Reilly et al., 2013). Our primary prediction was that activity in mPFC related to each of the individual prediction error types would form a gradient of abstraction such that more abstract prediction errors would be associated with activity in more anterior regions. To test this prediction, we generated independent contrasts for each prediction error type (e.g. FB_LOWSWITCH-FB_NOSWITCH; see Table 1). Despite some overlap, especially regarding the mid-level error cluster, the centers of mass of each of the clusters fell in exactly the predicted order (Fig. 3B). In particular, the high-level cluster appears substantially anterior to the lowlevel cluster (Fig. 3A). If this is indeed the case, the t-statistic values for the high-level switches should increase as one moves from posterior to anterior through the mPFC, while the t-statistic values for the lowlevel switches should decrease from posterior to anterior. To test this, we performed an analysis in which we first used the region identified as responding to switches generally (Fig. 2) as an ROI. Within that ROI, we extracted 17 adjacent coronal slices 2 mm (one voxel) wide in the Y dimension for the FB_LOWSWITCH–FB_NOSWITCH and FB_HIGHSWITCH–FB_NOSWITCH contrasts independently, for each subject. The data were analyzed in SPSS 22, with a two-way repeatedmeasures analysis of variance using the slice position along the sagittal axis and rule type as factors, and the mean t-statistic value for each slice as the data. Mauchly's test indicated that the assumption of sphericity was violated [χ2 (135) = 865.263, p b .001], and the Greenhouse– Geisser correction was therefore applied to the degrees of freedom. The corrected test revealed a significant interaction, [F (1.63, 27.748) = 3.66, p b .05]. To test whether the interaction took place in the expected direction, we created a high minus low curve for every participant by subtracting the low-error value from the high-error value at each slice. We expected that there would be an overall upward trend as the low-error activity drops off as we move anteriorly through the slices whereas the high-error activity should ramp up. A linear regression on these curves supports this prediction, [b = .11, t (304) = 5.86, p b .001], consistent with a rostro-caudal gradient of abstraction in mPFC (Fig. 2).
242
N. Zarr, J.W. Brown / NeuroImage 124 (2016) 238–247
A
B X=0
C
D
Fig. 2. Hierarchy of prediction error representations in mPFC. (A) Region of mPFC responding to all errors, cluster corrected to p b .05. (B) Low (green) and high (red) z maps for FB_LOWSWITCH-FB_NOSWITCH and FB_HIGHSWITCH-FB_NOSWITCH contrasts, with a visualization threshold z = 4. (C) Slice analysis ROI with every third slice shown. Only values inside the ROI were used in the analysis. (D) Second level t-statistics for the high and low error contrasts with standard error bars.
This understanding of the mPFC further predicts that the mid-level error cluster should lie in between the other two. We used the same approach to test this hypothesis as we used to test whether the high-level error cluster is generally anterior to the low-level error cluster. We first asked whether the mid-level error activity generally occurred anterior to the low-level error activity. A two-way repeated-measures analysis of variance revealed that activity associated with the mid-level error increased as one looks at successively more anterior slices while the low-level error decreased. Mauchly's test again showed the sphericity assumption to have been violated [χ2 (135) = 707.852, p b .001]. The interaction between slice number and rule type was significant after applying the Greenhouse–Geisser correction, [F (2.776, 47.195) = 8.917, p b .001]. We performed the same linear regression analysis here as described above which again validated our prediction [b = .08, t (304) = 4.8, p b .001]. However, when comparing the activity associated with the mid-level errors to that associated with the high-level errors, the interaction was not significant. Functional connectivity A primary motivation for the hypothesis that mPFC is organized in a rostro-caudal gradient of abstraction was the robust observation that LFC is arranged in this fashion. We hypothesized that if distinct rules at different levels of abstraction need to be simultaneously maintained and used to evaluate behavior, there should likewise be distinct regions in mPFC corresponding to prediction errors at each level of the rule hierarchy, which we observed. If this reasoning is correct, then anterior areas of mPFC should exhibit stronger functional connectivity to correspondingly anterior areas of LFC during task performance. To investigate this, we performed three seed-to-voxel functional connectivity analyses, using seeds identical to the significant clusters in mPFC which selectively responded to the modification of each rule. This was done with a simple GLM where the only regressor (apart
from head motion nuisance regressors) was the mean activation of the seed region at every time point. The results showed the degree of functional connectivity between the seed region and each voxel over the course of the entire experiment. We predicted that, for instance, the high-level-error mPFC seed would be more strongly correlated with more anterior regions of LFC than the low-level-error mPFC seed. To test this, we had to determine which LFC clusters were maximally connected to the seed regions associated with each rule. Because all of the seed regions were highly connected to large segments of LFC, a stringent voxel-wise threshold of p = .05 × 10−7 was used to pick out the maximally connected clusters. The gradient was particularly clear for the low and high error seeds (Fig. 3A). To more precisely determine whether the regions were ordered in the predicted fashion, we found the centers of mass of each of the observed clusters (see Table 2). As shown in Fig. 3B, the centers of each ROI corresponded to the predicted seed region in terms of their location on the rostro-caudal axis. These observations were statistically validated using the same slice analysis as the primary results in mPFC. The first step was to create two lateral ROIs in LFC which exhibited functional connectivity with error-related activity in mPFC in general (i.e., not specific to a particular rule) and then examine how functional connectivity to each of the three individual mPFC seeds changes as one moves from posterior to anterior through the neutral ROIs. To do this, a neutral seed region in mPFC was identified by fitting a GLM that used the same regressor for any rule switch and then implementing the same simple connectivity analysis for the neutral seed as was used for each of the three error-levelspecific seeds. Once again, a large region of medial and lateral frontal cortex was highly correlated with the seed region, necessitating a strict voxel-wise threshold of p = .01 × 10−6 in order to get distinct left and right LFC ROIs. The first-level functional connectivity t-statistic maps for each of the three error-specific seeds were masked with these neutral ROIs. By
N. Zarr, J.W. Brown / NeuroImage 124 (2016) 238–247
243
Table 1 Significant activation clusters for each of the error contrasts (e.g. FB_LOWSWITCH–FB_NOSWITCH). See Results section. Anatomical labels are derived from the Automated Anatomical Labeling Atlas in SPM5 (Tzourio-Mazoyer et al., 2002). MNI coordinates Region (TD)
X
Y
Z
Z-Score
Cluster corrected p-value
Cluster size
High-level error Pre-SMA Left inferior frontal gyrus Left midbrain Right lingual gyrus Right inferior frontal gyrus Left lingual gryus Left middle temporal gyrus Right middle temporal gyrus Right precuneus Left inferior frontal gryus Left pallidum Right midbrain Right insula Left insula Right pallidum Right inferior parietal lobule
2 −46 −4 18 40 −22 −58 62 8 −46 −12 8 32 −32 14 44
22 10 −32 −88 12 −86 −42 −38 −62 44 4 −26 22 20 2 −44
44 28 −6 −10 26 −16 0 −8 38 6 2 −14 −4 −4 0 44
5.23 5.22 5.09 5.01 4.89 4.80 4.79 4.46 4.44 4.10 3.88 3.77 3.76 3.65 3.62 3.56
b0.001 b0.001 b0.001 b0.001 b0.001 b0.001 b0.001 b0.001 b0.001 b0.001 b0.001 b0.001 b0.001 b0.001 b0.001 b0.001
790 1923 51 1650 1312 2038 202 162 2323 142 113 37 30 39 94 53
Medium-level error right inferior frontal gyrus Right cingulate gyrus/pre-SMA Left inferior frontal gyrus Right lingual gyrus Right inferior parietal lobule Left inferior parietal lobule Left cerebellum Left midbrain Left precuneus Right middle frontal gyrus Left middle temporal gyrus Left insula Right insula Left lentiform nucleus Right lentiform nucleus
38 6 −42 20 40 −40 −8 −8 −14 34 −62 −32 32 −10 18
12 16 14 −94 −52 −50 −78 −28 −70 60 −48 18 20 4 8
24 44 26 −10 44 40 −30 −8 34 6 −2 0 −4 −2 0
6.32 6.01 5.91 5.56 5.18 4.90 4.61 3.99 3.95 3.84 3.84 3.83 3.81 3.73 3.67
b0.001 b0.001 b0.001 b0.001 b0.001 b0.001 b0.001 0.002 0.002 b0.001 b0.001 b0.001 b0.001 b0.001 b0.001
2359 1043 2601 2049 1590 1144 164 124 187 41 40 60 74 62 54
Low-level error Right precentral gyrus Left pre-SMA Left precuneus Right calcarine gyrus Left fusiform gyrus Left middle frontal gyrus Right insula Right fusiform gyrus Right thalamus Left superior occipital gryus Left middle occipital gyrus Left pallidum Middle temporal gyrus Left insula Right caudate Left middle occipital gyrus Left middle occipital gyrus
44 −4 −10 20 −40 −26 32 36 8 −12 −30 −18 60 −28 10 −26 −26
6 8 −70 −90 −76 14 22 −52 −14 −94 −92 6 −36 18 2 −82 −76
34 54 36 −2 −16 56 0 −18 −2 8 12 −4 −10 −4 8 16 32
5.07 5.04 5.03 5.02 4.82 4.43 4.39 3.99 3.92 3.86 3.73 3.71 3.56 3.54 3.43 3.36 3.26
b0.001 b0.001 b0.001 b0.001 b0.001 b0.001 b0.001 0.002 0.002 b0.001 b0.001 b0.001 b0.001 b0.001 b0.001 b0.001 0.001
1508 832 2318 801 449 1203 146 23 37 327 51 55 12 38 15 22 12
analyzing the mean values for each coronal slice through the ROIs, we could determine how functional connectivity with each of the individual seeds changed as the slices moved from posterior to anterior. For each side of the brain, this yielded a data set with three factors, namely, MNI y-coordinate, t-statistic, and rule type. If the mPFC seed associated with high level rules is preferentially connected to more anterior LFC than the low-level seed, a two-way repeated-measures ANOVA should yield an interaction between the rule type and slice number since functional connectivity should increase from posterior to anterior for the highlevel rule seed and decrease for the low-level rule seed. All such interactions were observed (see Table 3). Discussion We investigated whether the mPFC was organized in a rostro-caudal gradient of abstraction by looking for activity related to three distinct
prediction error types in a task with a hierarchical rule set. The task dissociated between outcome and prediction errors, requiring that prediction errors be used to update maintained behavior-guiding rules. While the required updates were not told to subjects explicitly, they received enough information on every trial to deduce which rules needed to be updated and which specific rule values were currently in effect. Our task therefore sits at an intersection between error-monitoring and task-switching paradigms. Previous studies have shown that task switching (Allport et al., 1994; Jersild, 1927; Rogers and Monsell, 1995) involves different brain regions depending on the nature of what cues the task switch. In particular, when a new rule must be inferred or explored on the basis of an error or prediction error, then the mPFC is generally active (Bush et al., 2002; Procyk et al., 2000; Shima and Tanji, 1998). In contrast, when a new rule is explicitly communicated to the subjects, so that errors or prediction errors do not need to be evaluated, mPFC activity is
244
N. Zarr, J.W. Brown / NeuroImage 124 (2016) 238–247
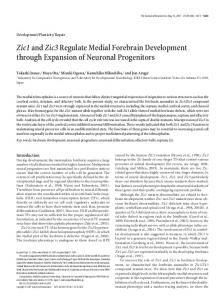
Fig. 3. Connectivity gradient between mPFC and dlPFC. (A) Overlaid z maps showing the functional connectivity patterns of the high (red) and low (green) mPFC seed regions. The inset plots show the average T statistic across participants for the functional connectivity between the rule-specific seed and the rule-neutral LFC ROI, moving from posterior to anterior (left to right). The results show that the anterior–posterior abstraction gradient topography is preserved in the functional connectivity between mPFC and lateral PFC. (B) The circles correspond to the center of mass of the rule-specific ROIs. The medial ROIs are the clusters which activated in response to a change in the corresponding rule. The lateral ROIs correspond to clusters which were functionally connected to these medial clusters. Red, blue, and green correspond to the high, medium, and low rules, respectively.
reduced (Bush et al., 2002), though not necessarily absent (Brass and von Cramon, 2002; Derrfuss et al., 2004). This indicates that the mPFC is most involved in task switching specifically when the switches are driven by errors or prediction errors rather than by explicit instruction (Walton et al., 2004). Our fMRI results show that the centroids of each of the three prediction-error-specific clusters in mPFC fell in exactly the predicted order, with the ‘low’ abstraction cluster the most posterior and the ‘high’ abstraction cluster the most anterior. The slice-based analyses partially confirmed our hypotheses, with prediction-error-related activity for the most abstract rule reliably anterior to error-related activity for the least abstract rule. Similarly, activity associated with low level prediction errors decreased from posterior to anterior within the mPFC while mid-level error activity increased (Fig. 2). Thus, we statistically validated two of the three predicted spatial relationships between the three clusters by looking at how the level of activation changed moving from posterior to anterior. These findings support and extend previous work investigating whether the mPFC is organized according to a rostro-caudal gradient of abstraction. Furthermore, they provide evidence that the mPFC responds in distinct ways to different types of prediction errors, with corresponding functional connections to task hierarchy representations in lateral PFC.
Table 2 Coordinates of the centers of mass of rule-specific ROIs. Medial ROIs are the clusters identified in the primary contrast analysis (e.g. ‘high’ is FB_HIGH-FB_SAME). Lateral ROIs are based on functional connectivity with the medial seed regions. Region
Right LFC Right LFC Right LFC Left LFC Left LFC Left LFC mPFC mPFC mPFC
Rule
High Mid Low High Mid Low High Mid Low
Multiple error signals The existence of multiple error signals in the brain has been investigated in the past. Logan and Crump (2010) found behavioral evidence for distinct error types in a typing task. The experimenters corrected errors typists made and inserted errors of their own in different locations. Participants believed that both the corrections and inserted errors were due to their own typing. However their typing speed decreased after corrected but not inserted errors, indicating that one error-detection process recognized the motor error even though that information was not available to a distinct error-detection process more closely connected to conscious awareness. Those results distinguish sensory vs. motor errors at the behavioral level, whereas our results distinguish higher vs. lower level prediction errors at the neural level. Krigolson and Holroyd (2006) and Krigolson et al. (2008) made a related distinction between “target errors” in which a perturbation in the environment results in the execution of an improper motor command and “outcome errors” in which the desired movement goal is not achieved. If a target moves after a reach is initiated, a target error is immediately present and if not corrected will result in an outcome error. Using event-related brain potential (ERP) data, they found evidence that target errors are processed within posterior parietal cortex (PPC) while outcome errors were mediated by a medial–frontal cortex. Essentially, Krigolson et al.'s results distinguish lower-level motor discrepancies vs. higher level failures. In that respect there is some similarity with our current hierarchical design, although our approach uses fMRI rather than EEG, and we found a hierarchy within the mPFC rather than results
MNI coordinates x
y
z
46 40 40 −44 −44 −38 0 2 −2
14 6 4 14 2 −2 22 16 10
30 40 42 28 36 46 44 46 48
Table 3 Two-way repeated-measures ANOVA results for each combination of rules on each side of the brain. Only the values associated with the slice by rule interaction are shown. Side
Rules
Rule × slice F
P value
Right Right Right Left Left Left
High vs low High vs mid Mid vs low High vs low High vs mid Mid vs low
F(13,221) = 42.888 F(13,221) = 39.166 F(13,221) = 19.599 F(20,340) = 37.018 F(20,340) = 30.375 F(20,340) = 18.075
b.001 b.001 b.001 b.001 b.001 b.001
N. Zarr, J.W. Brown / NeuroImage 124 (2016) 238–247
that span both mPFC and parietal regions. It is worth noting however that the errors investigated by Logan and Crump (2010) and Krigolson et al. (2008) involved the failure to achieve a goal. This is in contrast with our task, in which only prediction error was considered, which did not involve a loss of reward per se. Multiple error signals have also been observed in the ventral striatum (VS) during a hierarchical task (Diuk et al., 2013). While in the fMRI scanner, participants completed a task in which they had to pick a casino to play at as well as which slot machines to play within each casino. The authors used a hierarchical reinforcement learning model to generate regressors based on prediction error signals related to performance of the slot machines at the lower level and the casino at the higher level. Ventral striatum activity was correlated with prediction error at both the levels, indicating that VS processes both types of errors. Though our task both lacked the nested structure present in this study and dissociated between performance and prediction errors, we did observe overlapping error signals in VS for all three types of error (see Table 1). However, we also observed strong, spatially distinct mPFC responses to each error type whereas a whole brain analysis conducted by Diuk et al. (2013) revealed no mPFC regions associated with either of the prediction errors. To our knowledge, the existence of multiple error signals within the medial–frontal error processing system has not been directly investigated until now. Our results demonstrate that even if mPFC is only one component of an error-processing system among multiple such systems, it is capable of processing multiple distinct error signals which vary in their level of abstraction. How does the discovery of multiple error signals within mPFC fit with existing conceptual and computational models? One influential theory explains ACC function in terms of conflict monitoring (Botvinick et al., 2001; Kerns et al., 2004). On this view, the role of the ACC is to detect competing responses and adjudicate between them. The prediction-error-related mPFC regions we identified are not limited to the ACC, spanning portions of dACC and pre-SMA. However, the fact that portions of dACC were included places some tension on the notion that conflict monitoring fully accounts for ACC function since the errorrelated activity we detected occurred during a feedback period, in which no responses were required, and the next decision was at least 8 s away. In this respect, the results reported here argue in favor of a role for ACC in representing or detecting prediction errors per se (Kiehl et al., 2000) and against the idea that the ACC only responds when immediate corrective action is possible (Dahaene et al., 1994). However, it may be possible to integrate the error-related activity observed during the feedback period into a conflict monitoring account by arguing that cognitive actions, such as resetting the values of maintained rules, are treated similarly to motor actions (Fuster, 2006). In this case, the observation that the ruleset has changed would initiate a competition between various new rulesets for instantiation in working memory, instantiating a type of task switching. A theoretical framework which more naturally accommodates the observation of distinct error signals for different rules is the PRO model (Alexander and Brown, 2011). The PRO model characterizes the ACC as an action-outcome predictor, where one source of increased activity is the result of outcomes violating expectations, especially when expected outcomes fail to occur. Greater activation is also predicted when the expected results of multiple actions are being computed simultaneously, which accounts for many of the findings cited in support of the conflict monitoring account (Alexander and Brown, 2011; Jahn et al., 2014). Crucially, the predictions and error signals in the PRO model are represented as vectors rather than a scalar value like the degree of response conflict. This suggests, but does not necessarily require, that distinct components of a prediction error signal might be spatially discriminable, though there was little evidence for this claim when the PRO model was formulated. We found here that multiple prediction error signals are in fact spatially distinct in the ACC, an observation which is much easier to explain within a vector-based computational
245
account of anterior cingulate function rather than an account with error as a scalar quantity. An informationally rich prediction error signal also more naturally facilitates the observed role of mPFC in task switching (Derrfuss et al., 2005; Rushworth et al., 2002), since an intelligent shift in behavior generally requires knowledge about what went differently than expected rather than simply that something went differently than expected. Gradient of abstraction Our findings extend various studies that have shown a close relationship between medial and lateral PFC. It is well known that LFC is closely linked with mPFC, both in terms of anatomical connectivity (Barbas and Pandya, 1989; Medalla and Barbas, 2009) as well as functional connectivity (Margulies et al., 2007). In fact, both are important hubs of a network of brain regions known as the cognitive control network (Cole and Schneider, 2007). The role of the mPFC in monitoring ongoing performance while adjudicating between different motor and cognitive actions (e.g. storing some information in working memory), would seem to require close communication between medial and lateral frontal cortex. In fact, such interactions appear to play a critical role in some task switching paradigms (Ridderinkhof et al., 2004). Given that medial and lateral PFC are strongly connected, the next question is whether the two regions share a similar organizational structure, and especially a rostrocaudal gradient of abstraction. A similar organization between the two regions could support the simultaneous monitoring of multiple task rules maintained in distinct regions of LFC. Kouneiher et al. (2009) attempted to address this issue within the same information-theoretic framework utilized by Koechlin et al. (2003). They manipulated motivation at different temporal scales to detect a hierarchy of abstraction within mPFC, utilizing the sensitivity of mPFC to motivational demands (Bush et al., 2002). As predicted, they found that manipulations of motivation at the context level corresponded with activity in posterior mPFC while changing motivation at the higher episodic level was correlated with activity in mid mPFC. A very different approach was taken by Venkatraman et al. (2009) to investigate the presence of a gradient of abstraction in mPFC. Rather than the sensory-contextual-episodic hierarchy based on information theory (Koechlin et al., 2003; Kouneiher et al., 2009), they conceptualized the levels of the hierarchy as response, decision, and strategy. Their results revealed a similar gradient of abstraction in mPFC, and the dACC in particular, with strategy-related activity located anterior to decision-related activity in turn anterior to response-related activity. These two studies therefore provided initial evidence for a rostrocaudal gradient of abstraction in mPFC mirroring that present in LFC, utilizing the sensitivity of mPFC to motivation as well as to task difficulty. However, in order to claim that the rostro-caudal gradient of abstraction is as robust in mPFC as in LFC, the pattern should be apparent when focusing on a range of response properties of the mPFC. The present study is consistent with this domain generality: we demonstrate for the first time the existence of multiple, hierarchical prediction error signals within medial prefrontal cortex. The collective observation of such a hierarchy when manipulating such diverse factors as motivation, difficulty, and prediction error suggests that the rostro-caudal gradient of abstraction is a domain-neutral feature of mPFC organization. The debate regarding the nature of the rostro-caudal gradient of abstraction has focused on LFC since most of the evidence for its existence comes from this region. However, our results suggest that LFC and mPFC share an organizational structure. The nature of our task can therefore inform the discussion surrounding competing theories on the nature of this gradient. First, our findings put pressure on the theory that in fact there is no rostro-caudal gradient of abstraction and that purported evidence for such a gradient can be explained in terms of the taskimposed temporal dynamics of information maintenance (Reynolds et al., 2012). Because each of the rules in our task switched with an
246
N. Zarr, J.W. Brown / NeuroImage 124 (2016) 238–247
equal frequency, there was no difference on average between the durations of maintenance required for each of the three rules. For the same reason, our results would not be predicted by the information cascade model (Koechlin et al., 2003; Kouneiher et al., 2009) since it depends on a wholly temporal notion of abstraction such that information is abstract to the extent that it is integrated over a longer timescale. The fact that we observed distinct prediction error signals in the predicted rostro-caudal order is consistent with past work showing a stronger role for relational abstraction compared with temporal abstraction (Nee et al., 2014). Our findings also cannot be explained solely with a “nested contingency” notion of abstraction in which a more abstract cue informs the participant how to interpret lower level cues. Other modeling work has suggested a role of the basal ganglia in controlling inputs and outputs from LFC (Frank and Badre, 2012); our results are consistent with such proposals but do not require them.
Medial–lateral connectivity Given that mPFC and LFC interact heavily during task performance and that they share an organizational structure, a likely possibility is that more anterior regions of mPFC are preferentially connected to correspondingly anterior regions of LFC due to their shared utilization of information at the same level of abstraction. Taren et al. (2011) used the medial regions identified in Venkatraman et al. (2009) as seeds in a functional connectivity analysis to investigate this claim. They also specified a number of lateral seed regions including those identified by Koechlin et al. (2003). They then correlated the timeseries of each of the medial regions with each of the lateral regions, predicting that connectivity would be greatest between regions which were matched along the posterior-anterior axis. Though the gradient was not perfect, this prediction matched their results in the aggregate. Our findings provide additional support for this pattern of connectivity by demonstrating that each medial cluster associated with a specific prediction error was maximally connected to correspondingly anterior DLPFC (compare Fig. 3B with Taren et al. (2011) Fig. 3). While we only had three identified regions in each area compared to Taren et al.'s six, our results are somewhat stronger in that we did not specify lateral ROIs a priori, but instead examined connectivity within two wide error-type-neutral lateral ROIs and then found the centroids of each error-specific region. The functional connectivity between the mPFC and LFC also suggests a functional role. The inferior frontal junction (IFJ) has been shown to be involved in task switching and cognitive control (Brass et al., 2005; Derrfuss et al., 2005). Our results show prediction error effects in the region of the IFJ (Table 1). More to the point, the functionally connected LFC regions are also in the vicinity of the IFJ (Table 2). Thus, our results are consistent with specific prediction errors in the mPFC driving corresponding specific task set updates in the LFC, especially around the IFJ.
Limitations A possible complaint about the task utilized here is that participants do not need to constantly maintain all three relevant bits of information because the response is a one-bit decision. Once participants saw the rule information on the feedback screen they could compress their knowledge of the rules into a single bit decision strategy. For instance, if the high level rule is color and the top bin is associated with warm colors and the left index finger button, the participant could keep in mind “warm left, cool right” across the inter-trial interval (ITI). In fact, a debriefing survey administered after completion of the task revealed that 15 out of our 18 subjects utilized this strategy or a similar one. However, this is not problematic for the reported analyses based on error-related activity at the time of feedback. When the rules change, the participant must once again consider them all individually, determine which has changed, and assemble a new strategy.
Conclusion We have provided evidence both for multiple prediction error signals within mPFC as well as a rostro-caudal gradient of abstraction within mPFC. Furthermore, we observed a pattern of functional connectivity between mPFC and LFC that mirrored the gradient demonstrated in mPFC. This pattern of connectivity supports our explanation of the gradient observed in mPFC, namely that distinct rule representations maintained in LFC are monitored and evaluated simultaneously in correspondingly anterior regions of mPFC. The observation of a parallel structure between medial and lateral frontal cortex has important theoretical and modeling implications. It suggests that the cognitive control system is organized into distinct “modules” utilizing neural populations in both cortical areas to maintain and implement task set. These modules are organized along a rostrocaudal gradient of abstraction with rules that are less tied to concrete action represented in more anterior regions. This picture further reinforces the importance of using vector-based representations both of maintained task set and prediction error, and suggests a modeling framework in which multiple loops incorporating various cortical areas cooperate to produce appropriate behavior.
Acknowledgments This work was supported by the National Science Foundation under IGERT Grant Award #DGE-0903495 (NZ) and the Indiana METACyt Initiative of Indiana University, funded in part through a major grant from the Lilly Endowment, Inc. We thank S. Berry and K. McKinney for help with scanning.
References Alexander, W.H., Brown, J.W., 2011. Medial prefrontal cortex as an action-outcome predictor. Nat. Neurosci. 14, 1338–1344. http://dx.doi.org/10.1038/nn.2921. Alexander, W.H., Brown, J.W., 2014. A general role for medial prefrontal cortex in event prediction. Front. Comput. Neurosci. 8, 69. http://dx.doi.org/10.3389/fncom.2014. 00069. Allport, D.A., Styles, E.A., Hsieh, S., 1994. Shifting intentional set: exploring the dynamic control of tasks. In: Umilta, C., M.M. (Eds.), Attention and Performance 15: Conscious and Nonconscious Information Processing. MIT, Cambridge. Badre, D., D'Esposito, M., 2007. Functional magnetic resonance imaging evidence for a hierarchical organization of the prefrontal cortex. J. Cogn. Neurosci. 19, 2082–2099. http://dx.doi.org/10.1162/jocn.2007.19.12.2082. Badre, D., D'Esposito, M., 2009. Is the rostro-caudal axis of the frontal lobe hierarchical? Nat. Rev. Neurosci. 10, 659–669. http://dx.doi.org/10.1038/nrn2667. Baerends, G., 1976. The functional organization of behaviour. Anim. Behav. 24, 726–738. http://dx.doi.org/10.1016/S0003-3472(76)80002-4. Barbas, H., Pandya, D.N., 1989. Architecture and intrinsic connections of the prefrontal cortex i n the rhesus monkey. J. Comp. Neurol. 286, 353–375. Botvinick, M.M., 2008. Hierarchical models of behavior and prefrontal function. Trends Cogn. Sci. 12, 201–208. http://dx.doi.org/10.1016/j.tics.2008.02.009. Botvinick, M.M., Braver, T.S., Barch, D.M., Carter, C.S., Cohen, J.C., 2001. Conflict monitoring and cognitive control. Psychol. Rev. 108, 624–652. Botvinick, M.M., Niv, Y., Barto, A.C., 2009. Hierarchically organized behavior and its neural foundations: a reinforcement learning perspective. Cognition 113, 262–280. http://dx.doi.org/10.1016/j.cognition.2008.08.011. Brass, M., von Cramon, D.Y., 2002. The role of the frontal cortex in task preparation. Cereb. Cortex 12, 908–914. http://dx.doi.org/10.1093/cercor/12.9.908. Brass, M., Derrfuss, J., Forstmann, B., von Cramon, D.Y., 2005. The role of the inferior frontal junction area in cognitive control. Trends Cogn. Sci. 9, 314–316. http://dx. doi.org/10.1016/j.tics.2005.05.001 (S1364-6613(05)00138-5 [pii]). Bush, G., Vogt, B.A., Holmes, J., Dale, A.M., Greve, D., Jenike, M.A., Rosen, B.R., 2002. Dorsal anterior cingulate cortex: a role in reward-based decision making. Proc. Natl. Acad. Sci. U. S. A. 99, 523–528. http://dx.doi.org/10.1073/pnas.012470999. Carter, C.S., Braver, T.S., Barch, D.M., Botvinick, M.M., Noll, D.C., Cohen, J.D., 1998. Anterior cingulate cortex, error detection, and the online monitoring of performance. Science 280, 747–749. Christoff, K., Keramatian, K., Gordon, A.M., Smith, R., Mädler, B., 2009. Prefrontal organization of cognitive control according to levels of abstraction. Brain Res. 1286, 94–105. http://dx.doi.org/10.1016/j.brainres.2009.05.096. Cole, M.W., Schneider, W., 2007. The cognitive control network: Integrated cortical regions with dissociable functions. Neuroimage 37, 343–360. http://dx.doi.org/10. 1016/j.neuroimage.2007.03.071. Cooper, R., Shallice, T., 2000. Contention scheduling and the control of routine activities. Cogn. Neuropsychol. 17, 297–338. http://dx.doi.org/10.1080/026432900380427.
N. Zarr, J.W. Brown / NeuroImage 124 (2016) 238–247 Crittenden, B.M., Duncan, J., 2012. Task difficulty manipulation reveals multiple demand activity but no frontal lobe hierarchy. Cereb. Cortex http://dx.doi.org/10.1093/ cercor/bhs333. Dahaene, S., Posner, M.I., Tucker, D.M., 1994. Localization of a neural system for error detection and compensation. Psychol. Sci. 5, 303–305. Debener, S., Ullsperger, M., Siegel, M., Fiehler, K., von Cramon, D.Y., Engel, A.K., 2005. Trialby-trial coupling of concurrent electroencephalogram and functional magnetic resonance imaging identifies the dynamics of performance monitoring. J. Neurosci. 25, 11730–11737. http://dx.doi.org/10.1523/JNEUROSCI.3286-05.2005. Deichmann, R., Gottfried, J.A., Hutton, C., Turner, R., 2003. Optimized EPI for fMRI studies of the orbitofrontal cortex. Neuroimage 19, 430–441. Derrfuss, J., Brass, M., Yves Von Cramon, D., 2004. Cognitive control in the posterior frontolateral cortex: evidence from common activations in task coordination, interference control, and working memory. Neuroimage 23, 604–612. http://dx.doi.org/ 10.1016/j.neuroimage.2004.06.007. Derrfuss, J., Brass, M., Neumann, J., von Cramon, D.Y., 2005. Involvement of the inferior frontal junction in cognitive control: meta-analyses of switching and Stroop studies. Hum. Brain Mapp. 25, 22–34. http://dx.doi.org/10.1002/hbm.20127. Diuk, C., Tsai, K., Wallis, J., Botvinick, M., Niv, Y., 2013. Hierarchical learning induces two simultaneous, but separable, prediction errors in human basal ganglia. J. Neurosci. 33, 5797–5805. http://dx.doi.org/10.1523/JNEUROSCI.5445-12.2013. Egner, T., 2009. Prefrontal cortex and cognitive control: motivating functional hierarchies. Nat. Neurosci. 12, 821–822. http://dx.doi.org/10.1038/nn0709-821 (nn0709-821 [pii]). Falkenstein, M., Hohnsbein, J., Hoormann, J., 1990. Effects of errors in choice reaction tasks on the ERP under focused and divided attention. Psychol. Brain Res. 1, 192–195. Ferdinand, N.K., Mecklinger, A., Kray, J., Gehring, W.J., 2012. The processing of unexpected positive response outcomes in the mediofrontal cortex. J. Neurosci. http://dx.doi.org/ 10.1523/JNEUROSCI.1410-12.2012. Frank, M.J., Badre, D., 2012. Mechanisms of hierarchical reinforcement learning in corticostriatal circuits 1: computational analysis. Cereb. Cortex 22, 509–526. http:// dx.doi.org/10.1093/cercor/bhr114. Fuster, J.M., 2006. The cognit: a network model of cortical representation. Int. J. Psychophysiol. 60, 125–132. http://dx.doi.org/10.1016/j.ijpsycho.2005.12.015. Garofalo, S., Maier, M.E., di Pellegrino, G., 2014. Mediofrontal negativity signals unexpected omission of aversive events. Sci. Rep. 4, 4816. http://dx.doi.org/10.1038/ srep04816. Gehring, W.J., Coles, M.G.H., Meyer, D.E., Donchin, E., 1990. The error-related negativity: an event-related brain potential accompanying errors. Psychophysiology 27, S34. Gemba, H., Sasaki, K., Brooks, V.B., 1986. ‘Error’ potentials in limbic cortex (anterior cingulate area 24) of monkeys during motor learning. Neurosci. Lett. 70, 223–227. Holroyd, C.B., Coles, M.G., 2002. The neural basis of human error processing: reinforcement learning, dopamine, and the error-related negativity. Psychol. Rev. 109, 679–709. Jahn, A., Nee, D.E., Alexander, W.H., Brown, J.W., 2014. Distinct regions of anterior cingulate cortex signal prediction and outcome evaluation. Neuroimage http://dx. doi.org/10.1016/j.neuroimage.2014.03.050. Jersild, A.T., 1927. Mental set and shift. Arch. Psychol. 81. Jessup, R.K., Busemeyer, J.R., Brown, J.W., 2010. Error effects in anterior cingulate cortex reverse when error likelihood is high. J. Neurosci. 30, 3467–3472. http://dx.doi.org/ 10.1523/JNEUROSCI.4130-09.2010. Kerns, J.G., Cohen, J.D., MacDonald III, A.W., Cho, R.Y., Stenger, V.A., Carter, C.S., 2004. Anterior cingulate conflict monitoring and adjustments in control. Science 303, 1023–1026. Kiehl, K.A., Liddle, P.F., Hopfinger, J.B., 2000. Error processing and the rostral anterior cingulate: an event-related fMRI study. Psychophysiology 37, 216–223. Koechlin, E., Ody, C., Kouneiher, F., 2003. The architecture of cognitive control in the human prefrontal cortex. Science 302, 1181–1185. http://dx.doi.org/10.1126/ science.1088545 (302/5648/1181 [pii]). Kouneiher, F., Charron, S., Koechlin, E., 2009. Motivation and cognitive control in the human prefrontal cortex. Nat. Neurosci. 12, 939–945. http://dx.doi.org/10.1038/nn. 2321 (nn.2321 [pii]). Krigolson, O.E., Holroyd, C.B., 2006. Evidence for hierarchical error processing in the human brain. Neuroscience 137, 13–17. http://dx.doi.org/10.1016/j.neuroscience. 2005.10.064. Krigolson, O.E., Holroyd, C.B., Van Gyn, G., Heath, M., 2008. Electroencephalographic correlates of target and outcome errors. Exp. Brain Res. 190, 401–411. http://dx.doi.org/ 10.1007/s00221-008-1482-x. Lashley, K.S., 1951. The problem off serial order in behavior. In: Jeffress, L.A. (Ed.), Cerebral Mechanisms in Behavior. Wiley, New York, pp. 112–131.
247
Logan, G.D., Crump, M.J.C., 2010. Cognitive illusions of authorship reveal hierarchical error detection in skilled typists. Science 330, 683–686. Margulies, D.S., Kelly, A.M.C., Uddin, L.Q., Biswal, B.B., Castellanos, F.X., Milham, M.P., 2007. Mapping the functional connectivity of anterior cingulate cortex. Neuroimage 37, 579–588. http://dx.doi.org/10.1016/j.neuroimage.2007.05.019. Mathôt, S., Schreij, D., Theeuwes, J., 2012. OpenSesame: an open-source, graphical experiment builder for the social sciences. Behav. Res. Methods 44, 314–324. http://dx.doi. org/10.3758/s13428-011-0168-7. Medalla, M., Barbas, H., 2009. Synapses with inhibitory neurons differentiate anterior cingulate from dorsolateral prefrontal pathways associated with cognitive control. Neuron 61, 609–620. http://dx.doi.org/10.1016/j.neuron.2009.01.006 (S08966273(09)00045-2 [pii]). Miller, G., Galanter, E., Pribram, K.H., 1960. Plans and the Structure of Behavior. Holt, Rinehart and Winston, Inc., New York. Nee, D.E., Brown, J.W., 2012. Rostral–caudal gradients of abstraction revealed by multivariate pattern analysis of working memory. Neuroimage 63, 1285–1294. http://dx. doi.org/10.1016/j.neuroimage.2012.08.034. Nee, D.E., Jahn, A., Brown, J.W., 2014. Prefrontal cortex organization: dissociating effects of temporal abstraction, relational abstraction, and integration with fMRI. Cereb. Cortex http://dx.doi.org/10.1093/cercor/bht091. Niki, H., Watanabe, M., 1979. Prefrontal and cingulate unit activity during timing behavior in the monkey. Brain Res. 171, 213–224. O'Reilly, J.X., Schüffelgen, U., Cuell, S.F., Behrens, T.E.J., Mars, R.B., Rushworth, M.F.S., 2013. Dissociable effects of surprise and model update in parietal and anterior cingulate cortex. Proc. Natl. Acad. Sci. U. S. A. 110, E3660–E3669. http://dx.doi.org/10.1073/ pnas.1305373110. Oliveira, F.T.P., McDonald, J.J., Goodman, D., 2007. Performance monitoring in the anterior cingulate is not all error related: expectancy deviation and the representation of action-outcome associations. J. Cogn. Neurosci. 19, 1994–2004. http://dx.doi.org/10. 1162/jocn.2007.91208. Oppenheim, A.V., Shafer, R.W., Buck, J.R., 1999. Discrete Time-Signal Processing. Prentice Hall, Upper Saddle River, NJ. Péchaud, M., Jenkinson, M., Smith, S., 2006. Brain Extraction Tool (BET) (Version 2) [Computer software]. Oxford University Centre for Functional MRI of the Brain. Oxford, UK. Procyk, E., Tanaka, Y.L., Joseph, J.P., 2000. Anterior ingulate activity during routine and non-routine sequential behaiors in macaques. Nat. Neurosci. 3, 502–508. Reynolds, J.R., O'Reilly, R.C., Cohen, J.D., Braver, T.S., 2012. The function and organization of lateral prefrontal cortex: a test of competing hypotheses. PLoS One 7, e30284. http://dx.doi.org/10.1371/journal.pone.0030284. Ridderinkhof, K.R., Ullsperger, M., Crone, E.A., Nieuwenhuis, S., 2004. The role of the medial frontal cortex in cognitive control. Science 306, 443–447. Rogers, R.D., Monsell, S., 1995. Costs of a predictable switch between simple cognitive tasks. J. Exp. Psychol. Gen. 124, 207–231. Rushworth, M.F.S., Hadland, K. a, Paus, T., Sipila, P.K., 2002. Role of the human medial frontal cortex in task switching: a combined fMRI and TMS study. J. … 87, 2577–2592. doi:DOI 10.1152/jn.00812.2001 Shima, K., Tanji, J., 1998. Role for cingulate motor area cells in voluntary movement selection based on reward. Science 282, 1335–1338. http://dx.doi.org/10.1126/science. 282.5392.1335. Taren, A.A., Venkatraman, V., Huettel, S.A., 2011. A parallel functional topography between medial and lateral prefrontal cortex: evidence and implications for cognitive control. J. Neurosci. 31, 5026–5031. http://dx.doi.org/10.1523/JNEUROSCI.5762-10. 2011. Tzourio-Mazoyer, N., Landeau, B., Papathanassiou, D., Crivello, F., Etard, O., Delcroix, N., Mazoyer, B., Joliot, M., 2002. Automated anatomical labeling of activations in SPM using a macroscopic anatomical parcellation of the MNI MRI single-subject brain. Neuroimage 15, 273–289. http://dx.doi.org/10.1006/nimg.2001.0978. Venkatraman, V., Rosati, A.G., Taren, A.A., Huettel, S.A., 2009. Resolving response, decision, and strategic control: evidence for a functional topography in dorsomedial prefrontal cortex. J. Neurosci. 29, 13158–13164. http://dx.doi.org/10.1523/JNEUROSCI.2708-09. 2009. Walton, M.E., Devlin, J.T., Rushworth, M.F., 2004. Interactions between decision making and performance monitoring within prefrontal cortex. Nat. Neurosci. 7, 1259–1265. Wessel, J.R., Danielmeier, C., Morton, J.B., Ullsperger, M., 2012. Surprise and error: common neuronal architecture for the processing of errors and novelty. J. Neurosci. 32, 7528–7537. http://dx.doi.org/10.1523/JNEUROSCI.6352-11.2012.