© 2013 IEEE. Personal use of this material is permitted. Permission from IEEE must be obtained for all other uses, in any current or future media, including reprinting/republishing this material for advertising or promotional purposes, creating new collective works, for resale or redistribution to servers or lists, or reuse of any copyrighted component of this work in other works. DOI 10.1109/ICPP.2013.115
Hierarchical Memory Buffering Techniques for an In-Memory Event Tracing Extension to the Open Trace Format 2 Michael Wagner, Andreas Kn¨upfer and Wolfgang E. Nagel Center for Information Services and High Performance Computing (ZIH) Technische Universit¨at Dresden 01062 Dresden, Germany Email:
[email protected] Abstract—One of the most urgent challenges in event based performance analysis is the enormous amount of collected data. A real-time event reduction is crucial to enable a complete inmemory event tracing workflow, which circumvents the limitations of current parallel file systems to support event tracing on large scale systems. However, a traditional single flat memory buffer fails to support real-time event reduction. To address this issue, we present a hierarchical memory buffer, which is capable to support event reduction. We show that this hierarchical memory buffer does not introduce additional overhead, regardless of the grade of reduction. In addition, we evaluate its main parameter: the size of the internal memory bins. The hierarchical memory buffer is based on the Open Trace Format 2, a state-ofthe-art Open Source event trace library used by the performance analysis tools VAMPIR, SCALASCA, and TAU.
I.
I NTRODUCTION
High performance computing (HPC) systems are getting more and more powerful but also more and more complex. They consist of a large number of heterogeneous processing elements such as different CPUs and GPUs. Building on these architectures there are a number of different parallel programming models like MPI, OpenMP, PGAS, or OpenCL. Hence, appropriate supporting tools are essential to develop applications that utilize the enormous capabilities of current HPC systems. Performance analysis tools are one important part of today’s HPC software landscape. They greatly benefit developers not only in optimizing their applications but also in understanding their behavior on complex heterogeneous systems. The two main approaches are profiling and event tracing. While profiling gathers summarized information about different performance metrics, event tracing records runtime events together with a precise time stamp and further event specific metrics. Event tracing delivers most detailed information allowing a profound post-mortem analysis of the parallel behavior. But, this comes with the cost of very large data volumes. Handling such a tremendous amount of data has always been a challenge in event tracing and is getting even more demanding with the rapid increase of processing elements. Since, the collected data it traditionally stored in one file per processing element, in particular, the rising number of resulting event trace files is one of the most urgent challenges. The limits of current
parallel file systems allow handling only about ten or twenty thousand of parallel processes without any special treatment. There are already two approaches that help to circumvent these file system limitations and can handle hundreds and thousands of processing elements [1], [2] (see Section II). However, both approaches are currently limited to a subset of systems and applications and, moreover, it is not clear whether these approaches will also be sufficient for exa-scale systems with tens or even hundreds of millions of cores. Another way to circumvent current file system limitations is by completely omitting file system interaction. Keeping recorded data in main memory for the complete workflow from measurement to analysis would not only bypass the limitations in the number of file handles, moreover, it would eliminate the overhead of file creation, writing and reading altogether. Furthermore, an in-memory workflow would exclude the bias caused by non-synchronous intermediate memory buffer flushes during a measurement run. Whenever a memory buffer is exhausted, the content is stored in the trace file. This leads to a noticeable disruption of the application. Since each processing element records different events or at least events with different parameters (e.g. time stamps), each buffer is flushed at a different time, which leads to a falsification of the recorded program behavior. Much like system noise this effect increases with higher scales [3]. In addition, this approach would open up new ways for event tracing. Two new possibilities are light-weight tracing and interactive event tracing. With the option to keep all recorded data in main memory a lightweight tracing component can be included in applications. Without file system interaction this would generate much less overhead in comparison to traditional event tracing. Only when desired, this data can then be analyzed by connecting an analysis tool to the light-weight tracing component. The second, interactive event tracing, is our longterm goal. This approach would provide faster feedback from the measurement: a measurement could start with a specified set of tracing parameters and be paused at any point. Then, the developer gets a first insight into the application behavior and can decide how to go on: delete unnecessary parts of the measurement, modify the level of detail, or maybe start over because the application is running on a wrong data set. This is just a small glimpse; much more can be done based on this approach (see [4]). But there is one catch: to keep data in main memory
© 2013 IEEE. Personal use of this material is permitted. Permission from IEEE must be obtained for all other uses, in any current or future media, including reprinting/republishing this material for advertising or promotional purposes, creating new collective works, for resale or redistribution to servers or lists, or reuse of any copyrighted component of this work in other works. DOI 10.1109/ICPP.2013.115
for the complete workflow, it is necessary that the recorded data fits into a single memory buffer of an event tracing library such as OTF2 [5]. Unfortunately, measurement runs may collect hundreds of megabytes up to gigabytes of data per processing element. To make things worse, the part of the main memory that is left to store the data is rather small, since most applications utilize main memory quite well. In this way, the challenge is to fit all data into a single memory buffer of fixed size. In our opinion, a strategy to achieve this needs to combine three major steps. First of all, a combination of high-level filters, phase based selection and user defined filters to sort out superfluous events and focus on the significant events; of course, this is not a trivial task. Second, the data needs to be stored in an efficient way inside the recording buffer. In this respect, recorded events need to be encoded very tight. In [4] we showed how to increase encoding efficiency by factor up to 5.8 without increasing the overhead of the event tracing library. The first two steps can notably reduce run-time memory allocation. Yet, they fail the by far most important criterion for an in-memory workflow; they cannot guarantee that the recorded data fits into a single memory buffer. Consequently, the third and last step is entirely different from the first two. It is triggered anytime the memory buffer is exhausted; typically this is the point where the memory buffer is either flushed to a file or the measurement is aborted. The crucial point is making memory space available again by reducing the events stored in the memory buffer. In [6] we showed techniques how this can be done and called this last step real-time event reduction. In this context, real-time means that the event reduction must be very efficient to minimize overhead and, therefore, the bias on the measurement. In [6] we also pointed out that traditional memory buffering with one single memory buffer like in OTF or EPILOG [7], [8] is not capable to support these event reduction techniques. However, in this paper we will show that it is possible to construct a memory buffer that is capable to support real-time event reduction. In contrast to a static flat memory buffer, we propose a hierarchical memory buffer. The hierarchical memory buffer as well as the event reduction strategies and other optimizations like enhanced encoding techniques [4] are components of the In-Memory Event Tracing Extension to the Open Trace Format 2, called OTFX. Although the main purpose of the hierarchical memory buffer is to support real-time event reduction and, therefore, is closely connected with the topic of real-time event reduction, the focus of this paper is the hierarchical memory buffer itself. The background for real-time event reduction and the different strategies to enable it are discussed in detail in [6]. Our contribution in this paper is a novel hierarchical memory buffer that is capable to support event reduction with minimal overhead, regardless of the grade of reduction. We discuss the techniques to realize such a hierarchical memory buffer in detail in Section III. In addition, we evaluate the introduced overhead in time and memory allocation in Section IV. Furthermore, we give an outlook on our future work in Section V and summarize the presented work in Section VI. But first, in the following section we distinguish our work from other current approaches.
II.
R ELATED W ORK
Event trace data formats are often coupled with the different performance recording and analysis tools. For instance, the EPILOG Trace Format used by Scalasca and the Paraver Trace File Format used by the Paraver Trace visualizer [8]. Next to that, the Open Trace Format (OTF) was the first format developed with interoperability in mind. It is used by the Vampir tool-set, the TAU tool-set, and the Microsoft HPC Server built-in MPI trace collection layer, among others [7], [9], [10]. The successor of OTF, the Open Trace Format 2, was targeted to support even more tools [5]. It is jointly developed by Technische Universit¨at Dresden (Germany), the J¨ulich Supercomputing Centre (Germany), the German Research School for Simulation Sciences Aachen (Germany), Technische Universit¨at M¨unchen (Germany), University of Oregon (USA), and RWTH Aachen University (Germany). It is part of Score-P, a software infrastructure for instrumentation and run-time recording, and will become the common native event trace format for VAMPIR, SCALASCA, and TAU [11], [12]. Whereas most trace formats were only used to store data in the file system, the Open Trace Format 2 also provides the runtime in-memory buffer liberating the measurement tools to take care of it. Since OTF2 contains the memory buffer management itself, optimizations like the hierarchical memory buffer can be applied transparently without demanding changes to the tools using it. Although there are a number of different trace formats, the fundamental workings and information covered are more or less the same. Therefore, the presented approach is a general one, even though demonstrated with the Open Trace Format 2 here. Writing one file per processing elements (e.g. check points or result files) does not scale to large systems since the sheer number of files overcharges the capabilities of today’s file system meta data servers. Two approaches that are dealing with the file system limitations and are applied to event tracing are SIONlib and the I/O Forwarding Scalability Layer (IOFSL) [1], [2]. Both approaches try to merge many logical files into a single or a few physical files. While SIONlib relies on the file system’s capability to handle large sparse files to pre-allocate segments for the logical file handles within a single file, the I/O Forwarding and Scalability layer, as the name suggests, provides an I/O forwarding layer to offload I/O requests to dedicated I/O servers that can aggregate and merge requests before passing them to the actual file system. Both approaches are currently limited to a subset of systems and applications. Llort et al. are also working on an online trace reduction to reduce the amount of trace data [13]. The data reduction is based on an data aggregation over all processes with MRNet [14]. Although, this approach seems to deliver quite promising results, to our knowledge, it is not possible to reduce data to a fixed size, which is crucial for in-memory event tracing. In addition, it is not clear to us, how this aggregation to a single analysis front end that computes the data reduction will apply to large scale systems. Nevertheless, it may serve as a filtering technique in step one (see Section I). To the best of our knowledge, there are no event tracing approaches that implement efficient hierarchical memory buffers.
III.
H IERARCHICAL B UFFERING T ECHNIQUES
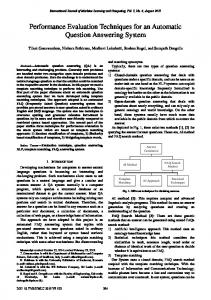
The main purpose of our hierarchical memory buffering approach is to support real-time event reduction. In Section I we argued that these techniques are fundamental to enable an in-memory tracing workflow. For these event reduction techniques, for instance a selective reduction according to call stack level [6], traditional single memory buffering is not sufficient. Out of the different strategies presented in [6] the selective event reduction by call stack level is the most complex to realize. Thus, we focus on the selective event reduction by call stack level to demonstrate the capabilities of the hierarchical memory buffer. The different real-time event reduction strategies themselves are discussed in detail in [6]. Event reduction by call stack level means that when the memory buffer is exhausted and event reduction initiated, all events of the deepest call stack level (i.e. the biggest calling context depth) need to be discarded. In traditional single memory buffering the data from all call stack levels is intermingled. This would require scanning the complete memory buffer for these events, discarding them, and marking these memory sections as free. Since events occur at a high frequency and are typically only a few bytes small, there are plenty of small free sections scattered over the whole memory buffer. To gain a continuous free memory section at the end, the remaining non-free memory sections must be collapsed to one memory section, resulting in numerous small memory moves (see Figure 1). It is obvious, that this approach is extremely expensive and can most certainly not be applied for real-time event reduction. a
b
c
d
Static Memory Buffer Trace Data
Static Memory Buffer Trace Data
Static Memory Buffer Trace Data
Static Memory Buffer Trace Data
Fig. 1. Event reduction with a static flat memory buffer: a) Collecting events; buffer is about half full. b) The memory buffer is filled and scanned for all events of the deepest call stack level. c) The memory sections are marked as free. d) The remaining non-free memory is collapsed to one memory section. This provides a continuous free memory section at the end to store new events.
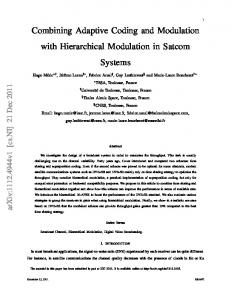
In contrast to such a static flat memory buffer, we propose a hierarchical memory buffer. Instead of one huge memory chunk, a hierarchical memory buffer consists of plenty of small memory sections; called memory bins (in Section IV we will further evaluate what small in this context means). In the following we focus on the event reduction by call stack level, since it is most complex to realize. Nevertheless, the other techniques can be realized accordingly. A real-time call stack reduction is only possible if all events are sorted according to
their call stack level. To realize this pre-sorting, the hierarchical memory buffer can be organized as a one-dimensional array; each entry representing one call stack level. The memory bins can then, on demand, be assigned to these call stack levels. This can be done anytime an event needs to be written to a certain call stack level and there is either no memory bin assigned to this level or the current memory bin is full. For instance, when the first event, usually on call stack level one, needs to be written, there has been no memory bin assigned to this call stack level so far. Thus, the hierarchical memory buffer checks if there is a free memory bin available, which is true in our case, and one memory bin is assigned to the call stack level one, so the event can be written. If at some point, an event needs to be written but the current memory bin is full, the hierarchical memory buffer checks again if there is a free memory bin available and another memory bin is assigned to the call stack level. When a new memory bin is requested by one of the above two scenarios but there is no free memory bin available, the event reduction is triggered. In the following example, we like to demonstrate the event reduction in combination with the hierarchical memory buffer in detail. There have been events written to the levels L1 - L3 and five memory bins have been assigned; four are free; as can be seen in Figure 2a. So, four more memory bins can be assigned. After that, all memory bins are assigned and there are no free memory bins available anymore. This leads to the situation in Figure 2b: An event needs to be written on call stack level two but there are no free memory bins available. At this point, the call stack level reduction is triggered and all events of the deepest call stack level (in this case level three) are discarded. Since, all events are stored separately according to their call stack level, this can be done very easily. It is just necessary to revoke all memory bins from level three. In addition, call stack level three is permanently marked as closed. So, all future events on this level are discarded right away. The two revoked memory bins are now available again (see Figure 2c). Thus, one of them can be assigned to call stack level two and the event that triggered the reduction can be written (see Figure 2d). Next to the layout as one-dimensional array as for the described call stack reduction, the hierarchical memory buffer can also be organized as a multi-dimensional array. For instance, a second dimension could represent the event class, e.g. separately group function call events, MPI events, hardware performance counters etc. each with its own call stack dimension. This way the hierarchical memory buffer also supports a multi-dimensional event reduction as proposed in [6] and very likely additional upcoming strategies. In the following section, we will evaluate the hierarchical memory buffer and show that is capable to support real-time event reduction; our primary goal. IV.
E VALUATION
Besides scalability and usability, memory consumption and the introduced runtime overhead are the most prominent criteria to evaluate an event tracing library. Since the presented hierarchical memory buffering techniques only influence the internal per process/thread memory representation, they will not impact OTF2’s usability or scalability. However, hierarchi-
Dynamic Memory Buffer
Memory Bins
L1 a
L2 L3
Dynamic Memory Buffer
Memory Bins
L1 b
L2 L3
Dynamic Memory Buffer
Memory Bins
L1 c
L2 L3
Dynamic Memory Buffer
Memory Bins
L1 d
L2 L3
Fig. 2. Event reduction with a hierarchical memory buffer: a) Collecting events; buffer is about half full; anytime a memory bin is full a free one is assigned. b) Current memory bin on call stack level two is filled and there are no memory bins left; all events of the deepest call stack level (in this case level three) are grouped together. c) All memory bins assigned to level three are revoked; events are automatically discarded. d) One of the free memory bins is assigned to level two to store new events.
cal memory buffering will affect the consumed memory and runtime overhead. The dominant parameter influencing these two criteria is the size of the single memory bins. Therefore, first and foremost, it is important to find an ideal size for the memory bins. On the one hand, memory efficiency decreases with bigger memory bins because the memory bins may often be not fully utilized, e.g. writing only a few events to each call stack level will result in a much bigger total memory allocation for bigger memory bins than for small ones since each way there is one memory bin allocated for each call stack level. Moreover, in a multi-dimensional layout of the buffer a lot of memory bins are necessary to distribute at least one memory bin to each needed call stack level, each event class etc. Otherwise, reduction is triggered way to early because the hierarchical memory buffer runs out of memory bins not because memory is exhausted. Therefore, it is desirable to keep the size of the memory bins as small as possible. On the other hand, with smaller memory bins, the overhead introduced by managing the memory bins is expected to increase, since there are just more memory bins to allocate and operate. Evaluating pure writing performance with real-life applications is virtually impossible since it is not possible to distin-
guish between effects caused by the measurement environment and effects caused by the event tracing library like OTF2 or in this case OTFX. Therefore, generated event patterns are used to exclude the bias of a measurement environment. But, to achieve a more realistic event sequence a parameter subset (e.g. time stamps) of the SPEC MPI 2007 benchmark 104.milc [15] is used. The first benchmark is designed to find that sweet spot between low memory allocation and low management overhead. It measures time as well as total memory allocation for different memory bin sizes; ranging from 32 byte to 1 megabyte. The benchmark writes ten million events equally to one hundred call stack levels by looping over a simple pattern: one hundred enter events followed by one hundred leave events. This results in approx. 33 MB of data in total, i.e. approx. 300 to 350 kB of data per call stack level. Since a parameter sequence of a benchmark is used, the data sizes within the call stack levels vary. Figure 3 depicts the results of the first benchmark. The runtime to write all events is represented with the left bars (dark blue) and values are shown on the left vertical axis. The right bars (light blue) represent the total memory allocation for all used memory bins; values are shown on the right vertical axis. The last bar (and the dashed line) shows the pure memory allocation for the events without any memory overhead caused by the memory bins. Despite expectations, the overhead introduced by managing smaller and, therefore, more memory bins is not steadily increasing. On the contrary, the overhead is slightly decreasing from the size of 1 MB down to 1 kB. For smaller sizes beginning from 512 to 32 byte the overhead is rapidly increasing. Nonetheless, the memory efficiency shows an expected behavior. The total memory allocation drops steeply from 1 MB to 32 kB; with a plateau to 512 byte. For smaller memory bins the total memory allocation rises again. Since events are not split across multiple memory bins, there are always a number of bytes lost at the end of each memory bin depending on the placement of the events, e.g. if an event needs 8 bytes to be stored but there are only 7 bytes left, the event is stored in the next memory bin and the 7 remaining bytes stay free. Thus, with memory bins getting smaller the utilization of the complete memory of each bin declines and, therefore, total memory allocation rises. From Figure 3 it can be inferred that in the range of 1 kB to 8 kB the memory allocation as well as the management overhead is minimized. However, the main goal is to use very small memory bins to provide many memory bins to the hierarchical memory buffer, in particular, in a multidimensional layout of the hierarchical memory buffer. For this, a design with memory bins of a size of 1 kB provides a sufficient number of memory bins. The first benchmark measured the overhead only for writing events without any reduction taking place. A second benchmark evaluates the performance in case of an actual event reduction; the original purpose of the hierarchical memory buffer. This benchmark is designed as a stress test, i.e., it shows worst-case behavior. It writes about 30 million events, resulting in approx. 100 MB of data. The writing pattern distributes the events across one hundred call stack levels equally . Unlike the first benchmark, first all events are written to the deepest call stack level (i.e. 100) then to the second deepest (i.e. 99) and
0.5
100
0.4
80
0.3
60
0.2
40
0.1
20
0 32
64 128 256 512 1k 2k 4k 8k 16k 32k 64k 128k256k512k 1M Real Size of memory bins in bytes
Memory allocation in megabytes
Time in seconds
Time in seconds Allocated memory in megabytes
0
Fig. 3. Finding the balance between memory allocation and management overhead. Runtime is represented with the left bars (dark blue) and left vertical axis. The right bars (light blue) and the right vertical axis represent the total memory allocation for the memory bins.
so on. This way, maximum load is put in each reduction step. By adjusting the total size of the memory buffer the grade of reduction can be controlled. When writing 100 MB of data to a buffer with a size of 100 MB no reduction is triggered. For a buffer size of 50 MB the call stack level is reduced stepwise down to level 50. For a buffer size of only 1 MB the maximum reduction is achieved since all levels are stepwise reduced until only level 1 remains. Figure 4 shows the results of this benchmark. It depicts the runtime for different bin sizes and different grades of reduction and sets them in comparison to the runtime for writing to OTF2 Version 1.1 (I/O excluded) and OTFX with a flat memory buffer. As can be seen, for very small memory bins (in this case 128 byte) the runtime steadily increases while it is fairly constant for medium sized memory bins. Actually, the runtime slightly decreases since less memory needs to be allocated in total. From Figure 4 it can be seen that hierarchical memory buffering that uses a suitable size for the memory bins introduces minimal additional overhead. The third benchmark evaluates the performance when reading from the hierarchical memory buffer. Since recorded events are stored separately for each call stack level, they need to be merged in a way that they are handed to the user ordered by time stamp, which is the default behavior for OTF2 and the most meaningful way for a user, since that is the same order the events were recorded. Thus, reading performance mainly depends on the number of call stack levels and the pattern in which they are assigned to the call stack levels. The sorted output can be realized efficiently by using a heap data structure. Figure 5 sets the results of a stress test in comparison to the reading speed for a set of real live applications and benchmarks
(for all measurements a bin size of 1 kB was used). The stress test uses the same pattern as the first benchmark to achieve an equal distribution of events to the call stack levels but this time one million events. This way, maximum load is put on the merging. In comparison a set of real live applications is evaluated. These applications are: 104.milc (quantum chromodynamics), 107.leslie3D, 115.fds4 (both computational fluid dynamics), 121.pop2 (ocean modeling), 122.tachyon (parallel ray tracing), 126.lammps (molecular dynamics), 127.wrf2 (weather prediction), 129.tera tf (3D eulerian hydrodynamics), 130.socorro (molecular dynamics), 137.lu (computational fluid dynamics) from the SPEC MPI 2007 benchmarks [15], BT a block tri-diagonal solver from the NAS Parallel Benchmarks [16], the smg2000 benchmark a semicoarsening multigrid solver [17], and sweep3D a 3D discrete ordinates neutron transport problem [18]. From all applications the first million events were recorded with the new method to set them in relation with the stress test. The stress test shows that in worst-case the merging can be done in logarithmic time complexity. The evaluated applications, like most others, show a different behavior than the stress test. Most events are triggered on only one or a few call stack levels. Therefore, the reading performance is much higher, as can be seen in Figure 5. From these applications it can be estimated that the runtime is approximately constant for most applications. However, in worst-case, runtime grows logarithmically. Unfortunately, the results for reading could not be set in comparison to OTF2 because the time reading the data from the file system into memory can not be excluded. However, it is fairly likely that the runtime for using only a single call stack level is a good reference point since it is virtually the same as reading from a single memory buffer.
1 Bin size: 8 kB
Bin size: 1 kB
Bin size: 128 B
Time in seconds
0.8
0.6
0.4
0.2
0
OTF2
OTFX flat
no reduction red. to 50% red. to 25% red. to 1%
Fig. 4. Reduction overhead stress test. Runtime for different bin sizes and different grades of reduction. The values are set in comparison to OTF2 and OTFX with a flat memory buffer.
0.2
0.15
.w
rf2
0.1 12 7
Time in seconds
Results from stress test Results from applications
0.05
0 0
50
100 Maximum call stack depth
150
200
0.15
0 0
D co rro
so
ee p3
0.
sw
13
0 00 sm g2
12 2 11 .tac 5. h fd yo s4 n
10 7 ilc 13.les 7 l 12 .lu ie3D 9. te 12 ra 6. _t la 1 f 21 m m . po ps p2 4.
10
AS _B
0.05
m
T
0.1
N
Time in seconds
Results from stress test Results from applications
5
10
15 Maximum call stack depth
20
25
30
Fig. 5. Time to read events depending on call stack depth for stress test and real applications. Top: Scaled to maximum call stack depth of 200. Bottom: Zoomed to maximum call stack depth of 30.
In sum, the benchmarks demonstrate that, first and foremost, for a suitable size of the memory bins event reduction can be done without additional overhead, regardless of the grade of reduction. Furthermore, the memory consumption and overhead mainly depends on the size of the memory bins. The best results for both can be achieved in the range of 1 kB to 8 kB. Finally, the hierarchical memory buffering does not introduce noticeable overhead for reading either. V.
F UTURE W ORK
The presented hierarchical memory buffer as well as other optimizations like enhanced encoding techniques [4] are components of the In-Memory Event Tracing Extension to the Open Trace Format 2, called OTFX. The first of our two primary goals is making the current prototype available to be used by the tools that use OTF2. Because of its particular purpose OTFX is intended as an addition to OTF2; not to replace it. Thus, to make the prototype available to tool developers it is adapted with the full OTF2 user interface, so it can be used by simply linking the tool againts OTFX instead of OTF2. The second, long term, goal is to use the capability of in-memory event tracing to enable interactive event tracing as described in Section I. In this way, the next step is to enable the currently separated tools for event trace generation and post-mortem analysis to interact during runtime. VI.
C ONCLUSION
In this paper, we argued for a hierarchical memory buffer instead of static flat memory buffer to support real-time event reduction as proposed in [6]. Furthermore, we showed how such a hierarchical memory buffer can be designed and evaluated our current prototype. In addition, we examined the most influential parameter; the size of the internal memory bins. We demonstrated that the hierarchical memory buffer enables event reduction with minimal additional overhead, regardless of the grade of reduction. R EFERENCES [1]
W. Frings, F. Wolf, and V. Petkov, “Scalable massively parallel i/o to task-local files,” in Proceedings of the Conference on High Performance Computing Networking, Storage and Analysis, ser. SC ’09. New York, NY, USA: ACM, 2009, pp. 17:1–17:11. [2] T. Ilsche, J. Schuchart, J. Cope, D. Kimpe, T. Jones, A. Kn¨upfer, K. Iskra, R. Ross, W. E. Nagel, and S. Poole, “Enabling Event Tracing at Leadership-Class Scale through I/O Forwarding Middleware,” in Proceedings of the 21th International Symposium on High Performance Distributed Computing, ser. HPDC ’12. ACM, Jun. 2012, pp. 49–60. [3] T. Hoefler, T. Schneider, and A. Lumsdaine, “Characterizing the influence of system noise on large-scale applications by simulation,” in Proceedings of the 2010 ACM/IEEE International Conference for High Performance Computing, Networking, Storage and Analysis, ser. SC ’10. Washington, DC, USA: IEEE Computer Society, 2010, pp. 1–11.
[4] M. Wagner, A. Kn¨upfer, and W. E. Nagel, “Enhanced Encoding Techniques for the Open Trace Format 2,” Procedia Computer Science, vol. 9, pp. 1979 – 1987, 2012. [5] D. Eschweiler, M. Wagner, M. Geimer, A. Kn¨upfer, W. E. Nagel, and F. Wolf, “Open trace format 2: The next generation of scalable trace formats and support libraries,” in Applications, Tools and Techniques on the Road to Exascale Computing, ser. Advances in Parallel Computing, vol. 22, 2012, pp. 481–490. [6] M. Wagner and W. E. Nagel, “Strategies for Real-Time Event Reduction,” in Euro-Par 2012: Parallel Processing Workshops, ser. Lecture Notes in Computer Science. Springer Berlin Heidelberg, 2013, vol. 7640, pp. 429–438. [7] A. Kn¨upfer, R. Brendel, H. Brunst, H. Mix, and W. E. Nagel, “Introducing the Open Trace Format (OTF),” in Computational Science ICCS 2006: 6th International Conference, ser. LNCS 3992. Reading, UK: Springer, May 2006. [8] F. Wolf and B. Mohr, “EPILOG Binary Trace-Data Format,” Forschungszentrum J¨ulich, Tech. Rep. FZJ-ZAM-IB-2004-06, May 2004. [9] A. Kn¨upfer, H. Brunst, J. Doleschal, M. Jurenz, M. Lieber, H. Mickler, M. S. M¨uller, and W. E. Nagel, “The Vampir Performance Analysis Tool Set,” in Tools for High Performance Computing. Springer, July 2008, pp. 139–155. [10] S. Shende and A. D. Malony, “The TAU Parallel Performance System, SAGE Publications,” International Journal of High Performance Computing Applications, vol. 20, no. 2, pp. 287–331, 2006. [11] A. Kn¨upfer, C. R¨ossel, D. Mey, S. Biersdorff, K. Diethelm, D. Eschweiler, M. Geimer, M. Gerndt, D. Lorenz, A. Malony, W. E. Nagel, Y. Oleynik, P. Philippen, P. Saviankou, D. Schmidl, S. Shende, R. Tsch¨uter, M. Wagner, B. Wesarg, and F. Wolf, “Score-P: A Joint Performance Measurement Run-Time Infrastructure for Periscope, Scalasca, TAU, and Vampir,” in Tools for High Performance Computing 2011, H. Brunst, M. S. M¨uller, W. E. Nagel, and M. M. Resch, Eds. Springer Berlin Heidelberg, 2012, pp. 79–91. ´ [12] M. Geimer, F. Wolf, B. J. Wylie, E. Abrah´ am, D. Becker, and B. Mohr, “The Scalasca Performance Toolset Architecture,” Concurrency and Computation: Practice and Experience, vol. 22, no. 6, pp. 702–719, 2010. [13] G. Llort, J. Gonzalez, H. Servat, J. Gimenez, and J. Labarta, “Online detection of large-scale parallel application’s structure,” in Parallel Distributed Processing (IPDPS), 2010 IEEE International Symposium on, april 2010, pp. 1–10. [14] MRNet, http://www.paradyn.org/mrnet/. [15] M. S. M¨uller, M. van Waveren, R. Lieberman, B. Whitney, H. Saito, K. Kumaran, J. Baron, W. C. Brantley, C. Parrott, T. Elken, H. Feng, and C. Ponder, “SPEC MPI2007an application benchmark suite for parallel systems using MPI,” Concurrency and Computation: Practice and Experience, vol. 22, no. 2, pp. 191–205, 2010, http://www.spec.org/mpi2007. [16] NASA Advanced Supercomputing (NAS) Division, “NAS Parallel Benchmarks, Version 3.3,” http://www.nas.nasa.gov/publications/npb.html. [17] University of California, Lawrence Livermore National Laboratory, “Smg2000,” http://asc.llnl.gov/computing resources/purple/archive/benchmarks/smg/. [18] Los Alamos National Laboratory, “Sweep3d,” http://wwwc3.lanl.gov/pal/software/sweep3d/.