Web [5] to biological networks [1â4] have been found to be scale-free [12,13], .... (Fig. 3b). Subsequently, we again generate four replicas of this 25ânode module, ..... C(k) observed for the Internet's domain level topology (Fig.5d), and in agree-.
Hierarchical Organization of Modularity in Complex Networks Albert-L´ aszl´o Barab´ asi1 , Erzs´ebet Ravasz1 , and Zolt´ an Oltvai2 1 2
Department of Physics, 225 Nieuwland Science Hall, University of Notre Dame, Notre Dame, IN 46556, USA Department of Pathology, Northwestern University, Chicago, IL 60611, USA
Abstract. Many real networks in nature and society share two generic properties: they are scale-free and they display a high degree of clustering. We show that the scalefree nature and high clustering of real networks are the consequence of a hierarchical organization, implying that small groups of nodes form increasingly large groups in a hierarchical manner, while maintaining a scale-free topology. In hierarchical networks the clustering coefficient follows a strict scaling law, which can be used to identify the presence of a hierarchical organization in real networks. We find that several real networks, such as the World Wide Web, actor network, the Internet at the domain level and the semantic web obey this scaling law, indicating that hierarchy is a fundamental characteristic of many complex systems. We the focus on the metabolic network of 43 distinct organisms and show that many small, highly connected topologic modules combine in a hierarchical manner into larger, less cohesive units, their number and degree of clustering following a power law. Within Escherichia Coli we find that the uncovered hierarchical modularity closely overlaps with known metabolic functions.
1
Introduction
The availability of detailed network maps, capturing the topology of such diverse systems as the cell [1–4], the world wide web [5], or the sexual network [6], have offered scientists for the first time the chance to address in quantitative terms the generic features of real networks (for reviews see [7,8]). As a result, we learned that networks are governed by strict organizing principles, that generate systematic and measurable deviations from the topology predicted by the random graph theory of Erd˝ os and R´enyi [9,10], the model used to describe complex webs in the past four decades. Two properties of real networks have generated considerable attention. First, many networks display a high degree of clustering, measured by the clustering coefficient, which for node i with ki links has the value Ci = 2ni /ki (ki − 1), where ni is the number of links between the ki neighbors of i. Empirical results indicate that Ci averaged over all nodes is significantly higher for many real networks than for a random network of similar size [11,7,8]. Furthermore, the clustering coefficient of real networks is to a high degree independent of the number of nodes in the network (see Fig. 9 in [7]). At the same time, many networks of scientific or technological interest, ranging from the World Wide Web [5] to biological networks [1–4] have been found to be scale-free [12,13],
2
Albert-L´ aszl´ o Barab´ asi, Erzs´ebet Ravasz, and Zolt´ an Oltvai
which means that the probability that a node has k links (i.e. degree k) follows P (k) ∼ k −γ , where γ is the degree exponent. The scale-free property and clustering are not exclusive: for a large number of real networks, including metabolic networks [1,2], the protein interaction network [3,4], the world wide web [5] and some social networks [14–16] the scale-free topology and high clustering coexist. Yet, most models proposed to describe the topology of complex networks have difficulty capturing simultaneously these two features. For example, the random network model [9,10] cannot account neither for the scale-free, nor for the clustered nature of real networks, as it predicts an exponential degree distribution, and the average clustering coefficient, C(N ), decreases as N −1 with the number of nodes in the network. Scale-free networks (Fig. 1a), capturing the power law degree distribution, predict a much larger clustering coefficient than a random network. Indeed, numerical simulations indicate that for one of the simplest models [12,13] the average clustering coefficient depends on the system size as C(N ) ∼ N −0.75 [7,8], significantly larger for large N than the random network prediction C(N ) ∼ N −1 . Yet, this prediction still disagrees with the finding that for several real systems C is independent of N [7].
(a)
(b)
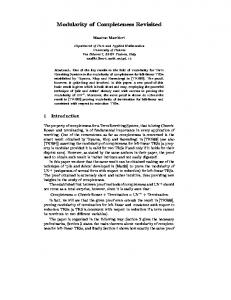
Fig. 1. (a) A schematic illustration of a scale-free network, whose degree distribution follows a power law. In such a network a few highly connected nodes, or hubs (empty circles) play an important role in keeping the whole network together. (b) Schematic illustration of a manifestly modular network made of four highly interlinked modules connected to each other by a few links. This intuitive topology does not have a scalefree degree distribution, as most of its nodes have a similar number of links, and hubs are absent (After [17])
On the biological front, it is now widely recognized that the thousands of components of a living cell are dynamically interconnected, so that the cell’s
Hierarchical Organization of Modularity
3
functional properties are ultimately encoded into a complex intracellular web of molecular interactions [18–23]. On the other hand, the identification and characterization of system-level features of biological organization is a key issue of post-genomic biology [24,18,19]. The concept of modularity assumes that cellular functionality can be seamlessly partitioned into a collection of modules. Each module is a discrete entity of several elementary components and performs an identifiable task, separable from the functions of other modules [24,20–22,25,23]. Spatially and chemically isolated molecular machines or protein complexes (such as ribosomes and flagella) are prominent examples of such functional units, but more extended modules, such as those achieving their isolation through the initial binding of a signaling molecule [26] are also apparent. The dilemma of modular versus highly integrated topology is perhaps most evident when inspecting cellular metabolism, a fully connected biochemical network in which hundreds of metabolic substrates are densely integrated via biochemical reactions. Within this network, however, modular organization (i.e., clear boundaries between sub-networks) is not immediately apparent. A number of approaches for analyzing the functional capabilities of metabolic networks clearly indicate the existence of separable functional elements [27,28]. Also, from a purely topologic perspective the metabolic network of Escherichia coli is known to possess a high clustering coefficient [2], a property that is suggestive of a modular organization. In itself, this implies that the metabolism of E. coli has a modular topology, potentially comprising several densely interconnected functional modules of varying sizes that are connected by few intermodule links (Fig. 1b). However, such clearcut modularity imposes severe restrictions on the degree distribution, implying that most nodes have approximately the same number of links, which contrasts with the metabolic network’s scalefree nature [1,2]. To determine if such a dichotomy is indeed a generic property of all metabolic networks we first calculated the average clustering coefficient for 43 different organisms [29] as a function of the number of distinct substrates, N , present in their metabolism. We find that for all 43 organisms the clustering coefficient is about an order of magnitude larger than that expected for a scale-free network of similar size (Fig. 2a), suggesting that metabolic networks in all organisms are characterized by a high intrinsic potential modularity. We also observe that in contrast with the prediction of the scale-free model, for which the clustering coefficient decreases as N −0.75 [7], the clustering coefficient of metabolic networks’ is independent of their size (Fig. 2a). Here we show that the fundamental discrepancy between models and empirical measurements is rooted in a previously disregarded, yet generic feature of many real networks, biological and non-biological: their hierarchical topology. Indeed, in many networks one can easily identify groups of nodes that are highly interconnected with each other, but have only a few or no links to nodes outside of the group to which they belong to. In society such modules represent groups of friends or coworkers [30]; in the WWW denote communities with shared interests [31,32]; in the actor network they characterize specific genres or simply individual movies. Some groups are small and tightly linked, others are larger
Albert-L´ aszl´ o Barab´ asi, Erzs´ebet Ravasz, and Zolt´ an Oltvai
C(N)
4
10
−1
10
−2
100
N
1000
Fig. 2. The average clustering coefficient, C(N ), for 43 organisms [1] is shown as a function of the number of substrates N present in each of them. Species belonging to Archae (white star ), Bacteria (black circle), and Eukaryotes (white triangle) are shown. The dashed line indicates the dependence of the clustering coefficient on the network size for a module-free scale-free network, while the diamonds denote C for a scale-free network with the same parameters (N and number of links) as observed in the 43 organisms (After [17])
and somewhat less interconnected. This clearly identifiable modular organization is at the origin of the high clustering coefficient seen in many real networks. Yet, models reproducing the scale-free property of real networks [7,8] distinguish nodes based only on their degree, and are blind to node characteristics that could lead to a modular topology. In order to bring modularity, the high degree of clustering and the scale-free topology under a single roof, we need to assume that modules combine into each other in a hierarchical manner, generating what we call a hierarchical network. The presence of a hierarchy and the scale-free property impose strict restrictions on the number and the degree of cohesiveness of the different groups present in a network, which can be captured in a quantitative manner using a scaling law, describing the dependence of the clustering coefficient on the node degree. We use this scaling law to identify the presence of a hierarchical architecture in several real networks, and the absence of such hierarchy in geographically organized webs.
2
Hierarchical Network Model
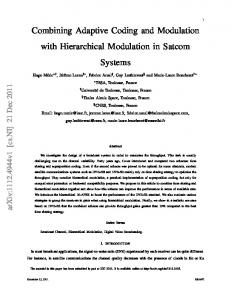
We start by constructing a hierarchical network model, that combines the scalefree property with a high degree of clustering. Our starting point is a small cluster of five densely linked nodes (Fig. 3a). Next we generate four replicas of this hypothetical module and connect the four external nodes of the replicated clusters to the central node of the old cluster, obtaining a large 25–node module (Fig. 3b). Subsequently, we again generate four replicas of this 25–node module, and connect the 16 peripheral nodes to the central node of the old module (Fig. 3c), obtaining a new module of 125 nodes. These replication and connection
Hierarchical Organization of Modularity
5
steps can be repeated indefinitely, in each step increasing the number of nodes in the system by a factor five.
(a) n=0, N=5
(b) n=1, N=25
(c) n=2, N=125
Fig. 3. The iterative construction leading to a hierarchical network. Starting from a fully connected cluster of five nodes shown in (a) (note that the diagonal nodes are also connected – links not visible), we create four identical replicas, connecting the peripheral nodes of each cluster to the central node of the original cluster, obtaining a network of N = 25 nodes (b). In the next step we create four replicas of the obtained cluster, and connect the peripheral nodes again, as shown in (c), to the central node of the original module, obtaining a N = 125 node network. This process can be continued indefinitely (After [33])
Precursors to the model described in Fig. 3 have been proposed in [34] and extended and discussed in [35,36] as a method of generating deterministic scalefree networks. Yet, it was believed that aside from their deterministic structure, their statistical properties are equivalent with the stochastic models that are often used to generate scale-free networks. In the following we argue that such hierarchical construction generates an architecture that is significantly different from the networks generated by traditional scale-free models. Most important, we show that the new feature of the model, its hierarchical character, are shared by a significant number of real networks. First we note that the hierarchical network model seamlessly integrates a scale-free topology with an inherent modular structure. Indeed, the generated network has a power law degree distribution with degree exponent γ = 1 + ln 5/ ln 4 = 2.161 (Fig. 4a). Furthermore, numerical simulations indicate that the clustering coefficient, C � 0.743, is independent of the size of the network (Fig. 4c). Therefore, the high degree of clustering and the scale-free property are simultaneously present in this network.
6
Albert-L´ aszl´ o Barab´ asi, Erzs´ebet Ravasz, and Zolt´ an Oltvai 0
0
10
0
10
(a)
-1
10
(b)
(c)
10
-2
-1
10
-1
10
10
-3
-4
10
C(N)
C(k)
P(k)
10
-2
10
-2
10
-5
10
-6
-3
10
-3
10
10
-7
10
-8
10
-4
0
10
10
1
10
k
2
3
10
4
10
10
-4
0
10
1
10
10
2
3
10
k
4
10
5
10
10
2
10
3
10
4
10
5
10
N
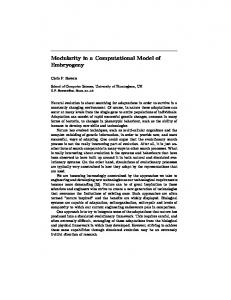
Fig. 4. Scaling properties of the hierarchical model shown in Fig. 3 (N = 57 ). (a) The numerically determined degree distribution. The assymptotic scaling, with slope γ = 1 + ln 5/ ln 4, is shown as a dashed line. (b) The C(k) curve for the model, demonstrating that it follows (1). The open circles show C(k) for a scale-free model [12] of the same size, illustrating that it does not have a hierarchical architecture. (c) The dependence of the clustering coefficient, C, on the size of the network N . While for the hierarchical model C is independent of N (�), for the scale-free model C(N ) decreases rapidly (�)
The most important feature of the network model of Fig. 3, not shared by either the scale-free [12,13] or random network models [9,10], is its hierarchical architecture. The network is made of numerous small, highly integrated five node modules (Fig. 3a), which are assembled into larger 25–node modules (Fig. 3b). These 25–node modules are less integrated but each of them is clearly separated from the other 25–node modules when we combine them into the even larger 125–node modules (Fig. 3c). These 125–node modules are even less cohesive, but again will appear separable from their replicas if the network expands further. This intrinsic hierarchy can be characterized in a quantitative manner using the recent finding of Dorogovtsev, Goltsev and Mendes [35] that in deterministic scale-free networks the clustering coefficient of a node with k links follows the scaling law (1) C(k) ∼ k −1 . We argue that this scaling law quantifies the coexistence of a hierarchy of nodes with different degrees of clustering, and applies to the model of Fig. 3a–c as well. Indeed, the nodes at the center of the numerous 5–node modules have a clustering coefficient C = 1. Those at the center of a 25–node module have k = 20 and C = 3/19, while those at the center of the 125–node modules have k = 84 and C = 3/83, indicating that the higher a node’s degree the smaller is its clustering coefficient, asymptotically following the 1/k law (Fig. 4b). In contrast, for the scale-free model proposed in [12] the clustering coefficient is independent of k, i.e. the scaling law (1) does not apply (Fig. 4b). The same is true for the random [9,10] or the various small world models [11,37], for which the clustering coefficient is independent of the nodes’ degree. Therefore, the discrete model of Fig. 3 combines within a single framework the two key properties of real networks: their scale-free topology and high mod-
Hierarchical Organization of Modularity
7
ularity, which results in a system-size independent clustering coefficient. Yet, the hierarchical modularity of the model results in the scaling law (1), which is not shared by the traditional network models. The question is, could hierarchical modularity, as captured by this model, characterize real networks as well?
3
Hierarchical Organization in Non-Biological Networks
To investigate if such hierarchical organization is present in real networks we measured the C(k) function for several networks for which large topological maps are available. Next we discuss each of these systems separately. Actor Network: Starting from the www.IMDB.com database, we connect any two actors in Hollywood if they acted in the same movie, obtaining a network of 392,340 nodes and 15,345,957 links. Earlier studies indicate that this network is scale-free with an exponential cutoff in P (k) for high k [12,38,39]. As Fig. 5a indicates, we find that C(k) scales as k −1 , indicating that the network has a hierarchical topology. Indeed, the majority of actors with a few links (small k) appear only in one movie. Each such actor has a clustering coefficient equal to one, as all actors the actor has links to are part of the same cast, and are therefore connected to each other. The high k nodes include many actors that acted in several movies, and thus their neighbors are not necessarily linked to each other, resulting in a smaller C(k). At high k the C(k) curve splits into two branches, one of which continues to follow (1), while the other saturates. One explanation of this split is the decreasing amount of datapoints available in this region. Indeed, in the high k region the number of nodes having the same k is rather small. If one of these nodes corresponds to an actor that played only in a few movies with hundreds in the cast, it will have both high k and high C, considerably increasing the average value of C(k). The k values for which such a high C nodes are absent continue to follow the k −1 curve, resulting in jumps between the high and small C values for large k. For small k these anomalies are averaged out. Language network: Recently a series of empirical results have shown that the language, viewed as a network of words, has a scale-free topology [40–43]. Here we study the network generated connecting two words to each other if they appear as synonyms in the Merriam Webster dictionary [41]. The obtained semantic web has 182,853 nodes and 317,658 links and it is scale-free with degree exponent γ = 3.25. The C(k) curve for this language network is shown in Fig. 5b, indicating that it follows (1), suggesting that the language has a hierarchical organization. World Wide Web: On the WWW two documents are connected to each other if there is an URL pointing from one document to the other one. The sample we study, obtained by mapping out the www.nd.edu domain [5], has 325,729 nodes and 1,497,135 links, and it is scale-free with degree exponents γout = 2.45 and γin = 2.1, characterising the out and in-degree distribution, respectively. To measure the C(k) curve we made the network undirected. While the obtained C(k), shown in Fig. 5c, does not follow as closely the scaling law (1) as observed
8
Albert-L´ aszl´ o Barab´ asi, Erzs´ebet Ravasz, and Zolt´ an Oltvai
in the previous two examples, there is clear evidence that C(k) decreases rapidly with k, supporting the coexistence of many highly interconnected small nodes with a few larger nodes, which have a much lower clustering coefficient. Indeed, the Web is full of groups of documents that all link to each other. For example, www.nd.edu/∼networks, our network research dedicated site, has a high clustering coefficient, as the documents it links to have links to each other. The site is one of the several network-oriented sites, some of which point to each other. Therefore, the network research community still forms a relatively cohesive group, albeit less interconnected than the www.nd.edu/∼networks site, thus having a smaller C. This network community is nested into the much larger community of documents devoted to statistical mechanics, that has an even smaller clustering coefficient. Therefore, the k–dependent C(k) reflects the hierarchical nesting of the different interest groups present on the Web. Note that C(k) ∼ k −1 for the WWW was observed and briefly noted in [44]. 10
0
10
0
(b)
C(k)
C(k)
(a)
−1
10
10
−1
−2
10
0
10
1
10
2
10
3
10
10
4
1
k 10
10
100
k
0
10
0
(c) 10
(d)
−1
10
10 10
10
−1
C(k)
C(k)
10 −2
−2
−3
−4
10
0
10
1
10
2
k
10
3
10
4
10
−3
10
0
10
1
10
2
10
3
k
Fig. 5. The scaling of C(k) with k for four large networks: (a) Actor network, two actors being connected if they acted in the same movie according to the www.IMDB.com database. (b) The semantic web, connecting two English words if they are listed as synonyms in the Merriam Webster dictionary [41]. (c) The World Wide Web, based on the data collected in [5]. (d) Internet at the Autonomous System level, each node representing a domain, connected if there is a communication link between them. The dashed line in each figure has slope −1, following (1) (After [33])
Internet at the AS level: The Internet is often studied at two different levels of resolution. At the router level we have a network of routers connected by various physical communication links. At the interdomain or autonomous system
Hierarchical Organization of Modularity
9
(AS) level each administrative domain, composed of potentially hundreds of routers, is represented by a single node. Two domains are connected if there is at least one router that connects them. Both the router and the domain level topology have been found to be scale-free [45]. As Fig. 5d shows, we find that at the domain level the Internet, consisting of 65,520 nodes and 24,412 links [46], has a hierarchical topology as C(k) is well approximated with (1). The scaling of the clustering coefficient with k for the Internet was earlier noted by Vazquez, Pastor-Satorras and Vespignani (VPSV) [47,48], who observed C(k) ∼ k −0.75 . VPSV interpreted this finding, together with the observation that the average nearest-neighbor connectivity also follows a power-law with the node’s degree, as a natural consequence of the stub and transit domains, that partition the network in a hierarchical fashion into international connections, national backbones, regional networks and local area networks. Our measurements indicate, however, that some real networks lack a hierarchical architecture, and do not obey the scaling law (1). In particular, we find that the power grid and the router level Internet topology have a k independent C(k). Internet at the router level: The router level Internet has 260,657 nodes connected by 1,338,100 links [49]. Measurements indicate that the network is scalefree [45,50] with degree exponent γ = 2.23. Yet, the C(k) curve (Fig. 6a), apart from some fluctuations, is largely independent of k, in strong contrast with the C(k) observed for the Internet’s domain level topology (Fig. 5d), and in agreement with the results of VPSV [47,48], who also note the absence of a hierarchy in router level maps. Power Grid: The nodes of the power grid are generators, transformers and substations and the links are high voltage transmission lines. The network studied by us represents the map of the Western United States, and has 4,941 nodes and 13,188 links [11]. The results again indicate that apart from fluctuations, C(k) is independent of k. 0
10
0
10
(b)
(a)
10
10
10
−1
C(k)
C(k)
10
−2
10
−1
−3
10
−2
−4
1
10
100
k
1000
1
10
k
Fig. 6. The scaling of C(k) for two large, non-hierarchical networks: (a) Internet at router level [49]. (b) The power grid of Western United States. The dashed line in each figure has slope −1, while the solid line corresponds to the average clustering coefficient (After [33])
10
Albert-L´ aszl´ o Barab´ asi, Erzs´ebet Ravasz, and Zolt´ an Oltvai
It is quite remarkable that these two networks share a common feature: a geographic organization. The routers of the Internet and the nodes of the power grid have a well defined spatial location, and the link between them represent physical links. In contrast, for the examples discussed in Fig. 5 the physical location of the nodes was either undefined or irrelevant, and the length of the link was not of major importance. For the router level Internet and the power grid the further are two nodes from each other, the more expensive it is to connect them [50]. Therefore, in both systems the links are driven by cost considerations, generating a distance driven structure, apparently excluding the emergence of a hierarchical topology. In contrast, the domain level Internet is less distance driven, as many domains, such as the AT&T domain, span the whole United States. In summary, we offered evidence that for four large networks C(k) is well approximated by C(k) ∼ k −1 , in contrast to the k–independent C(k) predicted by both the scale-free and random networks. In addition, there is evidence for similar scaling in the metabolism [17] and protein interaction networks [51]. This indicates that these networks have an inherently hierarchical organization. In contrast, hierarchy is absent in networks with strong geographical constraints, as the limitation on the link length strongly constraints the network topology.
4
Hierarchy in Metabolic Networks and the Functional Organization of Escherichia Coli
To investigate if hierarchical organization is present in cellular metabolism we measured the C(k) function for the metabolic networks of all 43 organisms. As shown in Fig. 7, for each organism C(k) is well approximated by C(k) ∼ k −1 , in contrast to the k–independent C(k) predicted by both the scale-free and modular networks. This provides direct evidence for an inherently hierarchical organization. A key issue from a biological perspective is whether the identified hierarchical architecture reflects the true functional organization of cellular metabolism. To uncover potential relationships between topological modularity and the functional classification of different metabolites we concentrate on the metabolic network of Escherichia coli, whose metabolic reactions have been exhaustively studied, both biochemically and genetically [52]. Using a previously established graph-theoretical representation [1], we first subjected E. coli’s metabolic organization to a three step reduction process, replacing non-branching pathways with equivalent links, allowing us to decrease its complexity without altering the network topology [54]. Next, we calculated the topological overlap matrix, OT (i, j), of the condensed metabolic network (Fig. 8). A topological overlap of one between substrates i and j implies that they are connected to the same substrates, while a zero value indicates that i and j do not share links to common substrates among the metabolites they react with.
Hierarchical Organization of Modularity 0
C(k)
10
(a)
(b)
Aquifex aeolicus
0
Escherichia coli
10
−1
10
−1
10
−2
10
−2
10
0
0
10
C(k)
10
(c)
(d)
Saccharomyces cerevisiae
−1
10
−1
10
−2
10
−2
10
0
10
1
2
10
10
k
3
0
10 10
11
1
2
10
10
10
3
k
Fig. 7. The dependence of the clustering coefficient on the node’s degree in three organisms: (a) Aquidex Aeolicus (archaea), (b) Escherichia Coli (bacterium), (c) and Saccharomices cerevisiae (eukaryote). In (d) the C(k) curves averaged over all 43 organisms are shown, while the inset displays all 43 species together. The dashed lines correspond to C(k) ∼ k−1 , and in (a–c) the diamonds represent C(k) expected for a scale-free network (Fig. 1a) of similar size, indicating the absence of scaling. The wide fluctuations are due to the small size of the network (After [17])
The metabolites that are part of highly integrated modules have a high topological overlap with their neighbors, and we find that the larger the overlap between two substrates within the E. coli metabolic network the more likely it is that they belong to the same functional class. As the topological overlap matrix is expected to encode the comprehensive functional relatedness of the substrates forming the metabolic network, we investigated whether potential functional modules encoded in the network topology can be uncovered automatically. Initial application of an average-linkage hierarchical clustering algorithm [53] to the overlap matrix of the small hypothetical network shown in Fig. 8a placed those nodes that have a high topological overlap close to each other (Fig. 8b). Also, the method has clearly identified the three distinct modules built into the model of Fig. 8a, as illustrated by the fact that the EFG and HIJK modules are closer to each other in a topological sense than the ABC module (Fig. 8b). Application of the same technique on the E. coli overlap matrix OT (i, j) provides a global topologic representation of E. coli metabolism (Fig. 8c). Groups
12
Albert-L´ aszl´ o Barab´ asi, Erzs´ebet Ravasz, and Zolt´ an Oltvai A(1)
B (1)
1
1
1
C (1/3) 1/3
D(0) 1/3
1/3
I (1/3) E (1/3) 1
F (1)
1 1
1
2/3
1/3
G(1/3)
2/3
H
(1/3)
K(1)
1 1
J(2/3)
(a)
0.950 0
A
B
C
D
K
J
I
H
E
F
0.850 0 0.750 0
G
0.650 0.550 0.450 0.350
G F E
0 0 0 0
H
0.250 0 0.150 0 0.050 0
I J K
(b)
Vitamin K
Purine
Sirohem Chorismate
Pyrimidine
Arginine
Metab. sugar alc. Formate
Glutamate
Glycoxilate
Tyrosine
Nicotinamide
Purine Byosynthesis
Serine, Threonine
Cysteine Lactate
Pyruvate
0.100 0
Fatty Acids
0.700 0 0.500 0 0.300 0
Nucleotides Coenz. Nucleic Acids Vit.
Amino acids Organic Acids
A
Membrane Lipids
0.900 0
B
Monosaccharides
C
Disaccharides
Carbohydrates Lipids
D
(c)
Fig. 8. (a) Topological overlap illustrated on a small hypothetical network. For each pair of nodes, i and j, we define the topological overlap OT (i, j) = Jn (i, j)/[min(ki , kj )+ 1 − L(i, j)], where Jn (i, j) denotes the number of nodes to which both i and j are linked to plus L(i, j), which is one if there is a direct link between i and j, zero otherwise, and min(ki , kj ) is the smaller of the ki and kj degrees. On each link we indicate the topological overlap for the connected nodes and in parenthesis next to each node we indicate it’s clustering coefficient. (b) The topological overlap matrix corresponding to the small network shown in (a). The rows and columns of the matrix were reordered by the application of an average linkage clustering method [53] to its elements, allowing us to identify and place close to each other those nodes that have high topological overlap. The color code denotes the degree of topological overlap between the nodes (see sidebar). The associated tree clearly reflects the three distinct modules built into the model of (a), as well as the fact that the EFG and HIJK modules are closer to each other in topological sense that the ABC module. (c) The topologic overlap matrix corresponding to the E. coli metabolism, together with the corresponding hierarchical tree (top) that quantifies the relationship between the different modules. The branches of the tree are color coded to reflect the functional classification of their substrates. The biochemical classes we used to group the metabolites represent carbohydrate metabolism (blue), nucleotide and nucleic acid metabolism (red ), protein, peptide and amino acid metabolism (green), lipid metabolism (cyan), aromatic compound metabolism (dark pink ), monocarbon compound metabolism (yellow ) and coenzyme metabolism (light orange) [29]. The color code of the matrix denotes the degree of topological overlap shown in the matrix. On the bottom we show the large-scale functional map of the metabolism, as suggested by the hierarchical tree (After [17])
Hierarchical Organization of Modularity
13
of metabolites forming tightly interconnected clusters are visually apparent, and upon closer inspection the hierarchy of nested topologic modules of increasing sizes and decreasing interconnectedness are also evident. To visualize the relationship between topological modules and the known functional properties of the metabolites, we color coded the branches of the derived hierarchical tree according to the predominant biochemical class of the substrates it produces, using the standard, small molecule biochemistry based classification of metabolism [29]. As shown in Fig. 8c, and in the three dimensional representation in Fig. 9, we find that most substrates of a given small molecule class are distributed on the same branch of the tree (Fig. 8c) and correspond to relatively welldelimited regions of the metabolic network (Fig. 9). Therefore, there are strong correlations between shared biochemical classification of metabolites and the global topological organization of E. coli metabolism (Fig. 8c, bottom, and [54]).
Fig. 9. 3-D representation of the reduced E. coli metabolic network. Each node is color coded by the functional class to which it belongs, and is identical to the color code applied to the branches of the tree shown in Fig. 8c. Note that the different functional classes are visibly segregated into topologically distinct regions of metabolism. The blue-shaded region denotes the nodes belonging to pyrimidine metabolism, discussed below (After [17])
To correlate the putative modules obtained from our graph theory-based analysis to actual biochemical pathways, we concentrated on the pathways involving the pyrimidine metabolites. Our method divided these pathways into
14
Albert-L´ aszl´ o Barab´ asi, Erzs´ebet Ravasz, and Zolt´ an Oltvai
four putative modules (Fig. 10a), which represent a topologically well-limited area of E. coli metabolism (Fig. 9, circle).
L-3-amino2-methylbutanoate
2.1.3.2
N-carbamoylL-aspartate
3.1.3.6
3.5.1.6 3.5.4.13
3.5.2.3
2.7.4.14
UTP
CTP
dCDP
dCMP
3-ureido2-methylbutyrate
6.3.4.2
cytidine
dUMP
deoxyuridine
dCMP
dUDP
oxidized_glutaredoxin
dCDP
dUTP
CTP
dCTP
UTP
CDP
3.1.4.16
3’UMP
3.1.3.6
glutaredoxin
3.1.4.16
6.3.5.5
carbamoyl_phosphate
2’,3’-cUMP
3’CMP
UDP
L-glutamine
2.7.2.2
2’,3’-cCMP
carbamoyl_phosphate
(‘S‘)-dihydroorotate
UMP
CMP
uridine
uracil
cytidine
CO2
uridine
S-dihydroorotate
3.5.4.5 1.3.1.14
1.17.4.2
1.3.3.1
3.5.5.2
deoxycytidine
2.7.4.6
3.5.4.5
5,6-dihydrothymine
orotate
dCTP
2.7.1.48 2.4.2.3
2.7.4.6
2.4.2.10
3.2.2.10
1.3.1.2
2.4.2.4 2.7.1.48
CMP
3.5.4.1
orotidine_5P 4.1.1.23
uracil
2.4.2.9
thymine 3.5.4.13
2.4.2.1
2.7.4.4
UDP
4.2.1.70
2.4.2.2 2.4.2.4
CDP
dUTP
dUDP 2.7.4.6
2.7.4.14
1.3.1.2
3.5.4.12
2.7.1.21
3.6.1.23
1.17.4.2
2.7.4.14
UMP
2.7.4.-
pseudouridine_5P
deoxyuridine
2.7.4.6
2.4.2.2
cytosine
dUMP 2.7.4.9 2.1.1.45
thymidine 2.7.1.21
2.7.1.21
1.17.4.1
dTMP
5,6-dihydrouracil
TMP
2.4.2.9 3.5.2.2
1.17.4.1
3.5.1.6
’beta’-alanine
2.7.4.9
glutaredoxin
3-ureidopropionate
oxidized_glutaredoxin 5P-alpha-D-ribose1-diphosphate
dTDP
2.7.4.9
TDP
2.7.4.6
dTTP
TTP 1.17.4.2
Fig. 10. A detailed diagram of the metabolic reactions that surround and incorporate the pyrimidine metabolic module. Red boxes denote the substrates directly appearing in the reduced metabolism and the tree shown in Fig. 9. Substrates in green boxes are internal to pyrimidine metabolism, but represent members of non-branching pathways or end pathways branching from a metabolite with multiple connections [54]. Blue and black boxes show the connections of pyrimidine metabolites to other parts of the metabolic network. Black boxes denote core substrates belonging to other branches of the metabolic tree Fig. 8c, while blue boxes denote non-branching pathways (if present) leading to those substrates. The shaded boxes around the reactions highlight the modules suggested by the hierarchical tree. The shaded blue boxes along the links display the enzymes catalyzing the corresponding reactions, and the arrows show the direction of the reactions according to the WIT metabolic maps [29]. (After [17])
As shown in Fig. 10b, all highly connected metabolites (Fig. 10b, red boxes) correspond to their respective biochemical reactions within pyrimidine metabolism, together with those substrates that were removed during the original network reduction procedure, and then re-added (Fig. 10b, green boxes). However, it is also apparent that putative module boundaries do not always overlap with intuitive ‘biochemistry-based’ boundaries. For instance, while the synthesis of UMP from L-glutamine is expected to fall within a single module based on a linear set of biochemical reactions, the synthesis of UDP from UMP leaps pu-
Hierarchical Organization of Modularity
15
tative module boundaries. Thus, further experimental and theoretical analyses will be needed to understand the relationship between the decomposition of E. coli metabolism offered by our topology-based approach, and the biologically relevant sub-networks. The organization of metabolic networks is likely to combine a capacity for rapid flux reorganization with a dynamic integration with all other cellular function [2]. Our results indicate that the system-level structure of cellular metabolism is best approximated by a hierarchical network organization with seamlessly embedded modularity. In contrast to current, intuitive views of modularity (Fig. 1b) which assume the existence of a set of modules with a non-uniform size potentially separated from other modules, we find that the metabolic network has an inherent self-similar property: there are many highly integrated small modules, which group into a few larger modules, which in turn can be integrated into even larger modules. This is supported by visual inspection of the derived hierarchical tree (Fig. 8c, which offers a natural breakdown of metabolism into several large modules, which are further partitioned into smaller, but more integrated sub-modules.
5
Stochastic Model and Universality
The hierarchical model described in Fig. 3 predicts C(k) ∼ k −1 , which offers a rather good fit to three of the four C(k) curves shown in Fig. 5. The question is, is this scaling law (1) universal, valid for all hierarchical networks, or could different scaling exponent characterize the scaling of C(k)? Defining the hierarchical exponent, β, as (2) C(k) ∼ k −β , is β = 1 a universal exponent, or it’s value can be changed together with γ? In the following we demonstrate that the hierarchical exponent β can be tuned as we tune some of the network parameters. For this we propose a stochastic version of the model described in Fig. 3. We start again with a small core of five nodes all connected to each other (Fig. 3a) and in step one (n = 1) we make four copies of the five node module. Next, we randomly pick a p fraction of the newly added nodes and connect each of them independently to the nodes belonging to the central module. We use preferential attachment [12,13] to decide to which central node the selected nodes link to. That is, we assume that the probability that a selected node will � connect to a node i of the central module is ki / j kj , where ki is the degree of node i and the sum goes over all nodes of the central module. In the second step (n = 2) we again create four identical copies of the 25–node structure obtained thus far, but we connect only a p2 fraction of the newly added nodes to the central module. Subsequently, in each iteration n the central module of size 5n is replicated four times, and in each new module a pn fraction will connect to the current central module, requiring the addition of (5p)n new links. As Fig. 11 shows, changing p alters the slope of both P (k) and C(k) on a log–log plot. In general, we find that increasing p decreases the exponents γ and
16
Albert-L´ aszl´ o Barab´ asi, Erzs´ebet Ravasz, and Zolt´ an Oltvai
β (Fig. 11b,d). The exponent β = 1 is recovered for p = 1, i.e. when all nodes of a module gain a link. While the number of links added to the network changes at each iteration, for any p ≤ 1 the average degree of the infinitely large network is finite. Indeed, the average degree follows � � 8 3 1 − pn+1 + �k�n = , (3) 5 2 1−p which is finite for any p ≤ 1. 10
0
0
10
(a)
−1
10
(c)
−2
10
−1
10
−3 −4
10
C(k)
P(k)
10
−5
10
p=0.5 p=0.6 p=0.7 p=0.8 p=0.9 p=1.0
−6
10
−7
10
−8
10
p=0.5 p=0.6 p=0.7 p=0.8 p=0.9 p=1.0
−3
10
−9
10
−2
10
−4
10
1
2
3
10
10
10
10
4
1
2
10
3
10
k
10
10
4
k
6.0
2.0
(b)
(d)
1.8
5.0
1.6
γ
4.0
β
1.4
3.0 1.2
2.0 1.0 0.4
1.0
0.5
0.6
0.7
0.8
p
0.9
1.0
1.1
0.8 0.4
0.5
0.6
0.7
0.8
0.9
1.0
1.1
p
Fig. 11. The scaling properties of the stochastic model. (a) The degree distribution for different p values, indicating that P (k) follows a power law with a p dependent slope. (b) The dependence of the degree exponent γ on p, determined by fitting power laws to the curves shown in (a). The exponent γ appears to follow approximately γ(p) ∼ 1/p (dashed line). (c) The C(k) curve for different p values, indicating that the hierarchical exponent β depends on p. (d) The dependence of β on the parameter p. The simulations were performed for N = 57 (78,125) nodes (After [33])
Interestingly, the scaling of C(k) is not a unique property of the model discussed above. A version of the model, where we keep the fraction of selected nodes, p, constant from iteration to iteration, also generates p dependent β and γ exponents. Furthermore, recently several results indicate that the scaling of C(k) is an intrinsic feature of several existing growing networks models. Indeed, aiming to explain the potential origin of the scaling in C(k) observed for the Internet, VSPV note that the fitness model [55,56] displays a C(k) that ap-
Hierarchical Organization of Modularity
17
pears to scale with k. While there is no analytical evidence for C(k) ∼ k −β yet, numerical results [47,48] suggest that the presence of fitness does generate a hierarchical network architecture. In contrast, in a recent model proposed by Klemm and Eguiluz there is analytical evidence that the network obeys the scaling law (1) [57]. In their model in each time step a new node joins the network, connecting to all active nodes in the system. At the same time an active node is deactivated with probability p ∼ k −1 . The insights offered by the hierarchical model can help understand the origin of the observed C(k) ∼ k −1 . By deactivating the less connected nodes a central core emerges to which all subsequent nodes tend to link to. New nodes have a large C and small k, thus they are rapidly deactivated, freezing into a large C state. The older, more connected, surviving nodes are in contact with a large number of nodes that have already disappeared from the active list, and they have small C 1 . Finally, Szab´ o, Alava and Kert´esz have developed a rate equation method to systematically calculate C(k) for evolving networks models [59]. Applying the method to a model proposed by Holme and Kim [60] to enhance the degree of clustering coefficient C seen in the scale-free model [12], they have shown that the scaling of C(k) depends on the parameter p, which governs the rate at which new nodes connect to the neighbors of selected nodes, bypassing preferential attachment. As for p = 0 the Holme–Kim model reduces to the scale-free model, Szab´ o, Alava and Kert´esz find that in this limit the scaling of C(k) vanishes. These models indicate that several microscopic mechanisms could generate a hierarchical topology, just as several models are able to create a scale-free network [7,8].
6
Discussion and Outlook
The identified hierarchical architecture offers a new perspective on the topology of complex networks. Indeed, the fact that many large networks are scale-free is now well established. It is also clear that most networks have a modular topology, quantified by the high clustering coefficient they display. Such modules have been proposed to be a fundamental feature of biological systems [24,17], but have been discussed in the context of the WWW [61,31], and social networks as well [30,62]. The hierarchical topology offers a new avenue for bringing under a single roof these two concepts, giving a precise and quantitative meaning for the network’s modularity. It indicates that we should not think of modularity as the coexistence of relatively independent groups of nodes. Instead, we have many small clusters, that are densely interconnected. These combine to form larger, but less cohesive groups, which combine again to form even larger and even less interconnected clusters. This self-similar nesting of different groups or modules into each other forces a strict fine structure on real networks. 1
Note, however, that as new nodes tend to connect to nodes that were added to the network shortly before them, the model generates a close to one dimensional structure in time. See e.g. [58]
18
Albert-L´ aszl´ o Barab´ asi, Erzs´ebet Ravasz, and Zolt´ an Oltvai
For biological systems hierarchical modularity is consistent with the notion that evolution may act at many organizational levels simultaneously: the accumulation of many local changes, that affect the small, highly integrated modules, could slowly impact the properties of the larger, less integrated modules. The emergence of the hierarchical topology via copying and reusing existing modules [24] and motifs [23], a process reminiscent of the results of gene duplication [63,64], offers a special role to the modules that appeared first in the network. While the model of Fig. 4 reproduces the large-scale features of the metabolism, understanding the evolutionary mechanism that explains the simultaneous emergence of the observed hierarchical and scale-free topology of the metabolism, and its generality to cellular organization, is now a prime challenge. Most interesting is, however, the fact that the hierarchical nature of these networks is well captured by a simple quantity, the C(k) curve, offering us a relatively straightforward method to identify the presence of hierarchy in real networks. The law (1) indicates that the number and the size of the groups of different cohesiveness is not random, but follow rather strict scaling laws. The presence of such a hierarchical architecture reinterprets the role of the hubs in complex networks. Hubs, the highly connected nodes at the tail of the power law degree distribution, are known to play a key role in keeping complex networks together, playing a crucial role from the robustness of the network [65,66] to the spread of viruses in scale-free networks [67]. Our measurements indicate that the clustering coefficient characterizing the hubs decreases linearly with the degree. This implies that while the small nodes are part of highly cohesive, densely interlinked clusters, the hubs are not, as their neighbors have a small chance of linking to each other. Therefore, the hubs play the important role of bridging the many small communities of clusters into a single, integrated network. In many ways our study offers only a starting point for understanding the interplay between the scale-free, hierarchical and modular nature of real networks. While the C(k) curves offer a tool to unearth the presence of a hierarchy, it is unclear what are the minimal ingredients at the model level for such a hierarchy to emerge. Finally, the role of the geometrical factor, which appears to remove the hierarchy, needs to be elucidated. Further modeling and empirical studies should allow us to address these questions.
References 1. H. Jeong, B. Tombor, R. Albert, Z.N. Oltvai, A.-L. Barab´ asi: Nature 407, 651 (2000) 2. A. Wagner, D. A. Fell: Proc. R. Soc. Lond. B. Biol. Sci. 268, 1803 (2001) 3. H. Jeong, S. Mason, A.-L. Barab´ asi, Z. N. Oltvai: Nature 411, 41 (2001) 4. A. Wagner: Mol. Biol. Evol. 18, 1283 (2001) 5. R. Albert, H. Jeong, A.-L. Barab´ asi: Nature 401, 130 (1999) 6. F. Liljeros, C. R. Edling, L. A. N. Amaral, H. E. Stanley, Y. ˚ Aberg: Nature 411, 907 (2001) 7. R. Albert, A.-L. Barab´ asi: Rev. Mod. Phys. 74, 47 (2002)
Hierarchical Organization of Modularity 8. 9. 10. 11. 12. 13. 14. 15. 16. 17. 18. 19. 20. 21. 22. 23. 24. 25. 26. 27. 28. 29. 30. 31.
32. 33. 34. 35. 36. 37. 38. 39. 40. 41. 42. 43. 44. 45. 46. 47. 48. 49.
19
S. N. Dorogovtsev, J. F. F. Mendes: Adv. Phys. 51, 1079 (2002) P. Erd˝ os, A. R´enyi: Publ. Math. Debrecen 6, 290 (1959) B. Bollob´ as: Random Graphs (Academic Press, London 1985) D. J. Watts, S. H. Strogatz: Nature 393, 440 (1998) A.-L. Barab´ asi, R. Albert: Science 286, 509 (1999) A.-L. Barab´ asi, R. Albert, H. Jeong: Physica A 272, 173 (1999) M. E. J. Newman: Proc. Nat. Acad. Sci. U.S.A 98, 404 (2001) M. E. J. Newman: Phys. Rev. E 64, 016131 (2001) A.-L. Barab´ asi, H. Jeong, Z. N´eda, E. Ravasz, A. Schubert, T. Vicsek: Physica A 311, 590 (2002) E. Ravasz, A. L. Somera, D. A. Mongru, Z. N. Oltvai, A.-L. Barab´ asi: Science 297, 1551 (2002) H. Kitano: Science 295, 1662 (2002) Y. I. Wolf, G. Karev, E. V. Koonin: Bioessays 24, 105 (2002) D. A. Lauffenburger: Proc. Nact. Acad. Sci. U.S.A 97, 5031 (2000) C. V. Rao, A. P. Arkin: Annu. Rev. Biomed. Eng. 3, 391 (2001) N. S. Holter, A. Maritan, M. Cieplak, N. V. Feoroff, J. R. Banavar: Proc. Nact. Acad. Sci. U.S.A 98, 1693 (2001) S. S. Shen-Orr, R. Milo, S. Mangan, U. Alon: Nature Genet. 31 64 (2002) L. H. Hartwell, J. J. Hopfield, S. Leibler, A. W. Murray: Nature 402, C47 (1999) J. Hasty, D. McMillen, F. Isaacs, J. J. Collins: Nature Rev. Genet. 2, 268 (2001) U. Alon, M. G. Surette, N. Barkai, S. Leibler: Nature 397, 168 (1999) C. H. Schilling, D. Letscher, B. O. Palsson: J. Theor. Biol. 203, 229 (2000) S. Schuster, D. A. Fell, T. Dandekar: Nature Biotechnol. 18, 326 (2000) R. Overbeek et. al: Nucleic Acids Res. 28, 123 (2000) M. S. Granovetter: Am. J. Sociol. 78, 1360 (1973) G. W. Flake, S. Lawrence, C. L. Giles. In: Proceedings of the Sixth International Conference on Knowledge Discovery and Data Mining, August, 2000 (ACM, Boston) pp. 150 L. A. Adamic, E. Adar: Friends and neighbors on the web, preprint available at http://hpl.hp.com/shl/papers/web10/index.html (2000) E. Ravasz, A.-L. Barab´ asi: Phys. Rev. E, in press (2002) A.-L. Barab´ asi, E. Ravasz, T. Vicsek: Physica A 299, 559 (2001) S. N. Dorogovtsev, A. V. Goltsev, J. F. F. Mendes: Phys. Rev. E 65, 066122 (2002) S. Jung, S. Kim, B. Kahng: Phys. Rev. E 65, 056101 (2002) M. E. J. Newman: J. Stat. Phys. 101, 819 (2000) R. Albert, A.-L. Barab´ asi: Phys. Rev. Lett. 85, 5234 (2000) L. A. N. Amaral, A. Scala, M. Barth´el´emy, H. E. Stanley: Proc. Nact. Acad. Sci. U.S.A 97, 11149 (2000) R. Ferrer i Cancho, R. V. Sol´e: Proc. R. Soc. Lond. B 268, 2261 (2001) S. Yook, H. Jeong, A.-L. Barab´ asi: to be published (2002) M. Sigman, G. Cecchi: Proc. Nac. Acad. Sci. U.S.A 99, 1742 (2002) S. N. Dorogovtsev, J. F. F. Mendes: Proc. R. Soc. Lond. B. 268, 2603 (2001) J.-P. Eckmann, E. Moses: Proc. Nact. Acad. Sci. U.S.A 99, 5825 (2002) M. Faloutsos, P. Faloutsos, C. Faloutsos: Comput. Commun. Rev. 29, 251 (1999) Data available at http://moat.nlanr.net/infrastructure.html A. V´ azquez, R. Pastor-Satorras, A. Vespignani: Phys. Rev. E 65, 066130 (2002) A. V´ azquez, R. Pastor-Satorras, A. Vespignani: Internet topology at the router and autonomous system level, Los Alamos Archive cond-mat/0206084 (2002) R. Govindan, H. Tangmunarunkit. In: Proceedings of IEEE INFOCOM 2000, Tel Aviv, Israel, Vol. 3 (IEEE, Piscataway N. J. 2000) pp. 1371
20
Albert-L´ aszl´ o Barab´ asi, Erzs´ebet Ravasz, and Zolt´ an Oltvai
50. S. H. Yook, H. Jeong, A.-L. Barab´ asi: Proc. Nact. Acad. Sci. U.S.A 99, 13382 (2002) 51. S. H. Yook, Z. N. Oltvai, A.-L. Barab´ asi: submitted (2002) 52. P. D. Karp, M. Riley, S. M. Paley, A. Pellegrini-Toole, M. Krummenacker: Nucleic Acids Res. 30, 56 (2002) 53. M. B. Eisen, P. T. Spellman, P. O. Brown, D. Botstein: Proc. Nact. Acad. Sci. U.S.A 95, 14863 (1998) 54. Additional information is available at www.nd.edu/~ networks/cell/index.html. 55. G. Bianconi, A.-L. Barab´ asi: Europhys. Lett. 54 (4), 436 (2001) 56. G. Bianconi, A.-L. Barab´ asi: Phys. Rev. Lett. 86, 5632 (2001) 57. K. Klemm, V. M. Eguiluz: Phys. Rev. E 65, 036123 (2002) 58. A. V´ azquez, Y. Moreno, M. Bogu˜ na ´, R. Pastor-Satorras, A. Vespignani: Topology and correlations in structured scale-free networks, preprint (2002). 59. G. Szab´ o, M. Alava, J. Kert´esz: Structural transitions in scale-free networks, Los Alamos Archive cond-mat/0208551 (2002) 60. P. Holme, B. J. Kim: Phys. Rev. E 65, 026107 (2002) 61. S. Lawrence, C. L. Giles: Nature 400, 107 (1999) 62. D. J. Watts, P. S. Dodds, M. E. J. Newman: Science 296, 1302 (2002) 63. A. V´ asquez, A. Flamini, A. Martian, A. Vespignani: Phys. Rev. E 65, 066130 (2002) 64. R. V. Sol´e, R. Pastor-Satorras, E. D. Smith, T. Kepler: Santa Fe Institute Working Paper 01-08-041 available at http://www.santafe.edu/sfi/ publications/wpabstract/200108041 65. R. Albert, H. Jeong, A.-L. Barab´ asi: Nature 406, 378 (2000) 66. R. Cohen, K. Erez, D. ben Avraham, S. Havlin: Phys. Rev. Lett. 86, 3682 (2001) 67. R. Pastor-Satorras, A. Vespignani: Phys. Rev. Lett. 86, 3200 (2001)