Using Spectral Submap Matching with Opportunities for Long-Term Operation. Jan Oberländer, Arne Roennau. Department of Interactive Diagnosis and Service ...
© 2013 IEEE. Personal use of this material is permitted. Permission from IEEE must be obtained for all other uses, in any current or future media, including reprinting/ republishing this material for advertising or promotional purposes, creating new collective works, for resale or redistribution to servers or lists, or reuse of any copyrighted component of this work in other works. Digital Object Identifier: 10.1109/ICAR.2013.6766479 Online at: http://ieeexplore.ieee.org/xpl/articleDetails.jsp?tp=&arnumber=6766479
Hierarchical SLAM Using Spectral Submap Matching with Opportunities for Long-Term Operation Jan Oberl¨ander, Arne Roennau
R¨udiger Dillmann
Department of Interactive Diagnosis and Service Systems (IDS) FZI Research Center for Information Technology 76131 Karlsruhe, Germany {oberlaender,roennau} at fzi.de
Humanoids and Intelligence Systems Lab Institute for Anthropomatics Karlsruhe Institute of Technology 76128 Karlsruhe, Germany ruediger.dillmann at kit.edu
Abstract—We present a hierarchical SLAM approach which uses spectral registration of local submaps to close loops and to perform global localization after a restart. Using the FourierMellin Transform (FMT), we robustly register occupancy grid representations of local submaps and present methods which improve matching performance. We further show how good match candidates can be reliably detected even from scaleddown versions of the submaps, which significantly reduces the computation time. The spectral registration approach proves useful even in the presence of significant environmental changes due to the fact that it calculates a dense match, incorporating all observed information rather than a sparse set of features.
I.
I NTRODUCTION
Algorithms for Simultaneous Localization and Mapping have become widespread and mature over the past decade [1]. But in order to be completely autonomous, a mobile robot must do more than just build a map of its environment once and then use it in a read-only mode. First, it must be prepared to enter new areas at any time. Second, it has to be able to globally relocalize itself after it has got lost or been restarted in a different location. Third, when this location lies outside the territory known so far, it has to detect when it re-enters known areas and then perform map merging to obtain a globally consistent view. Fourth, as real environments will gradually change over time, the SLAM methods employed must be able to handle these cases even as the environment changes. In such cases, individual laser scans may not hold enough information to reliably perform loop closing or global localization, and more context must be taken into account. The present paper proposes, firstly, a hierarchical SLAM approach designed to meet these requirements. Its basis is a permanently running online SLAM algorithm which only keeps a limited history of recent sensor measurements, eventually forgetting older percepts as new percepts are added. Submaps are regularly stored as nodes of a high-level submap graph we call map collection, on which loop closing and global localization is performed. Whenever the robot is started, a new mapping session is added as an independent connected component and eventually linked to other components as matches between submaps are discovered. This way, the robot c 2013 IEEE 978-1-4799-2722-7/13/$31.00
always has a consistent, current, local map for navigation, which is useful even when the current mapping session is not linked to other parts of the map collection. Loop closing, map merging and global graph optimization can be performed lazily whenever CPU time is available. Secondly, we perform submap matching and registration using the Fourier-Mellin Transform for 2D gridmaps. Featurebased approaches could be used as well, but these tend to be tuned to a particular environment. For example, the features found in outdoor scans tend to differ significantly from those found in indoor scans. Also, it can be challenging to find enough features to reliably match individual scans, especially when the environment is changing. The strengths of dense spectral registration on gridmaps, on the other hand, are independence of the actual sensors used to create the gridmaps, and robustness in the presence of noise, environmental changes, and overlaps which are only partial. We show how to improve the FMT matching performance by running some preprocessing steps on the gridmap data, and how well FMT matching can be applied to scaled-down versions of the submaps to quickly find potential match candidates. The remainder of this paper is structured as follows: In Sec. II, we discuss related work. Sec. III describes our hierarchical map architecture. The Fourier-Mellin Transform is incroduced in Sec. IV and special considerations for matching occupancy grids are described. In Sec. V, we evaluate various aspects of the FMT matching performance on local submaps generated from well-known standard SLAM datasets, and show some results for loop closing and map merging. Finally, Sec. VI contains some concluding remarks and discusses future work. II.
R ELATED W ORK
Several other works exist which present hierarchical SLAM frameworks. Blanco et al. [2], [3] present a hybrid metrictopological approach which links local feature-based submaps, focusing on automatic clustering methods that partition an existing map into local submaps. The Atlas framework [4] is a more generic solution representing a topologically connected graph of local submaps that is similar to the one used here. Our approach differs in some ways: (a) it explicitly considers
© 2013 IEEE. Personal use of this material is permitted. Permission from IEEE must be obtained for all other uses, in any current or future media, including reprinting/ republishing this material for advertising or promotional purposes, creating new collective works, for resale or redistribution to servers or lists, or reuse of any copyrighted component of this work in other works. Digital Object Identifier: 10.1109/ICAR.2013.6766479 Online at: http://ieeexplore.ieee.org/xpl/articleDetails.jsp?tp=&arnumber=6766479
global relocalization scenarios by storing different, potentially unrelated mapping sessions in a map collection; (b) it incorporates a two-step matching method to more efficiently find matching submaps for loop closing and map merging; and (c) it explicitly stores timestamp information, which can be taken into account when calculating submap similarity in the presence of environment changes. There are a variety of dense, as opposed to feature-based, methods for merging maps using occupancy grid representations. [5] uses a hill-climbing approach with respect to a simple match metric. In [6] an adaptive random walk strategy is used to merge occupancy grids obtained by multiple robots. In the context of scan matching, [7] uses a robust method based on the Discrete Hough Transform. In recent years, spectral registration methods based on the Fourier-Mellin Transform [8] have gained in popularity, because in contrast to the approaches mentioned above, they have proven to be very robust, deterministic rather than random, not susceptible to local minima, and efficient by applying the Fast Fourier Transform. They have been used for visual odometry [9], RADAR matching [10] and image data taken from UAVs [11] and underwater vehicles [12]. Birk [13] has already applied FMT-based matching to whole grid maps in order to assess structural map errors with respect to a reference map. Our work expands on these spectral matching works and is the first to apply the FMT to grid-based submaps. We perform a more detailed evaluation in order to tune the matcher and to maximize matching performance in our scenario. We further show how FMT-based matching of scaled-down versions of the submaps is an efficient way of finding potential match candidates. III.
A RCHITECTURE FOR H IERARCHICAL SLAM
Our architecture outlined in this Section is similar to that presented in [4], but differs in that some special considerations for long-term operations are taken. We present a generic architecture for hierarchical SLAM which performs continuous local mapping to supply a high-level graph of local submaps. The mapping process is composed of the steps described below. Note that while certain representations and local SLAM algorithms are used in our current implementation, the framework itself is written in a generic manner that can be used with different algorithms and map representations. A. Local Mapping The basis of our architecture is a permanently running local mapper running a standard SLAM algorithm modified for continuous operation on a constant-size local environment model. As new scans are added to the live map, the oldest scan is removed to keep the scan memory at a constant size. Our current implementation is based on the well-known GMapping algorithm [14] modified so that old scans are eventually removed from the gridmap again. This is straightforward as the algorithm uses a simple endpoint sensor model, and the gridmap stores observation and hit counts separately. This allows a previously added scan to be removed simply by subtracting it from the gridmap.
B. Generating Local Submaps Whenever a specific fixed number of new scans have been processed by the local mapper, we generate a local submap in the form of an occupancy grid, which is then inserted as a node into the map collection, a high-level graph of local submaps. Each submap node stores an initial estimate of the submap’s global pose, the robot’s pose relative to the submap, a timestamp, and a UUID identifying the current mapping session. A new session UUID is created whenever the mapper is restarted. New mapping sessions are initially not connected to any other mapping sessions within the graph until enough matches are found to merge sessions with high enough confidence. C. Submap Processing for More Efficient Matching When closing a large loop with high pose uncertainty, or merging two mapping sessions with an unknown relative pose, a large number of submap pairs must potentially be compared to determine whether a match exists. To speed up calculations, we store digests of all local maps which are much smaller and allow for a quick initial comparison. Such digests could be collections of FLIRT features [15] extracted from the laser scans, or image descriptors such as SURF features [16] extracted from the occupancy grids. In this work, the digests are scaled-down versions of the occupancy grids. The feasibility of this approach is shown in Sec. V. D. Transparent Disk-backed Map Storage As the robot may accumulate maps over a very long period and purposely keeps map versions from different times, we do not store the complete map collection with all submaps in RAM. In our architecture, the entire submap graph can be serialized, and the submap nodes are designed to be transparently swapped out to disk. Only the much smaller digests are kept in RAM, and the full-resolution submaps are brought back into memory on demand, e. g. when a detailed comparison of match candidates is requested. IV.
S PECTRAL S UBMAP M ATCHING
The standard Fast Fourier Transform (FFT) can be used to efficiently recover the offset between two 2D signals related by a translation. Its advantage lies in the fact that while crosscorrelation in the time domain is expensive (O(N 2 ) for N discrete data points), it can be replaced by a simple O(N) piecewise multiplication in the frequency domain, and the Fourier Transform can be calculated efficiently in O(N log N). The Fourier-Mellin Transform (FMT), in turn, can be used if the transformation between the signals includes rotation and scale as well as translation components. A. The Fourier-Mellin Transform Given two signals f1 , f2 with f2 (x, y) = f1 (x − tx , y − ty ), their 2D Fourier Transforms are related by F2 (ξ , η) = e−j2π(ξ tx +ηty ) F1 (ξ , η) ,
(1)
i. e., the Fourier Transforms’ absolute value is translation invariant. A Phase-only Matched Filter (POMF) is used to recover the translation offset: In the inverse Fourier Transform
© 2013 IEEE. Personal use of this material is permitted. Permission from IEEE must be obtained for all other uses, in any current or future media, including reprinting/ republishing this material for advertising or promotional purposes, creating new collective works, for resale or redistribution to servers or lists, or reuse of any copyrighted component of this work in other works. Digital Object Identifier: 10.1109/ICAR.2013.6766479 Online at: http://ieeexplore.ieee.org/xpl/articleDetails.jsp?tp=&arnumber=6766479
↻β
Gridmap 1 (a)
(b)
(c)
(e) ↻β+π
Gridmap 2
(d)
(f)
(g)
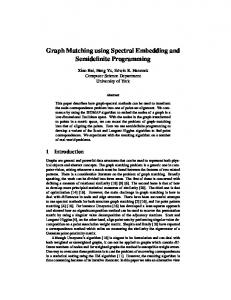
Fig. 1. Illustration of the FMT-based matching process. Given two input gridmaps (a), we calculate their FFT and apply a highpass filter (b) to bring out those components that aid the recovery of rotation and scale [9]. We then calculate the log-polar transform (c) and use the cross-power spectrum of the two signals (d) to recover rotation and scale (the strongest peak is circled in yellow). We then create the two resulting rotation candidates of map 2 (e) and calculate their cross-power spectra against the FFT of map 1 (f, cutout zoomed to 400 % for better peak visibility). The strongest peak is found in the upper candidate (circled in yellow) and delivers the translation parameters for the best transformation. Applying this transformation shows the result (g). Note that a clear peak is visible despite significant differences between the two gridmaps.
of the Cross-Power Spectrum of the two signals, the best translation is given by the location of the largest peak. The Fourier-Mellin Transform of a signal f in polar representation, M f , is given by a Fourier Transform on the angular coordinate and a Mellin Transform on the radial coordinate, and can be expressed as M f (u, v) =
1 2π
Z ∞ Z 2π −∞ 0
f (eρ , θ )e−j(uρ+vθ ) dθ dρ ,
(2)
which means its magnitude can be calculated from the magnitude of the Fourier Transform of f and by resampling it to log-polar coordinates [17]. Rotation and scaling differences between two original signals are thus reduced to phase differences in their Fourier-Mellin Transforms. The scale, rotation and translation parameters for a pair of occupancy grids are recovered as follows: 1)
2) 3)
4)
Preprocess the 2D signals to turn them seamless: Because the DFT assumes a periodic signal, highfrequency artifacts may result from differences along the border of the gridmaps. Blurring the signals cyclically along the edges removes these artifacts. Calculate the FMT of both signals, and use a Phaseonly Matched Filter to find the best rotation and scale. Rotate and scale one of the two gridmaps according to the parameters discovered in the previous step. Because the frequency spectrum for real-valued inputs is symmetric, a 180◦ ambiguity remains, which means that two rotations (β and β + π) must be tested. Find the best translation between the first original signal and the second, rotated and scaled, original signal using a Phase-only Matched Filter. The strongest peak location represents the final solution.
The work by Kazik et al. [9] provides a convenient explanatory diagram for this workflow. Fig. 1 shows the application of these steps to a pair of local gridmaps. In our software, we represent the submaps as grayscale images and implement the matcher using OpenCV [18].
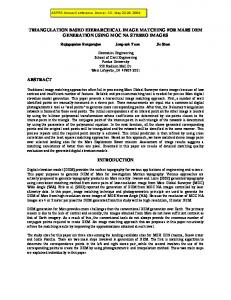
B. Comparing Gridmaps We now outline how we use FMT-based matching to register occupancy grids. Some special considerations need to be made because occupancy grids differ from camera images, to which FMT registration is usually applied, in a number of ways. 1) Unobserved space: Grid cells can have different occupancy probabilities, but they can also be completely unobserved. Unobserved cells should have no, or as little as possible, influence on the best matching result. A simple solution, which worked well in our tests, is to treat unobserved cells the same as free cells. A different, more robust, approach is the Masked FFT registration algorithm [19] where only observed cells influence the matching result. We plan to evaluate this approach in the future. 2) Limited angular resolution: For grids generated from laser data, obstacles tend to be very thin due to the high precision of laser scanners or the fact that simple endpoint beam models are used for faster rendering. For such thin obstacles, the correlation peak quickly becomes less pronounced if the rotation estimate is only slightly off, as illustrated in Fig. 2. One way to improve the angular as well as the translation resolution is to calculate a subpixel-precision estimate of the exact peak position (see, for example, [20] for an overview of some methods). We chose to calculate the center of mass of the correlation values in a fixed-size square neighborhood of radius r around the peak. Let q(u, v) be the Phase-only Matched Filter for the two 2D signals representing the gridmaps, with a peak at integer position (u, ˆ v). ˆ Then the center of mass is given by CoMr (u, ˆ v) ˆ =
∑(x,y)∈Ωr x · q(uˆ + x, vˆ + y) , ∑(x,y)∈Ωr q(uˆ + x, vˆ + y) ! ∑(x,y)∈Ωr y · q(uˆ + x, vˆ + y) , vˆ + ∑(x,y)∈Ωr q(uˆ + x, vˆ + y) uˆ +
(3)
where Ωr = (−r, . . . , r) × (−r, . . . , r). In this work we consider no subpixel precision and radii of 1 and 2 (i. e., modes CoM0 ,
© 2013 IEEE. Personal use of this material is permitted. Permission from IEEE must be obtained for all other uses, in any current or future media, including reprinting/ republishing this material for advertising or promotional purposes, creating new collective works, for resale or redistribution to servers or lists, or reuse of any copyrighted component of this work in other works. Digital Object Identifier: 10.1109/ICAR.2013.6766479 Online at: http://ieeexplore.ieee.org/xpl/articleDetails.jsp?tp=&arnumber=6766479 0.7◦ Rotation
0.35◦ Rotation
0.35◦ Rotation, Subpixel Precision
0.6
0.6
0.6
0.4
0.4
0.4
0.2
0.2
30 0
20 10
20
10 30 0
0.2
30 0
20 10
20
10 30 0
30 0
20 10
20
10 30 0
Fig. 2. Illustration of the effect of limited angular resolution and the improvement achieved by subpixel-precision peak estimation. A sample 512 × 512 pixel image depicting a triangle drawn with a stroke width of one pixel was rotated by 0.7◦ (left) and 0.35◦ (middle/right). The angular resolution for the given image size is 360◦ /512 ≈ 0.703◦ . The thin structures mean that the discretization error for the estimated rotation leads to a significantly less pronounced translation peak (0.263 instead of 0.562), suggesting that occupancy grid registration is sensitive to small rotation errors. By calculating a subpixel-precision estimate for the rotation angle, the peak can be significantly improved (right, 0.681).
CoM1 , CoM2 ). We further consider two other approaches, namely 1) 2)
thickening all obstacles by one pixel by applying a morphological erosion operator on the grayscale images, and alternatively applying a Gaussian blur with a one-pixel radius to the grayscale images.
In order to maximize peak strength, the grayscale images are normalized in both cases. We evaluate the performance of these different approaches in Section V. 3) Ambiguous matches: Typical indoor environments, especially office environments, tend to possess repetitive structures such as adjacent rooms with nearly identical layouts. This can lead to matching ambiguities and even multiple valid registration hypotheses for every pair of submaps, especially when the matching algorithm is to take into account the possibility of environmental changes. Due to only partial overlaps between maps, noise, quantization effects, repetitive structures and environmental changes, it is not always enough to simply examine the best rotation peak when looking for a good match. Instead, we evaluate all rotation peaks whose strength is at least 90 % of the strongest peak. The resulting candidate translations are then ordered by their correlation peak strength. All hypotheses exceeding a specific threshold are kept and can later be filtered down to a consistent subset with, for example, a RANSAC-based approach. Over time, submaps of the same environment may differ more and more due to environmental changes. Using the timestamp information, the matching threshold can therefore be reduced as the age difference between submaps increases. V.
E VALUATION
In our work, we use FMT-based matching in two ways. First, we apply it to scaled-down versions of the stored local submaps in order to quickly find match candidates. Second, we calculate a match for these candidates at full resolution.
tesy D. Fox), albert-b-laser and fr079 (both courtesy C. Stachniss). A. Match Detection Performance In order to evaluate the match detection performance, we first calculated global reference maps close to actual ground truth in an automatic fashion. We mapped each dataset using our GMapping [14] based mapper using a large number of particles. The resulting corrected trajectory was used to build ground-truth versions of the submaps to be tested. Afterwards, we performed a separate SLAM run using much fewer particles to obtain independent submaps, which we then matched using our FMT-based matcher. We use submaps of 768 × 768 cells at a grid cell resolution of 5 cm. The matcher detects a match when the correlation peak strength exceeds a certain threshold. In our evaluation, we expect a positive detection for any submap pairs which, according to the ground truth, overlap by 40 % or more. We further expect a negative detection (i. e., no match should be found) for any submap pairs which have at most 10 % overlap. Based on this information we compare all submap pairs and calculate Precision/Recall curves. For our submaps, we added one scan every 0.5 m or 30◦ . The number of scans making up one submap will play a role in matching performance, as more context for matching will reduce ambiguities. We therefore compare variants with 20, 40 and 80 scans per submap. We store submaps every 5, 10 or 20 scans, respectively, so that there is a 75 % overlap between consecutive submaps’ sensor data. This sliding window approach provides a better chance to find good matches for loop closing as it becomes more likely that a similar view is available. Note, however, that in our performance evaluation we do not include trivial self-matches and trivial matches between consecutive submaps sharing the same sensor data, as this would skew the results.
In the following, we first evaluate how well scaled-down submap representations can be compared using the FMT approach. We then evaluate the matching performance at full resolution, comparing a number of different preprocessing steps and the effect of subpixel-precision estimation.
The first question to answer is whether the various image preprocessing methods and subpixel-precision matching described in Sec. IV-B2 improve match detection performance. In Fig. 3 we compare unprocessed full-resolution submaps with 40 scans per submap using different subpixel calculation radii (CoM0 , CoM1 , CoM2 , cf. Eq. 3). While more context improves the detection performance as expected, subpixel precision does not exhibit noticeably different behavior.
All evaluations are performed using a number of datasets available online from the Radish repository [21]: intel (cour-
We next inspect whether preprocessing the submaps by thickening or blurring obstacles has a positive effect. Using
© 2013 IEEE. Personal use of this material is permitted. Permission from IEEE must be obtained for all other uses, in any current or future media, including reprinting/ republishing this material for advertising or promotional purposes, creating new collective works, for resale or redistribution to servers or lists, or reuse of any copyrighted component of this work in other works. Digital Object Identifier: 10.1109/ICAR.2013.6766479 Online at: http://ieeexplore.ieee.org/xpl/articleDetails.jsp?tp=&arnumber=6766479 Context: 40 Scans
Context: 80 Scans
Erosion, CoM1 , 20 Scans 1.0
0.9
0.9
0.8
0.8
Recall
1.0
0.7 0.6 0.5 0.5
CoM0
CoM0
CoM0
CoM1
CoM1
CoM1
CoM2
CoM2
0.6
0.7
0.8
0.9
1.0
0.5
0.6
Precision
0.8
0.9
1.0 0.5
0.6
Precision
0.7
0.8
0.9
1.0
Context: 40 Scans
Context: 80 Scans
0.6
100% 50% 25% 12.5% 6.25%
0.7
0.8
0.9
1.0
0.5
0.6
100% 50% 25% 12.5% 6.25%
0.7
0.8
0.9
1.0 0.5
0.6
0.7
0.8
0.9
1.0
Precision
Precision
Blurring, CoM1 , 20 Scans
Blurring, CoM1 , 40 Scans
Blurring, CoM1 , 80 Scans
1.0 0.9 0.8 0.7 100% 50% 25% 12.5% 6.25%
0.5
0.9
Erosion, CoM1 , 80 Scans
Precision
0.6
1.0
Recall
0.5
Precision
Fig. 3. Precision/Recall plots for match detection on the intel dataset, using different subpixel precision methods (CoM0 = none, CoM1 , CoM2 ; cf. Eq. (3)), for different numbers of scans per submap. See Fig. 8 for a rendering of the complete dataset. Note the lower left corner is at 0.5. Context: 20 Scans
100% 50% 25% 12.5% 6.25%
0.5
CoM2
0.7
Erosion, CoM1 , 40 Scans
0.7 0.6
Recall
Recall
Context: 20 Scans
0.5
0.6
100% 50% 25% 12.5% 6.25%
0.7
0.8
0.9
1.0
Precision
0.8
0.5
0.6
100% 50% 25% 12.5% 6.25%
0.7
0.8
0.9
1.0
Precision
0.5
0.6
0.7
0.8
0.9
1.0
Precision
0.7 0.6
none Erosion Blurring
0.5 0.5
0.6
0.7
none Erosion Blurring
0.8
0.9
1.0
0.5
0.6
Precision
0.7
Fig. 5. Precision/Recall plots for match detection using scaled-down submap images. Upper row: erosion before scaling; lower row: Gaussian blurring before scaling.
none Erosion Blurring
0.8
Precision
0.9
1.0 0.5
0.6
0.7
0.8
0.9
1.0
Precision
Fig. 4. Precision/Recall plots for match detection on the intel dataset, using different preprocessing methods (none, erosion, blurring) and CoM1 subpixel precision, for different numbers of scans per submap. Either preprocessing method improves performance, with blurring being slightly better.
the same submaps as in Fig. 3, we now compare the effect of erosion or blurring submaps, with or without subpixel precision. As can be seen in Fig. 4, both preprocessing methods improve performance. We then investigate the detection performance at reduced submap scales. The submap resolution is halved repeatedly by first either eroding or blurring obstacles as before, then scaling down by 50 %, and then normalizing the image intensities. Fig. 5 shows the detection performance for submaps at reduced resolutions of 50 % (10 cm/cell), 25 % (20 cm), 12.5 % (40 cm) and 6.25 % (80 cm). In general, match detection interestingly performs better at reduced scales, and erosion tends to deliver better performance than blurring. Performance only begins to drop at the smallest scale, but is still acceptable in combination with erosion. Finally, we inspect the runtime performance of the FMT matcher at reduced map scales. Table I shows the average calculation times per map pair from a comparison of 975 pairs. The matcher is configured to inspect up to six different peaks, more than necessary in all datasets we examined. At the smallest scale, we can inspect 92 submap pairs per second, which is adequate for online loop closing. B. Registration Performance Once we find that a submap pair is a candidate for a match, we perform FMT-based registration at full resolution. We need to select a correlation peak threshold above which the correct
TABLE I. FMT M ATCHER RUNTIME E VALUATION (I NTELr C ORE TM I 7-2820QM CPU @ 2.30GH Z , SINGLE CORE ) Scale
Resolution
100 % 50 % 25 % 12.5 % 6.25 %
768 × 768 384 × 384 192 × 192 96 × 96 48 × 48
Time/975 map pairs 1068.9 s 223.638 s 68.352 s 21.216 s 10.536 s
Time/pair 1.096 s 0.229 s 0.070 s 0.022 s 0.011 s
transformation is recovered. We evaluate the registration performance as follows: We inspect the median and maximum translation and rotation errors for different thresholds. We consider a threshold suitable if all matches are successfully registered with a pose error below 0.5 m and 10◦ . At the same time, the more submap pairs we can register successfully, the better the overall registration performance. I. e., the higher the matcher’s recall rate (registered submap pairs with over 40 % ground-truth overlap) and the lower the maximum pose error, the better the matcher’s performance. Fig. 6 compares the registration performance for different amounts of scans per submap, and for different subpixel-precision levels. The diagrams show that more context improves performance, and also that the maximum error tends to be best for CoM1 subpixel-precision matching. For large context sizes (80 scans in our tests), we see that the median translation error increases again. This is because the local submaps, which tend to have no internal loop closures, are deformed due to odometry and scan-matching errors. This indicates that a smaller context should be used. For a context of 40 scans per submap, Fig. 7 compares the performance for the preprocessing steps explained in Sec. IV-B2. We can see that the erosion operator significantly improves the recall rate at which all registrations are successful. We achieve a maximum error of less than 0.5 m and 4◦ at a recall rate of over 80 %.
© 2013 IEEE. Personal use of this material is permitted. Permission from IEEE must be obtained for all other uses, in any current or future media, including reprinting/ republishing this material for advertising or promotional purposes, creating new collective works, for resale or redistribution to servers or lists, or reuse of any copyrighted component of this work in other works. Digital Object Identifier: 10.1109/ICAR.2013.6766479 Online at: http://ieeexplore.ieee.org/xpl/articleDetails.jsp?tp=&arnumber=6766479
100
10−1 0.0
0.2
0.4
0.6
0.8
CoM0
1-Recall
101 100
10−1 0.0
0.2
0.4
0.6
0.8
0.2 CoM2
0.4
0.6
0.8
1.0
0.0 CoM1
102 101 100 0.2 CoM2
0.4
0.6
100
10−1 0.0
0.2
0.4
0.6
1-Recall
0.8
1.0 CoM0
0.0 CoM1
101 100
10−1 10−2
0.0
0.2
0.4
0.6
1-Recall 103
0.8
1.0
103
0.8
1.0 none
0.0 blur
102 101 100 0.2 erode
0.4
0.6
0.8
1.0
10−1
1-Recall
Fig. 7. Submap registration performance for the intel dataset for different preprocessing methods at 40 scans/submap. The erosion method produces the best maximum error. The median error at 50 % recall is only about 3 cm and 0.8◦ – the dashed line indicates the worst-case performance (a value rarely provided in other publications) which is below 40 cm and 4◦ .
10−1
1-Recall
80 Scans, Preprocessing: none
101
10−1
1-Recall
103
Rotation error [deg]
Translation error [m]
1.0 CoM0
1-Recall 102
10−2
CoM1
100
40 Scans, Preprocessing: none
102
10−2
0.0
101
Rotation error [deg]
Translation error [m]
1.0
102
40 Scans, CoM1
102
Rotation error [deg]
101
10−2
103
Translation error [m]
20 Scans, Preprocessing: none
102
Rotation error [deg]
Translation error [m]
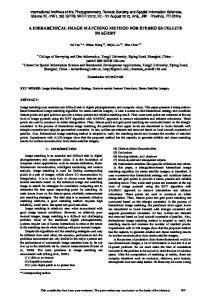
Fig. 9. Merging the albert-b dataset (2005, shown in blue) into the older fr079 dataset (2003, shown in red) [21]. Left: a submap is found to consistently match a number of submaps within fr079, but given the age difference, the evidence is not considered strong enough. Middle: the next submap confirms the match, providing more evidence. Right: the resulting alignment of the two mapping sessions after optimization. Note the significant differences between the two maps – almost all the furniture has moved, which would be a challenge to match from individual scans or point cloud features.
102 101 100 0.2 CoM2
0.4
0.6
0.8
1.0
10−1
1-Recall
Fig. 6. Submap registration performance for the intel dataset for different context sizes and subpixel precision modes. The plots compare the recall rate to the median (solid lines) and maximum (dashed lines) translation and rotation errors for varying thresholds. The gray horizontal lines indicate the desired maximum registration errors. Performance is better if the curves move towards the lower left corner. Subpixel-precision matching improves the worst-case error significantly.
C. Spectral Matching for Loop Closing and Long-Term Operation As suggested by the performance data, our FMT-based matching proves useful for both loop closing and global localization. Fig. 8 shows the result of loop closing the intel dataset and then using GTSAM [22] to optimize the submap graph. Since the FMT matcher is quite robust to environmental
Fig. 8. Left: Map built from a graph of 270 local submaps containing 20 scans each, where the submaps were built using 10 particles. Here, matches were sought between all pairs of submaps. Green lines represent successful matches between submaps (darker colors for higher likelihoods). After inserting loopclosing edges, the graph was optimized using GTSAM [22]. Right: map for the same dataset, built with a standard particle filter approach using 10 particles, for comparison. Note the distorted shape and the inconsistencies, for example in the highlighted regions.
changes, we also applied it to merge two datasets from the Radish repository, fr079 and albert-b-laser, which show parts of the same environment, but were taken about two years apart. We first mapped fr079 and performed loop closing and optimization. Then, we map albert-b and continuously attempt to match its submaps to the fr079 session. Eventually, reliable
© 2013 IEEE. Personal use of this material is permitted. Permission from IEEE must be obtained for all other uses, in any current or future media, including reprinting/ republishing this material for advertising or promotional purposes, creating new collective works, for resale or redistribution to servers or lists, or reuse of any copyrighted component of this work in other works. Digital Object Identifier: 10.1109/ICAR.2013.6766479 Online at: http://ieeexplore.ieee.org/xpl/articleDetails.jsp?tp=&arnumber=6766479
matches are found, and once enough evidence is accumulated, the two sessions are linked, despite significant changes in appearance, as the datasets were recorded about two years apart. Fig. 9 shows the result. VI.
C ONCLUSIONS
We presented a hierarchical SLAM framework which uses spectral matching based on the Fourier-Mellin Transform to perform loop closing and global localization on a graph of submaps represented by occupancy grids. The evaluation shows that the approach is feasible, robust (maximum errors below 0.5 m and 4◦ at a recall rate of 80 %) and efficient. Being gridmap-based, the method is independent of the specific sensors used. A downside is that the approach does not lend itself to faster, sublinear matching approaches [23] as an exhaustive search for matches has to be conducted. But the robustness of the FMT-based matcher means that correct matches found even when the compared maps show significant differences. By applying the same algorithm to scaled-down map thumbnails first, a larger collection of submaps can be screened quickly for good matches. The method shows good results when comparing log data recorded on different robots over the course of two years. In order to further improve gridmap registration, we plan to integrate the Masked FFT approach [19] so that unobserved areas of the gridmaps do not influence the registration process. Future plans include additional evaluation specifically investigating the case of changing environments, and the inclusion in a life-long mapping framework suitable for use on a live mobile robotic system.
[7]
[8]
[9]
[10]
[11]
[12]
[13]
[14]
[15]
[16]
[17]
R EFERENCES [1] [2]
[3]
[4]
[5]
[6]
S. Thrun, W. Burgard, and D. Fox, Probabilistic Robotics. The MIT Press, 2005. J. L. Blanco, J. Gonz´alez, and J.-A. Fern´andez-Madrigal, “Subjective Local Maps for Hybrid Metric-Topological SLAM,” Robotics and Autonomous Systems, vol. 57, pp. 64–74, 2009. J. L. Blanco, J.-A. Fern´andez-Madrigal, and J. Gonz´alez, “Toward a Unified Bayesian Approach to Hybrid Metric–Topological SLAM,” IEEE Transactions on Robotics, vol. 24, no. 2, pp. 259–270, April 2008. M. Bosse, P. Newman, J. Leonard, M. Soika, W. Feiten, and S. Teller, “An Atlas Framework for Scalable Mapping,” in Proceedings of the 2003 IEEE International Conference on Robotics and Automation, 2003, pp. 1899–1906. B. Yamauchi and P. Langley, “Place Recognition in Dynamic Environments,” Journal of Robotic Systems, vol. 14, no. 2, pp. 107–120, February 1997. A. Birk and S. Carpin, “Merging Occupancy Grid Maps from Multiple Robots,” Proceedings of the IEEE, vol. 94, no. 7, pp. 1384–1397, July 2006.
[18] [19] [20]
[21] [22]
[23]
A. Censi, L. Iocchi, and G. Grisetti, “Scan Matching in the Hough Domain,” in Proceedings of the 2005 IEEE International Conference on Robotics and Automation, 2005, pp. 2739–2744. B. S. Reddy and B. N. Chatterji, “An FFT-based Technique for Translation, Rotation, and Scale-invariant Image Registration,” IEEE Transactions on Image Processing, vol. 5, no. 8, pp. 1266–1271, August 1996. T. Kazik and A. H. G¨okto˘gan, “Visual Odometry Based on the FourierMellin Transform for a Rover Using a Monocular Ground-Facing Camera,” in IEEE International Conference on Mechatronics, April 2011, pp. 469–474. P. Checchin, F. G´erossier, C. Blanc, R. Chapuis, and L. Trassoudaine, “Radar Scan Matching SLAM Using the Fourier-Mellin Transform,” in Field and Service Robotics, ser. Springer Tracts in Advanced Robotics, A. Howard, K. Iagnemma, and A. Kelly, Eds. Springer Berlin/Heidelberg, 2010, vol. 62, pp. 151–161. H. B¨ulow and A. Birk, “Fast and Robust Photomapping with an Unmanned Aerial Vehicle (UAV),” in Proceedings of the 2009 IEEE/RSJ International Conference on Intelligent Robots and Systems, 2009, pp. 3368–3373. M. Pfingsthorn, A. Birk, S. Schwerdtfeger, H. B¨ulow, and K. Pathak, “Maximum Likelihood Mapping with Spectral Image Registration,” in Proceedings of the 2010 IEEE International Conference on Robotics and Automation, 2010, pp. 4282–4287. A. Birk, “Using Recursive Spectral Registrations to Determine Brokenness as Measure of Structural Map Errors,” in Proceedings of the 2010 IEEE International Conference on Robotics and Automation, May 2010, pp. 3472–3477. G. Grisetti, C. Stachniss, and W. Burgard, “Improved Techniques for Grid Mapping with Rao-Blackwellized Particle Filters,” IEEE Transactions on Robotics, vol. 23, no. 1, pp. 34–46, 2007. G. D. Tipaldi and K. O. Arras, “FLIRT – Interest Regions for 2D Range Data,” in Proceedings of the 2010 IEEE International Conference on Robotics and Automation, May 2010, pp. 3616–3622. H. Bay, A. Ess, T. Tuytelaars, and L. van Gool, “Speeded-Up Robust Features (SURF),” Computer Vision and Image Understanding, vol. 110, pp. 346–359, 2008. H. B¨ulow, A. Birk, and V. Unnithan, “Online Generation of an Underwater Photo Map with Improved Fourier Mellin Based Registration,” in OCEANS 2009, May 2009, pp. 1–6. G. Bradski, “The OpenCV Library,” Dr. Dobb’s Journal of Software Tools, 2000. D. Padfield, “Masked Object Registration in the Fourier Domain,” IEEE Transactions on Image Processing, vol. 21, no. 5, pp. 2706–2718, 2012. R. B. Fisher and D. K. Naidu, “A Comparison of Algorithms for Subpixel Peak Detection,” in Image Technology: Advances in Image Processing, Multimedia and Machine Vision, J. L. C. Sanz, Ed. Springer Berlin/Heidelberg, 1996, pp. 385–404. A. Howard and N. Roy, “The Robotics Data Set Repository (Radish),” 2003. [Online]. Available: http://radish.sourceforge.net/ F. Dellaert, “Factor Graphs and GTSAM: A Hands-on Introduction,” Georgia Institute of Technology, Tech. Rep. GT-RIM-CP&R-2012-002, September 2012. G. D. Tipaldi, L. Spinello, and W. Burgard, “Geometrical FLIRT Phrases for Large Scale Place Recognition in 2D Range Data,” in Proceedings of the 2013 IEEE International Conference on Robotics and Automation, May 2013.