Existence of Hierarchies and Human’s Pursuit of Top Hierarchy Lead to Power Law Shuiyuan Yu1, Junying Liang2, Haitao Liu2
Abstract The power law is ubiquitous in natural and social phenomena, and is considered as a universal relationship between the frequency and its rank for diverse social systems. However, a general model is still lacking to interpret why these seemingly unrelated systems share great similarity. Through a detailed analysis of natural language texts and simulation experiments based on the proposed ‘Hierarchical Selection Model’, we found that the existence of hierarchies and human’s pursuit of top hierarchy lead to the power law. Further, the power law is a statistical and emergent performance of hierarchies, and it is the universality of hierarchies that contributes to the ubiquity of the power law. Keywords: power law, hierarchy, exponent of power law, frequency rank, Zipf’s law 1
Introduction
The frequency and its rank of numerous natural and man-made phenomena can be described as the power-law relationship p(r ) ~ r , where p is the frequency of the occurrence, r indicates the frequency rank, and the constant α is referred to as the power-law exponent. Research has documented a large number of phenomena that follow the power law, such as the city populations [1,2], individual wealth [3,4], firm sizes [5], the frequency of occurrence of personal names [6], the number of citations received by papers [7], the scale of war [8], the sales volume of books, music disks [9], market fluctuations[10], moon craters [11], the numbers of species in biological taxa [12], energy released in earthquakes [13] and so on [a review see 14]. According to incomplete statistics, about 800 articles and monographs have been published [15] by June 2011. Among all different interpretations of the relationship, of great fame is Zipf's law [1], theorizing that in texts of human language, the frequency of a word has an inverse proportion to its rank. Approaches differ in this line of research. Some studies have investigated particular phenomena associated with specific areas [16-21], whereas others propose several 1
School of Computer, Communication University of China, Beijing, 100024, P.R. China. 2 Department of Linguistics, Zhejiang University, Hangzhou, 310058, P.R. China.
To whom correspondence should be addressed. E-mail:
[email protected] 1
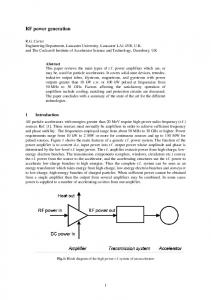
mechanisms to account for these phenomena [22-25]. However, most of these mechanisms have only introduced an abstract model, without providing solid explanations related with general phenomena. Moreover, some fundamental questions still remain open for discussion. One key question is what kind of universality is reflected in the power law. Specifically, does the frequency rank in the power law only represent the rank of the frequency, or is it related with the meaning of the power law? What is the significance of the power-law exponent α? What factors contribute to the change of the power-law exponent? To explore the above questions, this study proposed the Hierarchical Selection Model by examining a large pool of natural language texts. To anticipate, this model can explain the meaning of the power law exponent and almost all of the frequency-rank relationships, and provide a controlling method for the power law system. These explanations have gained support from previous research, and the predications of this model are broadly in line with the natural and social phenomena. We found that for diverse phenomena in human society, the existence of hierarchies and human’s preference for top hierarchy lead to the power law. In other words, the power law is a statistical and emergent performance of hierarchies. Given that “It is a commonplace observation that nature loves hierarchies” [26], the power law also possesses the characteristics of popularity and universality. 2 Text analysis and the linguistic meaning of power law Words in text are sequenced according to rules and purposes. Some words, such as function words, can appear in texts of any topic, whereas many content words only appear in texts of associated topics, suggesting that the distribution frequency of a word is associated with topics it can appear in. It is likely that the frequency rank is also correlated with topics. In the present study, we chose short news reports with different topics as the pool of texts data in order to explore the influence of topic number that a word can appear in upon the word frequency distribution, and to further investigate the significance of word frequency rank. The pool of texts data is composed of 10,287,433 word tokens, with 138,243 word types. The texts include 8 topic subsets, namely, IT, health, sports, tourism, education, employment, history and military. Each subset contains about 1990 short Chinese news reports. Table 1 is an overview of the texts and the eight topics, specifically, the word number, cumulative word frequency in topics, and their respective power-law fitness results between the word frequency and its rank of each topic and the collection of all texts. Here, the curve fitting was obtained by using the method of least squares. The results include the goodness of fit (Adjusted R2) and the power law coefficients. This method was adopted in the following power-law fit. Figure 1 depicts the curves of log-log coordinate of the word frequency of total texts and texts of each topic with their corresponding frequency rank. 2
Table 1 A Summary of Statistics of Eight topics and All Texts Power-law Fitness Topics
Word
Word Frequency Exponent
Goodness (Adjusted R2)
IT
30, 060
860, 344
-1.491
0.9732
Health
38, 854
1, 300, 509
-1.532
0.9687
Sports
24, 968
717, 225
-1.485
0.9713
Tourism
46, 513
1, 009, 260
-1.4
0.9722
Education
44, 667
1, 586, 666
-1.521
0.9769
Employment 37, 077
1, 422, 806
-1.519
0.9752
History
70, 968
2, 170, 285
-1.464
0.9704
Military
37, 132
1, 220, 338
-1.532
0.9716
Collection
138, 243
10, 287, 433
-1.705
0.9716
Word Frequency
10
10
10
6
Topic1 Topic2 Topic3 Topic4 Topic5 Topic6 Topic7 Topic8 Collection
4
2
0
10 0 10
10
2
10
4
10
6
Rank
Fig. 1. The log-log coordination curves of the relationship between the word frequency and its rank in texts of 8 topics and texts collection.
The relationships between the word frequency and its rank in topics texts and texts collection both follow the power law, with the exponent α close to 1.5. However, the exponent of the collection is around 1.7, evidently higher than all the subsets. Words have their own distinctive contexts of occurrence in that some words appear in contexts of any topic, and are generally high in word frequency but low in word frequency rank; whereas some other words appear only in a few topics, and in general have a low word frequency but a high frequency rank. Apparently, the frequency rank of a word is associated with the number of topics this word appears in. As shown in Figure 2, the horizontal axis is the word frequency rank, and the vertical axis is the probability density. Eight curves represent the number distribution of topics a word belongs to (hereinafter referred to as 'the number of topics', abbreviated as ‘NT’). Curve 8 indicates that this word appears in all topics, regardless of any specific topic. Curve 1 indicates that this word is only used in one topic, a highly topic-specific word. As plotted is the estimated density of the number of topics for a word using a kernel smoothing method [27]. Clearly, the number of words in each field concentrated on the locations reversely 3
ordered in the rank of word frequency, implicating that the rank of word frequency is correlated with the NT.
Fig. 2. The estimated density function of the number of topics distributing in word frequency rank. Eight distributions of NT are in sequence on the axis of Rank, indicating that the frequency rank also has the meaning of NT.
To examine the nature of the NT, we calculated the number of words in each field, the average word frequency rank, and the power-law fitting results of word frequency distribution in each field. Table 2 The distribution of various types of word. The meaning of the second column (Average word frequency rank), as previously mentioned in Fig.2, is that the average word frequency rank of each NT has a monotonic sequence, suggesting that there exists a correlation between NT and the rank; The third column (Number of words) indicates that NT has an inversed relationship with the number of words this NT has. The fifth column (Word frequency percentage) reveals that most words constituting a text are chosen from the NT=8 subset. The last two columns manifest that the word frequency in each NT follows the power law quite well.
The NT
Average word Number frequency rank of word
Word
Word
Average
number
frequency
word
percentage
percentage
frequency
Power-law fitting results of word frequency distribution Goodness Exponent
(Adjusted R2)
2.79
-0.735
0.9327
1
94228.12
81864
59.22
2.22
2
54303.72
16156
11.69
1.27
8.06
-0.8456
0.9798
3
40522.58
9603
6.95
1.44
15.41
-0.86
0.9768
4
31883.32
6687
4.84
1.50
23.10
-0.8116
0.9656
5
25438.21
5546
4.01
1.89
35.05
-0.8088
0.9568
6
19734.64
4672
3.38
2.63
57.9
-0.8195
0.9489
7
14205.00
4984
3.61
5.18
106.91
-0.8941
0.9353
8
6641.88
8731
6.32
83.87
988.25
-1.337
0.9258
With the increase of the NT, the number of words is monotonically decreasing, but begins to rise when the NT reaches 8 (Table 2), thus demonstrating a U-shaped distribution. Further, we used two power function fits for the relationship between the number of words and the NT. The fitting function is f (x) = 81530x-2.094 +69.9 x2.26, where 4
x represents the NT, f(x) is the number of words with NT as x. As seen from Table 2 and the fitting function, two rules affect the number of words in a field: The first is a decreasing rule, mainly relevant to the specific topic-related words occurring in a small NT, that with the increase of the topic availability, or the applicability of the word, the number of words significantly decreases in a manner of power-law. The second is an increasing rule, mainly relevant to the topic-free words, that when the use of word is extending to any field, the number of words once again increases in the manner of power-law. To further analyze the relation between the word frequency rank and the NT, we computed their correlation coefficient. The number of words in each field obeys a power-law, so computing is on the same proportional number rather than the same number of words. The resulting correlational coefficient is -0.9811, suggesting that the frequency rank of a word is correlated with its NT. Next, we analyzed the distribution of cumulative word frequency in NT in Table 2. While composing a text, nearly 84% words have the NT as 8, and put differently, are common words that can be used in any field. Instead, words with the NT 1~6, the frequency ratios are about 1-2 percent. For the NT as 7, the word frequency is slightly higher than that of the NT 1~6. The power-law fitting results for the word frequency percentage is f (x) = 83.84(9-x) -3.791, with goodness adjusted R2 = 0.9971, where x represents the NT, and f is the word frequency percentage. It is worth noting that the group of words with the smallest number (namely, with the NT as 8) gets the highest word frequency percentage. In addition, among words with a same NT, only a small number of words have an absolute high word frequency, whereas the majority of words have a very low frequency, the fitting results of which still follow the power law. The distribution of word frequency in each field (As shown in Table 2 Column 5) indicates when we conceptualize what we intend to say, we are most likely to choose common words that can be used in all topics, and then a few content words help flesh out, making the expression specific and significant. Grammatically presented, all the common words can be taken as formulating a construction, and then the slots in this construction will be filled up with content words, thus forming a complete exposition, a notion that is consistent with the major tenets of Construction Grammar[28-30]. Given that the NT of a word represents how many topics this word can appear in, it per se means the word’s ‘expressive ability’. As shown in Table 2, the higher the words’ ‘ability’, the fewer the words. That is, words are divided into different hierarchies. Albeit that the number of words at the highest hierarchy is the smallest, they have the highest probability of being selected, and vice versa. The data pattern here suggests that in human language, each word has its own NT, and the relationship between the number of words and the NT that words can appear in follows the power law. When people choose words to express ideas, most likely they will use words that are not limited by topics, indicating that word frequency and the degree of 5
limit have a power-law relationship. That is to say, the word frequency-rank is an inherent attribute of human languages, instead of being determined by any text. Taken together, it is the inherent word frequency rank of a language and these several power laws that generate the power law between word frequency and its rank. 3
Hierarchical Selection Model and its simulation results
As displayed in Fig. 2 and Table 2, the frequency of a word is determined by the following two parameters: One is the NT this word can appear in, and the other is its probability of being selected. According to the computation of conditional probability, while choosing words to compose texts, the formation of word frequency can be divided into two steps: choose the NT, and then choose words among those with the same NT. In this vein, there are three factors affecting the relationship between the word frequency and its rank: First, the distribution of word numbers in NT fm (x), where x refers to the NT; Second, the distribution of word frequency in each NT fw (x), where x is the frequency rank of words with the same NT; Third, each field’s probability of being selected fc (x), where x represents the NT. To explore the generalizability of the power law, we propose a model from the above findings, named as "Hierarchical Selection Model": Given there are N 'objects', (the equivalent of words), belonging to M hierarchies (The hierarchy number is equivalent to the NT of words), M