each dart to accelerate queries. Appendix A.1 ..... ing OpenGL based visualization, ray-tracing and photon- .... in Density Occluded Polyhedral Environ- ments.
Hierarchy of Generalized Maps for Modeling and Rendering Complex Indoor Scenes D. Fradin & D. Meneveaux & P. Lienhardt Signal Image Communication laboratory, CNRS, University of Poitiers, France {fradin,daniel,lienhardt}@sic.univ-poitiers.fr
Abstract Geometric modeling softwares make use of topological models to describe and modify an environment. Topology expresses adjacency and incidence relations between objects. It corresponds to a fine representation often considered as time and memory consuming for rendering or lighting simulation. In this paper, we propose a topology-based representation dedicated to complex indoor scenes. Taking into account memory management and performances, our model enlarges a topological model (called generalized maps) with multi-partition and hierarchy. Multi-partition allows the user to group sets of objects together according to semantics. The hierarchy representation provides a coarse-to-fine description of the environment. Our modeler prototype was used to create buildings made up with several million polygons. Resulting topological information has been efficiently used in the context of several applications such as global illumination and wave propagation simulation at 1 GHz. CR Categories: I.3.5 (Computer Graphics): Computational Geometry and Object Modeling ; I.3.8 (Computer Graphics): Applications. Keywords: geometric modeling, large buildings, partitions, hierarchical model, rendering.
1
Introduction
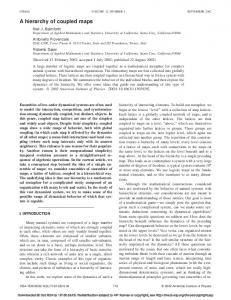
During the past decade, a lot of efforts have been focused on the rendering of complex environments. However, the high number of geometric primitives as well as the large variety of information (photometry, textures, radiometry, etc.) necessary to describe the scene still remain a major barrier to overcome. The choice of a judicious data structure is a crucial point for reducing time and space complexity. We are interested in the use of topology for both modeling and rendering large indoor scenes. Previous work in the area shows that a topological representation has to be reconstructed from the scene for efficiently performing lighting simulation or walkthrough in large buildings [Air90, FTSK96, MBMD98]. This paper goes a step further: topology used for modeling also accounts for rendering constraints. Indoor scenes (Figure 1) are naturally organized into subparts: rooms, floors, wings, walls, etc. At a lower level, this corresponds to subdivisions of the 3D space into vertices, edges, faces and volumes. Subdivision elements are commonly called cells, linked together through adjacency and incidence relationships defining the model topology. For modeling such an environment, it is necessary to define a topological model that fits the building structure. Local operations also have to maintain the overall model
Figure 1: (left) Hierarchical topology representation of a simple building. The upper-right part contains the outer walls description. The bottom-left part corresponds to the two rooms contained in the next hierarchy level. Links are explicitly described between the two levels. (right) Inside view of one of our buildings with global illumination.
consistency during the construction process. Unfortunately, a "brute force" topological description of complex architectural environments requires a lot of memory. This is mainly due to the huge number of needed polygons as well as the topological information corresponding to incidence and adjacency relationships. Usually the whole scene does not fit in memory. Moreover, the high number of geometric primitives to be displayed on a screen often makes the scene editing unpracticable. To face this problem with a general modeler, the user has to elaborate 1
eling and rendering. Historically, the modeling community does not take into account rendering problems and conversely, rendering programs do not exploit efficiently topology information. Our contributions concern the following points:
specific modeling strategies depending on the nature of the environment (architecture, automotive, etc.). This is why we propose to enrich a topological model with a hierarchical description which allows to create a building from a coarse description to its precise details. In this context, each operation corresponds to local modifications of topology and geometry. Moreover, as explained above, a hierarchical topology representation is also useful for lighting simulation and visualization. Our model is dedicated to building description including information for both modeling and rendering. It corresponds to a structured space subdivision, defined so that adjacency and visibility graphs such as those defined in [ARB90, Tel92, MBMD98] can be easily and efficiently built. Moreover, information extracted from our model has n used in [FMH05] for reducing computing time during global illumination and rendering. For handling a complex scene, we believe that it is worth to make use of topological information about the scene even though it increases the storage of all the data structure involved: (i) topology facilitates the scene construction (for instance through local operations such as split, extrusion, etc.); (ii) it provides a coherent representation of space subdivisions with adjacency/incidence relationships; (iii) taking topological information into account can drastically reduce the time complexity of visibility computations during the rendering process. In this paper, we address this problem and show that a fine topology representation, necessary for modeling operations, also provides adequate information for rendering complex indoor scenes. Our topological model extends generalized maps proposed in [Lie94] with two important features: multi-partition and hierarchy. The multi-partition concept allows to create groups of objects (groups of rooms for example in Figure 2.b) while hierarchy (Figures 1 and 2.a) makes it possible to perform a given processing only on a subpart of the scene.
• A multi-partition and hierarchy representation dedicated to the modeling and rendering of complex indoor scenes; • A set of topological operations associated with this representation; • A modeler prototype for large buildings with furniture; • Results concerning visibility computations and global illumination with our topological model. Section 2 presents the work most closely related to our approach. A description of our model based on generalized maps and labeling is given in section 3. Construction operations and modeler implementation are defined in section 4. Results concerning lighting simulation and rendering are discussed in section 5.
2 Related Work and Choices We aim at representing large buildings, actually corresponding to 3D topological objects, made up with vertices, edges, faces and volumes. Note that cells do not necessarily have regular shapes. For instance a simplicial description is not desired. Many topological models have been proposed in the literature for handling different classes of subdivisions (oriented surfaces, manifold, non manifold, etc.) for any dimension. Examples of such structures are adjacency graphs [RO89], ordered models (as defined in [Bri93]), 2D or 3D edge-based models [Bau75, GS85, Wei86] or higher dimensional models [Bri93, Lie94]. Incidence graphs (such as [RO89]) do not allow multiincidence (see [Lie94]). Coherence constraints necessary to represent an orientable 3D manifold with an incidence graph cannot easily be expressed. The definition of construction operators accounting for these constraints and guaranteeing thus topological consistency of modeled objects can be also difficult for dimension 3 and higher (see [Wei88]). This is the reason why ordered models have been introduced. They are mainly defined with a single type of basic element and links between these elements [Bri93, Lie94]. For the reasons explained above, we chose an ordered topological model. Complexity studies have shown that for 2D and 3D manifold (surface subdivisions or R3 subdivisions), costs for representing an ordered model compared to an incidence graph are comparable [FB00], in particular for attributes management. The objects we wish to represent are buildings composed of volumes (walls, rooms, floors, etc.) sharing
a. A hierarchical decomposition of a building Administration
Offices
Classrooms
Teaching
b. Several partitions of a building (multi-partition)
Figure 2: (a) Hierarchy representation for a simple building and (b) two partitions (or a multi-partition representation). The originality of this paper concerns the design of a model accounting for two generally separated areas: mod2
or viewpoint-based visibility (see section 5). Such extracted information has already been used for rendering, global illumination [FMH05] and 1 GHz wave propagation [VPE04].
faces. Topologically speaking, it corresponds to 3D orientable manifolds. In [Lie91], it has been shown that models defined to represent 3D manifolds are comparable either to 3D maps (for orientable ones without boundaries) or to 3D generalized maps (for orientable or not orientable ones, with or without boundaries). Even though generalized maps defined in 3D are a bit more costly than 3D maps in terms of memory representation, we chose this model because it allows to represent objects with explicit boundaries, operations are easier to implement and the cost difference is low. Moreover, generalized maps are defined homogeneously in any dimension. The major drawback is related to the data structure size. For complex environments, several million polygons may have to be defined; the model needs to be structurally improved. This is why we propose a hierarchical description adapted to large buildings. Topology-based hierarchical representations have been used in several areas. For instance, in the field of image processing, pyramidal models have been used for long to handle several subdivisions of a given 2D image. Each region is linked with its associated decomposition in the next/previous level [JM92, BK03]. In the context of 3D applications, multi-resolution meshes offer several descriptions (more or less precise) of the same object. For example, hierarchical descriptions based on simplexbased models (or convex cells) have been proposed in [DF88], [CDM+ 94] and [PFP95]. The Multiresolution Simplicial Model [DPM97] unifies the previous models with the help of a graph. The difference between two successive levels is expressed through transformations applied to topology and geometry (with or without overlaps). The object is then represented as an acyclic graph accounting for the different levels. This model does not explicitly represent each hierarchy level, some operations have to be performed to reconstruct a given description of the object. Since an explicit description of the scene is necessary for our application, we chose to conceive a specific hierarchical model. Rendering complex scenes is still not straightforward for two main reasons: (i) the memory needed for storing the database and (ii) the number of objects to handle. Space subdivision methods help to manage memory and reduce the number of objects stored in memory. In this case, a topological representation is needed. Generally, the scene subdivision is (semi)automatically reconstructed from a list of polygons [LCCO03, WWSR03, MPB03]. The scene subdivision dramatically reduces the inter-region visibility computation cost. There exists a vast literature in this area (regular grids, BSP/K-d trees, etc.) with several approaches dedicated to large buildings [ARB90, TFFH94, MBMD98]) for walkthrough [FTSK96] or lighting simulation [TH93, TFFH94, MBM98]. However, the obtained results do not reach the precision of a manual partitioning. Topological information used during the modeling process, when available, can be most useful to avoid this reconstruction. Our representation makes it possible to extract adjacency or visibility graphs used in [ARB90, TFFH94, MBM98],
3 Hierarchical Model First, we define a model based on labeling, convenient for theoretical purposes. It is used to define the basic concepts of our data structure, i.e. hierarchy and multi-partition. Second, we propose an optimization of the model, taking into account practical implementation aspects.
3.1
Generalized Maps and Labeling
We choose generalized maps defined in [Lie94] for the following reasons: • They can represent subdivisions of 3D space; • They are defined in an homogeneous way: a single type of basic element (Figure 3). This simplifies the formal definition of many operations. • Very simple operations for merging cells have already been defined [DL03], providing a theoretical basis for our hierarchical representation • Any type of attributes (such as geometry, photometry, texture, etc.) can be associated with any ndimensional cell. Definition 1 - generalized maps [Lie94]: Let n ≥ 0; an n-dimensional generalized map (n-G-map) is defined by an (n + 2) − tuple G = (D,α0 ,...,αn ), where: • D is a finite set of darts; • αi is an involution on D for 0 ≤ i ≤ n; (a bijection f is an involution iff f 2 = Id); • αi ◦ α j is an involution for i ≥ 0 and i + 2 ≤ j ≤ n. orbits: An orbit is described by a dart and a set of involutions. It provides the set of all darts that can be reached by any composition of the given involutions (graph traversal). cells: A i-dimensional cell (or i-cell) incident to a dart is the set of all darts that can be reached by any composition of all involutions except αi . attributes: Each cell can be provided with different types of data such as point coordinates for vertices (here, we only use a linear representation), photometry for faces or any semantical information. Data are associated with an orbit (often defining a cell). In practice, attributes associated with a cell are stored on a single dart. This implies to scan all darts of the cell to retrieve the information. During the modeling process, this reduces the required memory. If attributes are often needed, it is possible to propagate the information onto 3
a.
α0 α1 α2
v
2 1
1
1 1 1 1 11 1 1 1 1 1 1 1 1 1 1 1 11 11 1
Vertex
1
Edge
2
2
e
Darts
b.
φ
α0 α1 α2
2
2
F
2
2
2
2
2 1
2
2 2
2 2
2 22 22 2 2 2 2 2 2 2 2
2 2
2
2 2
Face
Figure 4: (left) a partition of 2-cells (faces): all darts are provided with a label. φ corresponds to the function that assigns a label to each dart. (right) the corresponding object with groups.
Figure 3: Intuitively, a dart can be seen as a cell-tuple [Bri93], i.e. a sequence of incident cells of increasing dimensions. For instance, dart 1 in (b) corresponds to vertex v of edge e of face F in (a). If we think of a G-map as a set of darts linked with involutions, a i-cell is a set of darts connected with all involutions except αi . For instance, a vertex (an edge, a face) is the set of darts connected with α1 and α2 (resp. α0 and α2 , α0 and α1 ).
1
1 1
2
1 1
2 2
3
3 2
3 2
1 1 4 2
3 2
1 1 3
5 2
1 4 3 5
3
3
Maximum detail
each dart to accelerate queries. Appendix A.1 and [Mok] provide more details about implementation. We are mainly interested in grouping volumes as rooms, walls, etc. For example we can define groups corresponding to a gallery for guided walkthrough in a museum, groups of rooms corresponding to the same floor or same wing, etc. It can also be useful to group several elements of the scene according to their use or appearance. An obvious way to represent groups within a subdivision consists in associating a label with each cell. A group is then a set of cells having the same label. We define the notion of group in any dimension. This definition can be extended for lower dimensional cells [Fra04]. Definition 2 - partition functions (Figure 4): Let G = (D,α0 ,...,αn ) be a n-G-map and φ : D → N be a function associating a label with each dart of D: φ is a partition function of G iff φ(d) = φ(d ′ ) for any darts d and d ′ which belong to the same n-cell. The use of multi-labeling (i.e. associating several labels with a single cell) allows the user to create as many partitions as necessary, even with overlaps (e.g. a room can be shared by a floor and a wing). A hierarchy representation can also be defined with the help of a multi-partition. Each level of the hierarchy corresponds to a partition and a constraint of consistency has to be satisfied: a set of cells which is grouped at one level is still grouped at a higher level (see Figure 5). Definition 3 - partition functions for hierarchy: A hierarchy is defined by a set of functions {(φi )}i∈{1..p} such that φi (d) = φi (d ′ ) ⇒ φ j (d) = φ j (d ′ ), for j ≤ i. As explained above, labeling is a theoretical representation of partitions and hierarchies. Unfortunately, a topological model relying on labels requires a high amount of memory since each dart must be provided with one integer label per partition and as many integer labels as hierarchy nodes. Labeling also induces too many redundancies which limits its use practically. To overcome the above problems, we propose in our model an equivalent
Intermediate detail Root of hierarchy
Figure 5: Two labels are associated with each face: the first one (top left) defines the intermediate detail, the second one (bottom right) defines the root of the hierarchy. representation that brings the advantages of a topological model while allowing fast access to the geometry associated with a partition or hierarchy level. We need to (i) reduce the cost due to labeling and (ii) provide a fast access to topology and geometry. Therefore, we propose to separate the representations of multi-partition and hierarchy, since they are handled by different sets of operations. For the sake of efficiency, we also need the model to require a small size of memory. We chose to represent partitions with the help of boolean marks associated with involutions. Hierarchy explicitly defines details associated with cells avoiding redundancies. To sum up, the main features of our topological model are the following: • representation of groups of cells (e.g. set of rooms for a single floor); • hierarchical building representation: contour, floors, rooms, furniture, etc.; • capable of handling a high number of polygons (our largest manually created scene is composed of 5 million polygons); • with efficient data access (darts, geometry, other attributes) for modeling and rendering. 4
3.2
Multi-Partition
by multi-partitions. For image processing, a pyramidal structure can be deduced from the most detailed image by successively removing or contracting cells [BK03]. Conversely, during the modeling process for buildings, we rather construct hierarchy from the most simple description to the most detailed one. In our application the scene is constructed by successive additions of details. This is well adapted to interactive modeling since the building structure is modified on the fly and only one cell is modified at the same time. For a given level and a given cell in this level (e.g. a room in a floor), the cell is duplicated and successive topological operations such as split of i-cells, extrusions, etc. (corresponding to opposite operations of removal/contraction used in image processing) are applied. A link η is defined between the current level and its lower level: η associates each dart to its copy (such as in Figure 7). Definition 5 - hierarchy: A hierarchy is a sequence of G-maps ((Di , αi0 , ..., αin ))i=0,m , m being the number of levels. Levels are linked together with hierarchical links ηi . Note that ηi is a bijection from a subset of Di with a subset of Di+1 . The model is kept consistent through our construction operations. Note that if we consider a hierarchy of G-maps defined with labeling, ηi functions can be deduced from successive applications of removal and contraction operations [DL03]. From a theoretical point of view, it makes it possible to prove the model validity.
From a technical point of view, a G-map can be considered as a graph where nodes correspond to darts and edges link two nodes when the corresponding darts are linked by an involution α. A connected component for a G-map fits the usual notion of connected component for a graph. For representing connected subgraphs, one has to distinguish between the subgraph edges and the other edges. A boolean mark can easily represent this distinction. Formally, we get the following definition: Definition 4 - group involutions and multi-partitions: Let G = (D,α0 ,...,αn ) be an n-G-map. A group involution αgn is an involution on D such that: • (D, α0 , ..., αn−1 , αgn ) is a G-map; • ∀d, d ′ ∈ D such that αn (d) = d ′ , either αgn (d) = d ′ and αgn (d ′ ) = d, or αgn (d) = d and αgn (d ′ ) = d ′ . A multi-partition is represented by a set of group involutions, one for each partition (see Figure 6). Note that a group involution can be deduced from a partition function. g α2
g α2
α2
α2
0110
g α22
α2
g α21
U
Figure 6: On the left, two different partitions of a same G-map. αg2 are shown in bold for each partition. On the right, the resulting superimposed multi-partition. copy
Note that the definition of αg links implies new orbits called group orbits (coverage of groups). New attributes called group attributes can thus be defined. In practice, they are used for storing semantical or geometrical information. As explained above, αg have essentially been defined for grouping volumes such as rooms or walls. However, we also use αg1 for grouping aligned edges or αg2 for grouping coplanar faces, so that attributes can be factorized and some geometry computations avoided.
3.3
split
split
edge
face
G0
η
G1
Figure 7: The top image illustrates the process for adding a detail to a 2-cell. The bottom image represents the obtained hierarchical G-map.
Hierarchy
As for multi-partitions, labeling is not suitable for hierarchy representation, since for every operation each level of the hierarchy would have to be deduced from labels. Such computation would importantly decrease performances during the scene update, display and obviously also for any other processing (e.g. lighting simulation or rendering). We thus propose a model dedicated to (and efficient for) such operations. The hierarchical representation proposed in [DPM97] implies a graph evaluation with ambiguities management, every time the model geometry is required. In our application, we prefer an explicit representation. For example, an empty floor is detailed by a unique set of rooms. If desired, overlaps admitted in [DPM97] can be represented
4 Operations and Modeler Our modeler describes a building as a 3D space subdivision organized according to our multi-partition and hierarchy model. The topology representation is kept hidden to the user unless he decides to select the option "visualize topology" (as illustrated in the top image of Figure 17). The building modeler is based on a topological kernel implementing G-maps in C++ [Mok]. This kernel defines elementary operations for manipulating darts, e.g. inser5
darts. It makes the assumption that d is already sewed with a dart d ′ by αi . The boolean corresponding to the partition p is set to true. sew_i_g(Dart d, int i, int p) groups two i-cells. It assumes that the i-cell carried by d (named c) is already linked to another i-cell (named c′ ) by αi . It uses the method link_i_g to group every dart of the cell c with the corresponding dart of cell c′ . unlink_i_g(Dart d, int i, int p) and unsew_i_g(Dart d, int i, int p) are the opposite operations. The method isInSameGroupedOrbit(Dart d1, Dart d2, gorbit orb) tests if two darts d1 and d2 belong to the same group defined by the orbit orb. A group orbit is defined by a partition number p and a cell dimension i (corresponding to an αi involution). This method is only used for attributes management. Figure 8 shows an example of a partition: all the corridors of a floor are grouped. The user can associate any type of semantical information with any group. Details about group orbits and attributes are given in appendix B.1.
tion/removal of cells with geometry and attributes such as materials for volumes, photometry for faces, coordinates for vertices, etc. Several software layers have been added to it: a first layer defines partitions; the second one is used for hierarchy (note that each hierarchy level has its own multi-partition); the third layer sets up all the operations in charge of the building construction. For some parts of a building, geometrical inclusion needs to be explicit. This type of information is not available in the initial topological kernel. We thus define operations for including a face (or a volume) in another one. This is done for avoiding geometrical tests with the help of topological information. For example, the window of a facade is included in the outside faces of the building, furniture is included in a room, etc. Operations for handling inclusion are described in appendix A.2.
4.1
Multi-partition layer
For implementing multi-partitions, involutions αi are marked by means of a boolean indicating if two sewed darts are grouped. Initially, each dart contains 4 pointers toward darts corresponding to α0 ,α1 ,α2 and α3 (see appendix A.1). For multi-partitions, every pointer (except α0 , since such groups are irrelevant) is associated with 8 booleans (one byte) so that 8 different partitions can be set for each dimension. These booleans represent αg links. We have also added in the G-map class (containing a set of darts, appendix A.1) the operations allowing to manipulate partitions: group two cells of same dimension, attach an attribute to a group, etc.
4.2
Hierarchy Layer
Each hierarchy level is represented by one G-map. Therefore, one level can be loaded into memory and managed independently of the others for local operations such as wall creation and furnishing. The hierarchical link η is represented by two pointers in the dart class: a pointer toward the parent dart and one toward child dart. The Gmap class contains also two pointers indicating the parent and child G-maps (see appendix B.2). The main methods for editing hierarchy are the following ones. createChildMap() allows to create the child G-map of the current G-map. createChildDarts(Dart start, orbit orbit) creates a copy of a cell (given by a dart and an orbit) in the child G-map. New darts are linked to the original ones with η links. Later on, this cell can be detailed according to operations provided by the layer dedicated to buildings. Another important operation during the hierarchy edition is the search of a parent dart. When a modification operates at a given hierarchy level (high level operations: wall or opening insertion for instance), the different parent cells have to be known to be able to propagate necessary changes. Child pointers are defined for every dart of a parent volume. On the other hand, only a small number of darts in the child G-map are directly linked to their parent darts. Therefore, when operations have to be propagated to the upper hierarchy level, we need a method providing the parent cell of any dart. A traversal of cells from the lower to the higher dimension has to be performed. This traversal has been implemented in the method f indParentDart(Dart d, Dart &parent, orbit &orb). It returns the parent cell of a dart d (parent and orb are output parameters). The parent cell is described by the dart parent and the corresponding orbit orb: vertex, edge, face or volume. Figure 9 illustrates the possible configurations
Figure 8: Left: The user selects some corridors and defines a group. Right: Group involutions (in bold) are automatically defined between selected corridors and each shared opening. The method link_i_g(Dart d, int i, int p) groups two 6
for the child dart d. For finding its parent cell, we have to go through the current hierarchy level according to cells of increasing dimension. If d is directly connected by η (dart numbered 1 in the Figure), its parent dart is known and the orbit returned is arbitrarily the vertex orbit. When η is not defined (darts 2, 3 and 4), we first cover the edge carried by the dart. If this edge contains a dart directly linked to the parent cell (e.g. dart 2), the function returns the parent dart as well as the edge orbit. Should the opposite occur (darts 3 and 4), the dart containing the η link is searched within the volume boundary faces (not sewed by α3 ). If it is found on the boundary (dart 3), d is located in a face detail. If not (dart 4), d is inside a parent volume and we thus return the volume orbit and any dart of the parent volume (all the detail is traversed until a parent dart is found). To sum up, the parent of dart 1 is given by η, dart 2 has the same parent as dart 1 (with a different orbit), the parent of dart 3 can be any dart in the parent face of dart 1 and any dart of the parent volume can be associated with dart 4. In the last two cases, our algorithm always returns the closest dart in term of composition of α involutions.
walls (Figure 10). Wall volumes define the building structure while wallpaper faces define room volumes. Typically, with this decomposition electromagnetic attributes are associated with walls for 1GHz wave propagation while photometry is associated with wallpapers for lighting simulation and rendering. Thus, portals are defined as volumes with two transparent faces.
Figure 10: A portal in a wall: (left) geometrical aspect (right) split view illustrating darts and α involutions. The building is constructed with the help of coarseto-fine operations. Some operations modify the whole hierarchy description, for example when a window is created in a room. The main operations for constructing the building structure are the following. extrudePolygonToMakeBuilding(int f loorNb, ...) creates the building structure from a 2D shape and a number of floors. Three hierarchy levels are then defined: facade, retaining walls and floors (Figure 12.a to 12.d). createWall(...) creates a wall in a floor. When the new wall is in contact with another one, α3 -sewing is preceded by a new face insertion in the already existing wall, so that topology consistency be preserved. The new volumes automatically created by the wall insertion are considered as rooms. insertOpening(...) inserts into a wall a new opening (door or window) connecting two rooms. This method can affect the whole hierarchy in some cases. For instance, a window has to be placed in the room, the retaining walls and the facade. Two examples of opening insertion are provided in Figure 11. Numerous calls to f indParent method are used for retrieving parent darts during propagation of cells insertion (see B.4 for more details). copyFloor(Dart src, Dart dest) copies the structure of a floor (rooms, walls and openings) into another floor. This function requires to duplicate an entire subtree in the hierarchy.
2 4
3 1
Figure 9: Cases that must be taken into account during the search of a parent dart. Top left corner: a G-map describes the volume of a floor. Bottom: its detailed G-map describes the walls disposition. Four darts (with numbers) illustrate the different cases of a parent search. The darts having a defined η link are shown in bold. Note that in a standard G-map, marks are used to manage darts traversal, selection and modification operations. For example, this is used for avoiding to process twice the same dart. Marks are also essential for handling hierarchy (see appendix B.2 for more details).
4.3
Once the structure of rooms has been defined, it is possible to add furniture with the following operations. insertFurnitureInSelectedRooms( f urniture f ) adds a piece of furniture in each selected room. In the room level, furniture is represented by a bounding box, with a filename, a translation vector and a rotation matrix. Note that selected darts are marked according to the methods detailed in Appendix B.3, queries are made in constant time. deleteSelectedFurniture() removes the selected furniture (shown as bounding boxes for the user). insertLightSourceInRoom(...) adds a point and surface
Building-Dedicated Operations
The two layers described above have been enlarged with higher-level operations concerning building creation such as extrusion, opening insertion and furnishing. Buildings are described with 5 levels of hierarchy: building facade (Figure 12.c), outer walls (Figure 12.d), floors with inner walls (Figure 12.f), rooms and furniture (Figure 12.g and 12.h). We have made a distinction between wallpapers and 7
4.4
As explained above, the scene produced by the modeler contains a lot of information, necessary for modeling operations. A building is never entirely displayed onto the user screen. The program only displays the current hierarchy level. An option allows the user to display the next hierarchy levels except furniture geometry (replaced by bounding boxes) as shown in Figures 12.g and h and 17 (bottom image). The modeler guides the user according to a coarse-tofine construction. 1. Building shape The user firstly defines the building contour (Figure 12.a) and provides the number of floors as well as the wall thickness. The defined polygon is extruded for creating the building facade with topological structure and hierarchy root (see Figure 12.c and Movie 01 in website [Mod]). In a second hierarchy level, a copy of the user-defined polygon is extruded to define outer walls (Figure 12.b) and floors (Figure 12.d). The two hierarchy levels are automatically linked: each dart of the first level is linked to its child with the help of η-links. 2. Editing floors When the user needs to detail a floor, the corresponding volume is copied in a third hierarchy level and η-links are automatically set. Note that each floor can be independently edited by the user and/or duplicated. The floor selection allows the user to describe inner walls. With a 2D view, a polygonal line is drawn and extruded to define the actual wall (Figure 12.e). The program automatically deduces all room volumes from inner walls. Several types of openings such as doors and windows are proposed to the user (Figure 12.f). They can be placed either on inner walls or outer walls. An opening corresponds to an empty volume inserted inside a wall. Movie 02 and Movie 03 in [Mod] illustrates the result of this operation. While defining the building structure, the user can load a plan of a building (or a horizontal section). The image is shown as a background image for simplifying the building design. This option is much useful for reproducing existing buildings (see Figure 18.a). During walls and openings creation, specific attributes are automatically placed on each volume to distinguish walls, rooms, doors and windows. The user also has the possibility to add his own attributes to faces and volumes such as materials (photometric attributes, concrete, plaster, etc.) or semantic information (offices, libraries, washrooms, etc.). Higher-level operations are also used to group two adjacent rooms sharing at least one portal (multi-partition operations). Practically, this operation implies to scan all the darts belonging to the corresponding rooms and the in between portals. For anticipating the rendering process, a graph expressing adjacency relationships between rooms is automatically created with the help of multipartitions.
a.
b.
Construction steps
c.
Figure 11: Openings are always inserted in the third hierarchy level. - a. Two openings to be inserted; the first one is a door only modifying the lower hierarchy level; the second one is a window propagated up to the root of the hierarchy. - b. Whole hierarchy representation after insertion of opening 1. For its creation, only the concerned wall and the corresponding rooms are modified. - c. In the case of a window, the retaining walls and the facade are also modified.
light source in a room, considered as furniture with radiometry. copyRoomContent(Dart d) and pasteRoomContentTo( list < dart > rooms) are used for copy/paste operations. The first one creates a buffer in memory and copies all the furniture included in the room carried by the dart d. In practice only bounding boxes, transformations and filenames are stored in memory. The second one copies these volumes in the room list. Appendix B.5 provides operations for modifying photometric and radiometric information during the modeling process. Some functions also export our scenes in various formats. In this software layer, we have developed more evolved operations concerning partitions. For example, groupSelectedRooms(int partition) groups a set of rooms as well as their openings, provided that they are interconnected. It uses the operation sew_i_g and orbit coverages.
8
a. Building shape.
b. Main walls shape deduced from (a).
c. Extrusion of polygon (a) to produce building outdoor.
d. Extrusion of (b) to generate floors.
e. Edition of a floor to arrange walls.
f. disposition of doors and windows.
g. Bounding boxes to represent furniture.
h. Samples of furniture.
Figure 12: Construction steps of a simple building.
9
3. Room furnishing Each room can be enriched with furniture (4th hierarchy level). We can use either topological objects described by a g-map modeler or objects defined by a list of polygons. In this level, furniture is represented by a bounding box volume. The last hierarchy level contains object details (Movie 04 in [Mod]). Practically, due to the high number of polygons, object geometry and topology are stored on the disk (except for the currently edited room). Bounding boxes contain an attribute indicating the object file name and the translations/rotations applied. The same file can be used several times. This corresponds to clones of the same object. As for floors, room furniture can be duplicated and used for several locations in the building. Moreover, a mechanism of furnishing scripts is also used to automatically add objects into a given room with slight random modifications. Note that inserted objects are either defined by a G-map with its geometry or described by a list of polygons. In this latter case, object topology needs to be estimated. The object is firstly revised so as to suppress degenerated triangles and triangulate non-coplanar polygons; α involutions are automatically retrieved from the resulting list of polygons when possible. 4. Final building When each room has been described, we can see entire building by displaying all levels of the hierarchy, except furniture (see bottom of Figures 13 and 17, Movie 05 in [Mod]).
5
Results
The following results correspond to scenes that have been constructed with our modeler and used with various rendering programs.
5.1
Figure 13: Screenshots of three different buildings constructed with our modeler (with and without automatic furnishing).
Buildings
The simplest scene contains 300K triangles and the most complex one contains 1 billion triangles. Table 1 provides disk space required by various scenes; note the difference between raw and hierarchical models. The raw description includes the complete list of triangles with photometric attributes while the hierarchical representation uses cloned pieces of furniture. Building L-Building Z-Building Octagon Tower_100
# Polygons
# rooms
336.5K 1.074M 5 250K 1.074 billion
27 22 232 17 800
are illustrated in Figure 17. As shown in Figure 18, we can also use our modeler for producing various and complex shapes such as the Chartres Cathedral. Finally, we have created a building made up with one billion triangles spread out in 17 800 rooms and 101 floors. Furniture have been automatically placed. This model has been used for a photon-mapping method dedicated to large buildings [FMH05].
Disk (compressed) raw model hierarchy 3.55 MB 2.3 MB 10.4 MB 1,51 MB 54.8 MB 6 MB 8.5 GB 164 MB
5.2
Rendering
For complex scenes, it remains difficult to interactively display millions polygons even with powerful graphics hardware. The scenes produced with our modeler have been used for several rendering systems, including OpenGL based visualization, ray-tracing and photonmapping. The topological information we propose is used
Table 1: Four furnished buildings; disk space is given with compression. Figure 13 presents images of our buildings. Our modeler interface with our biggest manually-modeled scene 10
With Topology PC PI PRT L-Shaped building (1) 9” 1” 1” (2) 9” 2” 2” Octagon building (3) 10” 1” 2” (4) 12” 4” 2”
Brute Force PRT T
T
PI
11” 13”
1’18” 1’31”
13” 18”
6” 7”
1’24” 1’38”
Impossible to load with 512 MB RAM
Table 2: Computing time with and without preprocessing for a 400 x 300 pixel image of two buildings (L-shaped with 300K polygons and octagon with 5 millions triangles) without taking lighting into account. PC corresponds to the pre-computation using the topological structure. PI represents the time needed by POV-Ray for reading the scene and constructing the accelerated data structure while PRT is the time needed for computing one image. T is the total computing time in both cases.
for: • reducing the number of geometric primitives displayed during the modeling process;
Figure 14: Images of our L-shaped building rendered with POV-Ray.
• estimating straightforward view-dependent visibility information for POV-Ray rendering [Pov] (Figure 14);
Our modeler has also been used to generate a 1 billion triangles building (Figure 13, bottom) for lighting simulation computations with 60K light sources [FMH05]. The cells and portals data structure allows memory-coherent photon-tracing and ray-tracing. Irradiance information (photon-maps) is stored independently in each room. With our method, only 300 MB of memory have been necessary for computing lighting simulation, though the whole database requires 110 GB on the disk (8.5 GB compressed). As a result, 1.6 billion photons have been propagated in the scene and more than 400 GB are necessary for storing all the information on the disk. After lighting simulation (computing time is given in Table 3), an image can be generated in a few minutes (Figure 15).
• generating cells and portals data structure [TFFH94, MBM98] and computing out-of-core global illumination for very large buildings [FMH05]; • providing the representation necessary for lower frequency electro-magnetic wave propagation simulation [VPE04]. During the modeling process, the building is displayed with the help of OpenGL library. Furniture is not stored in memory unless the user explicitly selects one object for examining its details. As a result, the 5 millions polygons building only requires at worst 85 MB of memory (corresponding to the graphic user interface plus our data structure). Displaying the whole scene would require at least one gigabyte memory. For lighting simulation and rendering, the building is firstly saved as a set of files enriched with an adjacency graph. Each file corresponds to a single room description with furniture. Portals are defined by transparent polygons indicating the corresponding adjacent rooms. Note that polygons corresponding to room structure (such as floor, ceiling and wallpaper) are specifically labeled. For computing one image with POV-Ray, a precomputation process provides the list of rooms potentially visible from the viewpoint. To do this, our ray-casting procedure uses only room volumes and portals without furniture and walls. Table 2 provides computing time for two scenes. These results have been obtained with a PC 1 GHz with 512 MB RAM. As seen in this Table some of these viewpoints could not be rendered brute force with POV-Ray because of the high number of polygons.
Building L-Shape Z-Building Octagon Tower
# Photons (millions) 4.6 3 30 1655
Phot-prop. time 1’19" 33" 4’04" 10h11’
Phot-Map time 21" 1" 2’14" 3h56
Table 3: Computing time for several buildings. # Photons corresponds to the number of photons impacts stored in the scene. Phot-prop time corresponds to the time needed for propagating photons and Phot-map time correspond to the time needed to construct all the photon-maps. Finally, the model proposed in this paper has been used to generate adequate data structure for a wave propagation simulation algorithm [VPE04] without furniture (Figure 16). In this case, walls volumes and materials are used 11
Figure 16: Simulation of indoor radio propagation at 1GHz in SP2MI building. University of north Carolina at Chapel Hill, 1990.
Figure 15: Images of our buildings computed with our photon-mapping system.
[ARB90]
John M. Airey, John H. Rohlf, and Frederick P. Brooks. Towards image realism with interactive update rates in complex virtual building environments. Computer Graphics (1990 Symposium on Interactive 3D Graphics), 24(2):41–50, May 1990.
[Bau75]
Bruce Baumgart. A polyhedron representation for computer vision. In AFIPS Nat. Conf. Proc. 44, AFIPS Press, Alrington, Va., pages 589–596, 1975.
[BK03]
Luc Brun and Walter Kropatsch. Contraction kernels and combinatorial maps. Pattern Recognition Letters, 24(8):1051–1057, 2003.
[Bri93]
Erik Brisson. Representing geometric structures in d dimensions : topology and order. Discrete & Computational Geometry, 9:387–426, 1993.
rather than room volumes.
6
Conclusion and Future Works
This paper presents a topologically-based model dedicated to large buildings. Our data structure allows both modeling and rendering complex indoor scenes. It extends the G-map topological model with multi-partitions and hierarchies taking into account memory and time issues. Model robustness have been shown through several applications. First, we provide a set of operations dedicated to large buildings, included in a modeler prototype. Second, the scenes produced, enriched with topological information, are used for ray-tracing, photon-mapping and wave propagation simulations at 1 GHz. Results are encouraging and show that topological information provided by the modeling process can be advantageously used by rendering systems. Presently, the topological information used during the rendering process concerns essentially highlevel information such as volumes adjacency, rooms and portals. In the future, we aim at using lower-level descriptions for taking advantage of incidence and adjacency information with faces and edges.
[CDM+ 94] Paolo Cignoni, Leila De Floriani, Claudio Montani, Enrico Puppo, and Roberto Scopigno. Multiresolution modeling and visualization of volume data based on simplicial complexes. Symposium on Volume Visualization, pages 19–26, 1994.
References [Air90]
J. M. Airey. Increasing Update Rates in the Building Walkthrough System with Automatic Model-Space Subdivision and Potentially Visible Set Calculation. PhD thesis, 12
[DF88]
Leila De Floriani and Bianca Falcidieno. A hierarchical boundary model for solid object representation. ACM Transactions on Graphics, 7(1):42–60, 1988.
[DL03]
G. Damiand and P. Lienhardt. Removal and contraction for n-dimensional generalized
maps. In Discrete Geometry for Computer Imagery, number 2886 in Lecture Notes in Computer Science, pages 408–419, Naples, Italy, november 2003. [DPM97]
Leila De Floriani, Enrico Puppo, and Paola Magillo. A formal approach to multiresolution hypersurface modeling. In W. StraSSer, R. Klein, and R. Rau, editors. Geometric Modeling : Theory and Practice. Springer Verlag., 1997.
[FB00]
Jean Françon and Yves Bertrand. Topological 3d-manifolds: a statistical study of the cells. Theor. Comput. Sci., 234(1-2):233– 254, 2000.
[FMH05]
David Fradin, Daniel Meneveaux, and Sebastien Horna. Out of core photon-mapping for large buildings. Eurographics Symposium on Rendering, Konstanz, Germany, 2005.
[Fra04]
[MBM98]
[MBMD98] D. Meneveaux, K. Bouatouch, E. Maisel, and R. Delmont. A new partitioning method for architectural environments. Journal of Visualization and Computer Animation, 9(4):195–213, October–December 1998.
David Fradin. Modélisation et simulation d’éclairage à base topologique : application aux environnements architecturaux complexes. PhD thesis, University of Poitiers, France, Décembre 2004.
[FTSK96]
Thomas Funkhouser, Seth Teller, Carlo Séquin, and Delnaz Khorramabadi. The uc berkeley system for interactive visualization of large architectural models. Presence, 5(1):13–44, 1996.
[GS85]
Lionidas Guibas and Jorge Stolfi. Primitives for the manipulation of general subdivisions and the computation of voronoï diagrams. Transactions on Graphics, 4(2):131– 139, 1985.
[JM92]
Jean-Michel Jolion and Annick Montanvert. The adaptive pyramid: A framework for 2d image analysis. CVGIP, 55(3):339–348, May 1992.
[LCCO03] Alon Lerner, Yiorgos Chrysanthou, and Daniel Cohen-Or. Breaking the walls: Scene partitioning and portal creation. In Pacific Conference on Computer Graphics and Applications, pages 303–312. IEEE Computer Society, 2003. [Lie91]
[Lie94]
Daniel Meneveaux, Kadi Bouatouch, and Eric Maisel. Memory management schemes for radiosity computation in complex environments. In Computer Graphics International, Hannover, pages 706–714, 1998.
Pascal Lienhardt. Topological models for boundary representation: a comparison with n-dimensional generalized maps. ComputerAided Design, 23(1):59–82, 1991. Pascal Lienhardt. N-dimensional generalized combinatorial maps and cellular quasi-manifolds. International Journal of Computational Geometry & Applications, 4(3):275–324, 1994. 13
[Mod]
Large building modeler, sic laboratory, http://www.sic.sp2mi.univ-poitiers.fr/mrarchi/cgf05.html.
[Mok]
Moka, sic laboratory modeler project, http://www.sic.sp2mi.univpoitiers.fr/moka/.
[MPB03]
Jean-Eudes Marvie, Julien Perret, and Kadi Bouatouch. Remote interactive walkthrough of city models. Pacific Conference on Computer Graphics and Applications, pages 389–393, Octobre 2003.
[PFP95]
Valerio Pascucci, Vincenzo Ferrucci, and Alberto Paoluzzi. Dimension-independent convex-cell based hierarchical polyhedral complex : Representation scheme and implementation issues. In SMA ’95: Proceedings of the Third Symposium on Solid Modeling and Applications, pages 163–174, 1995.
[Pov]
PovRay. Persistence of vision raytracer pty. ltd. the terms "pov-ray" and "persistence of vision ray-tracer" are trademarks of the persistence of vision development team : http://www.povray.org.
[RO89]
Jarek Rossignac and Michael O’Connor. SGC: A dimension-independent model for pointsets with internal structures and incomplete boundaries. In Eds. M. Wosny, J. Turner, K. Preiss, and North-Holland, editors, Geometric Modeling for Product Engineering, Proceedings of the IFIP Workshop on CAD/CAM,, pages 145–180, 1989.
[Tel92]
Seth Jared Teller. Visibility Computations in Density Occluded Polyhedral Environments. PhD thesis, University of California at Berkeley, 1992.
[TFFH94]
Seth Teller, Celeste Fowler, Thomas Funkhouser, and Pat Hanrahan. Partitioning and ordering large radiosity computations. In Computer Graphics Proceedings, Annual Conference Series, pages 443–450, 1994.
[TH93]
Seth Teller and Pat Hanrahan. Global visibility algorithms for illumination computations. In Computer Graphics Proceedings,
Annual Conference Series, pages 239–246, 1993. [VPE04]
Rodolphe Vauzelle, Yannis Pousset, and Frédéric Escarieu. A sensitivity study for an indoor channel simulation. Annals of Telecom, 59(5-6):655–672, 2004.
[Wei86]
Kevin Weiler. The radial-edge data structure: a topological representation for nonmanifold geometry boundary modeling. In Proc. IFIP WG 5.2 Working Conference, Rensselaerville, USA, 1986.
[Wei88]
Kevin Weiler. Boundary graph operators for non-manifold geometric modeling representations. In Geometric Modeling for CAD Applications (First IFIP WG5.2 Working Conference Rensselaerville, N.Y., 12-14 May 1986), pages 37–66, North-Holland, 1988.
[WWSR03] Peter Wonka, Michael Wimmer, François Sillion, and William Ribarsky. Instant architecture. ACM Trans. Graph., 22(3):669–677, 2003.
14
A
3-G-map Kernel details
in another one. We have developed a series of operations: insertion, removal and query for faces inclusion such as - addInsideFace(dart container, dart content), - removeFirstInsideFace(dart container), - removeAllInsideFaces(dart container, dart content), and getInsideFaces(dart container) for faces with their equivalent for volumes inclusion. Two marks in G-maps are kept for inclusion: f aceInsideMark is used to indicate if a face is located in another one (by marking the dart carrying the face), volumeInsideMark is the equivalent for volume inclusion.
Our modeler has been elaborated upon our laboratory topological kernel [Mok]. The latter describes a set of operations for handling generalized maps of dimension 3.
A.1
3-G-map Data Structure
3-G-maps contain a set of darts (basic elements) associated with involutions α0 , α1 , α2 and α3 . Marks are used for modification operations or coverages and the G-map class also indicates how many and which marks are currently used. For handling embeddings (information about geometry, semantic, etc.), a list of attributes is stored in the dart class. An attribute is a triple composed of a type, the information to store and the corresponding orbit (vertex orbit for coordinates, face orbit for photometry, etc.). A boolean table also indicates for which orbits these attributes are defined. This table is used for avoiding to check the whole attributes list if it is not necessary.
B Our Partition and Hierarchy Representation B.1 Partitions management Some information for handling groups have been added to the initial kernel classes. A unique boolean is sufficient to describe a set of groups corresponding to our definition. With a byte we can thus create 8 different partitions for each involution α1 , α2 and α3 . Marking α involutions creates new orbits (group orbits). These orbits can be used to store particular attributes to associate semantic informations with groups. Extension of attributes are named PAttribute.
// A 3-G-map class Gmap { private : // list of darts Dart * darts; // Reserved marks boolean marks[]; int nbUsedMarks;
// A dart with partition handling class PDart : public Dart { private : // marks for groups byte alpha_g[3];
public : ... } // A dart of 3-G-map class Dart { private : // alpha involutions CDart * alpha[4];
// attributes of groups PAttribute * grouped_attributes; public : ... } // A 3-G-map with partition handling class PGmap : public Gmap { private : // which partition are reserved boolean used_partitions[8];
// boolean marks boolean marks[]; // Which orbits have attributes boolean embedded_orbits[16]; // corresponding attributes Attribute * attributes; public : ... }
A.2
public : ... }
Cells Inclusion
Methods getAttribute(dart d, gorbit orb, attribType type), addAttribute(dart d, gorbit orb, attribute Att) and removeAttribute(dart d, gorbit orb, attribType type) are used to manipulate group attributes. The main difference between standard attributes and group attributes
To deal with inclusion, we propose a set of methods in the G-map class defining attributes in some darts to specify inclusion. According to the attribute orbit (face or volume orbit), it indicates if a face or a volume is included 15
by hierarchical operations to mark darts for defining the working area of local operations.
is the orbit: the type gorbit corresponds to group orbits. Note that all the attributes of a group are carried by a unique dart in the group. groupAttributes(dart d1, dart d2, gorbit orb) checks and merges the attribute lists of d1 and d2 for a given group orbit. Attributes of a same group are required to be of different types; if two attributes of same type are found, only one of them is kept (the one of d1). duplicateAttributes(dart d1, dart d2, gorbit orb) is the opposite operation. When a group is subdivided, event detected by the method isInSameGroupedOrbit, all the attributes of the original group are copied in the two new groups (call to duplicateAttributes).
B.2
B.3 Selection operations Selection operations have been developed for providing the local work areas. setCurrentMap(int level) defines the level of hierarchy on which the user works (edition or visualization). select(Dart d, gorbit orb) selects all the darts in the orbit orb of dart d in the current G-map. It consists in marking a set of darts (for example a volume or a face) selected by the user for an operation. The dart d and the orbit orb are also stored in a list selectionList to accelerate accesses. unselect(Dart d, gorbit orb) is the opposite operation. getSelections() returns all the selections: the list of couples (dart, orbit). Some selection methods require to check the cells semantic before validating the process. For instance, setRoomSelection(), setWallSelection() and setOpeningSelection() restrict the selections to volumes corresponding to rooms, walls or openings. Semantic information is automatically managed by the modeler.
Hierarchy management
Each hierarchy level is represented by one G-map. Since we want to create partitions in this G-map, we define each level as a PGmap with hierarchy information: parent and child maps. The same principle is applied to the dart class. // A dart in the hierarchy class HDart : public PDart { private : // eta link HDart * parent, * child;
B.4 Modification operations In this section, we propose to explain a particular operation for illustrating propagation of modifications in the hierarchy. We choose to detail opening insertions shown on Figure 11. When the user clicks for indicating the opening location, a first traversal identifies the closest dart d within the current hierarchy/floor level. This dart belongs to a face corresponding to a wallpaper, an opening or a wall. The wall volume selected by the user is located on the edge orbit of d. Note that the corresponding volume can be a retaining wall defined in the upper hierarchy level. If the wall belongs to the current floor (inner wall, Figure 11.b), the opening is inserted between two rooms. First, the algorithm checks opening validity: (i) the opening must be smaller than the wall, (ii) its position must be completely inside the wall, and (iii) it does not cross another portal. The position is automatically corrected by the program when (ii) or (iii) is not verified. The user can move the mouse to precisely place the opening on the selected wall. Once the user confirms the opening position, the scene is actually updated. Opening insertion implies the creation of new cells: opening volume, transparency faces between portal and adjacent rooms and obviously new edges and vertices. These insertions are applied on the current floor level and sometimes on the lower level if the corresponding rooms have been previously detailed. Note that all the room volumes are grouped together in the floor hierarchy level. If the opening is inserted in a retaining wall (Figure 11.c), the new volume is added in the upper hierarchy level (second level) and one of the transparent faces is created on the facade. Therefore, the corresponding parent darts are found using the method f indParent(). On the facade,
public : ... } // A 3-G-map in the hierarchy class HGmap : public PGmap { private : // hierarchy HGmap * parentMap, * childMap; public : ... } Hierarchical operations need sometimes to mark darts in several hierarchy levels. This is why hierarchical marks have been defined. Requesting a hierarchical mark consists in requesting it in all the concerned G-maps. A unique identifier is given to all the marks. Such a query is first applied to the root G-map of the hierarchy and propagated through the whole hierarchy. Method reserveHMark(int i) requests a mark. HMarkIsReserved(int i) indicates if mark i is used. f reeHMark(int i) releases mark i; all the darts have to be unmarked. getHMark(int i) returns the mark number in the current G-map corresponding to the hierarchical mark i. Three hierarchical marks are reserved for the modeler: selectionMark for selections in different levels of the hierarchy, orientationMark to control orientation in every Gmap (for deducing normals of faces) and workMark used 16
the opening insertion method uses face inclusion (method addInsideFace) instead of cells insertion for simplifying the hierarchy root description. Finally, in both cases, attributes concerning openings are defined: semantic on the opening volume and transparency on the two faces linked with adjacent rooms. The wall parts around the opening are grouped with αg3 for indicating that the subdivision is arbitrary (this is an unique wall). For the same reason, the corresponding faces in rooms are also grouped with αg2 .
B.5
Photometry and radiometry
Faces and volumes can be selected and associated with radiometry and photometry (BRDF or bidirectional reflectance distribution function), according to the following methods. setMaterialOnSelectedVolumes(material m) provides the selected volumes with the given material (concrete, plaster, wood, etc), using the selectionList. setBrd f ToSelectedFaces(brd f f r) applies a BRDF to all selected faces. setBrd f ToWall paper(brd f f r) associates a BRDF with all faces corresponding to walls of selected rooms. setBrd f ToGround(brd f f r) and setBrd f ToCeiling(brd f f r) do the same for ground and ceiling of rooms. This information can be used during simulations or visualization. We define methods for exporting the model into different file formats. exportToPOV (Dart d, orbit orb, string f ilename) creates a POV readable file for each room and opening in a given orbit (for PovRay ray tracer). exportToNFF(Dart d, orbit orb, string f ilename) writes a part of the scene in NFF format (for visualization) onto the disk. exportToMSDL(Dart d, orbit orb, string f ilename) exports of a part of the scene in MSDL format (used in our laboratory for wave propagation). exportToAG(Dart d, orbit orb, string f ilename) saves all the rooms of a given orbit (in a format close to NFF with topological information), connected by an adjacency graph for ray and photon propagation.
17
Figure 17: Images of our modeler : (top) topological view of the SP2MI building, (bottom) an entire furnished floor of the octagon building.
18
a.
b.
c.
Figure 18: During building construction, a plan can be inserted in background image to help the design: a. the user has loaded a cathedral plan. - b. & c. the final model of this cathedral.
19