JOURNAL OF BACTERIOLOGY, Jan. 2001, p. 545–556 0021-9193/01/$04.00⫹0 DOI: 10.1128/JB.183.2.545–556.2001 Copyright © 2001, American Society for Microbiology. All Rights Reserved.
Vol. 183, No. 2
High-Density Microarray-Mediated Gene Expression Profiling of Escherichia coli YAN WEI,1 JIAN-MING LEE,2 CRAIG RICHMOND,3 FREDERICK R. BLATTNER,3 J. ANTONI RAFALSKI,2 AND ROBERT A. LAROSSA1* Central Research and Development, DuPont Company, Wilmington, Delaware 19880-01731; Agricultural Products, DuPont Company, Newark, Delaware 19714-61042; and Department of Genetics, University of Wisconsin, Madison, Wisconsin 53706 Received 5 September 2000/Accepted 25 October 2000
A nearly complete collection of 4,290 Escherichia coli open reading frames was amplified and arrayed in high density on glass slides. To exploit this reagent, conditions for RNA isolation from E. coli cells, cDNA production with attendant fluorescent dye incorporation, DNA-DNA hybridization, and hybrid quantitation have been established. A brief isopropyl--D-thiogalactopyranoside (IPTG) treatment elevated lacZ, lacY, and lacA transcript content about 30-fold; in contrast, most other transcript titers remained unchanged. Distinct RNA expression patterns between E. coli cultures in the exponential and transitional phases of growth were catalogued, as were differences associated with culturing in minimal and rich media. The relative abundance of each transcript was estimated by using hybridization of a genomic DNA-derived, fluorescently labeled probe as a correction factor. This inventory provided a quantitative view of the steady-state level of each mRNA species. Genes the expression of which was detected by this method were enumerated, and results were compared with the current understanding of E. coli physiology. Escherichia coli K-12 has been exhaustively studied for over 50 years. Early experiments measured the molecular fluxes from small compounds into macromolecular constituents (33). These studies were followed by others in which small molecule pools of central metabolic building blocks (21), nucleotides (3), and amino acids were enumerated. The levels of several macromolecular components, including individual species of proteins (26), have been measured. Such measurements of the steady state provide a census of the cellular content, while changes upon imposition of a stress catalogue the cell’s fight for survival. This response to an insulting or adverse condition can take many forms, from relieving end product inhibition to derepressing transcription (20). In E. coli, experiments to define stress-related, global regulatory responses have often relied upon either the isolation of operon fusions induced by a particular stress (16) or proteomic measures in which the protein fractions from stressed and unstressed cultures are separated by a two-dimensional method prior to comparison (37). Each method has an inherent technological hurdle; the map location of responsive gene fusions must be ascertained precisely, while induced or repressed proteins excised from the two-dimensional gels must be correctly identified. Alternatively, mRNA measurements utilizing techniques such as hybridization to DNA and primer extension have allowed the monitoring of individual gene’s expression profiles. Recently, expression profiling of most yeast genes has been reported (8, 40); such measurements were facilitated by highdensity arrays of individual genes and specific labeling of
cDNA copies of eukaryotic mRNA by using poly(A) tail-specific primers. Thus, the lack of a poly(A) tail and the extremely short bacterial mRNA half-life represent hurdles for the application of DNA microarray technology to prokaryotic research. Nonetheless, early attempts at comprehensive expression profiling using large DNA fragments from an ordered library of E. coli genomic fragments as a capture reagent and radiolabeled cDNA as a probe suggested that these problems were not insurmountable (6). Here we present a means to successfully perform microarray-based comprehensive gene expression profile analyses with E. coli. We show that such experimentation can be informative by examination of (i) differences in gene expression profiles caused by growth of E. coli in either minimal or rich medium, (ii) changes in gene expression associated with the transition from exponential-phase to stationary-phase growth in minimal medium, and (iii) the specificity of induction mediated by isopropyl--D-thiogalactopyranoside (IPTG), the classic lac operon inducer. Moreover, a method for determining the relative abundance of each transcript was developed and used to provide a census of the mRNA composition of E. coli under each of the growth conditions mentioned above. MATERIALS AND METHODS Microbiological methods. E. coliMG1655 (1) was cultured with aeration in either the minimal medium, M9 (23), supplemented with 0.4% glucose or in the rich medium, Luria-Bertani (LB) (23), at 37°C. The overnight culture was diluted 250-fold into fresh medium and aerated at 37°C. Samples of the minimal medium culture were harvested at A600s of 0.40 (exponential phase; just under five generations) and 1.6 (transition to stationary phase, just less than seven generations) prior to RNA isolation. An IPTG induction (23) was performed to examine the specificity with which it affects gene expression. The LB mediumgrown culture was split when it achieved an appropriate density (A600 of 0.40). To one portion was added IPTG to a final concentration of 1 mM; the untreated sample served as a control. Incubation of both samples was continued with aeration at 37°C for another 15 min (A600 of 0.45 for both cultures) before RNA isolation was initiated.
* Corresponding author. Mailing address: DuPont Company, Central Research and Development, Biochemical Science and Engineering, Experimental Station, P.O. Box 80173, Wilmington, DE 198800173. Phone: (302) 695-9264. Fax: (302) 695-9183. E-mail: Robert.A
[email protected]. 545
546
WEI ET AL.
RNA isolation. Shaved ice was added to 50-ml samples which were pelleted immediately in a refrigerated centrifuge by spinning at 10,410 ⫻ g for 2 min. Each resultant pellet was resuspended in a mixture containing 100 l of Tris-HCl (10 mM, pH 8.0) and 350 l of -mercaptoethanol-supplemented RLT buffer (Qiagen RNeasy Mini kit; Valencia, Calif.) that was kept on ice. The cell suspension was added to a chilled 2-ml microcentrifuge tube containing 100 l of 0.1-mmdiameter zirconia-silica beads (Blospec Products Inc., Bartlesville, Okla.). The cells were broken by agitation at room temperature for 25 s with a MiniBeadbeater (Biospec Products, Inc.). Debris was pelleted by centrifugation for 3 min at 16,000 ⫻ g and 4°C; the resultant supernatant was mixed with 250 l of ethanol. This mixture was loaded onto Qiagen RNeasy columns from the Qiagen RNeasy Mini kit. RNA isolation was completed by using the protocol supplied with this kit. Incubation for 1 h at 37°C in 40 mM Tris (pH 8.0), 10 mM NaCl, 6 mM MgCl2 with RNase-free RQ1 DNase (1 U/l; Promega, Madison, Wis.) digested any genomic DNA contaminating the RNA preparation. The digestion products were purified by a second passage through an RNeasy column (Qiagen). The product was eluted from the column in 50 l of RNAse-free water prior to determining sample concentration by an A260 reading. RNA preparations were stored frozen at ⫺20°C until use. Synthesis of fluorescent cDNA from total RNA. To a volume brought to 22 l with double-distilled water (ddH2O) were added 6 g of total RNA template and 12 g of random hexamer primers (Operon Technologies, Inc., Alameda, Calif.). Annealing was accomplished by incubation for 10 min at 70°C followed by 10 min at room temperature. cDNA probes were synthesized with SuperScript II reverse transcriptase (10 U/l; Life Technologies, Inc., Gaithersburg, Md.) in the presence of deoxynucleoside triphosphates (dNTPs) (dATP, dGTP, and dTTP, each at 0.1 mM; dCTP at 50 M) and Cy3- or Cy5-dCTP at 25 M. In order were added 8 l of 5⫻ SuperScript II reaction buffer (Life Technologies, Inc.), 4 l of 0.1 M dithiothreitol, 2 l of the dNTP mix (2 mM dATP, 2 mM dGTP, 2 mM TTP, 1 mM dCTP), 2 l of 0.5 mM Cy3- or Cy5-labeled dCTP (Amersham Pharmacia Biotech, Arlington Heights, Ill.), and 2 l of SuperScript II reverse transcriptase. cDNA synthesis proceeded at 42°C for 2.5 h before the reaction was terminated by heating at 94°C for 5 min. The RNA templates were hydrolyzed with 0.25 M NaOH. The reaction was then neutralized by adding HCl and Tris-HCl (pH 6.8). The labeled cDNA was purified with a PCR purification kit (Qiagen), dried, and stored at ⫺20°C. Labeling efficiency was calculated by using the A260 and either A550 for Cy3 incorporation or A650 for Cy5 labeling measurements. Fluorescent copying of genomic DNA. Genomic DNA was isolated from strain MG1655 by a standard procedure (38). Genomic DNA, sheared with a nebulizer to approximately 2-kbp fragments, was used to prepare labeled DNA. Three micrograms of this DNA was mixed with 6 g of random hexamer primers (Operon Technologies, Inc.) in 33 l of ddH2O. DNA was denatured by heating at 94°C prior to annealing on ice for 10 min. Fluorescent copying of the genomic DNA was accomplished with the Klenow fragment of DNA polymerase I (5 U/l; Promega, Madison, Wis.). To the DNA mixture was added 6 l of 10⫻ Klenow buffer (supplied with the enzyme), 3 l of the dNTP mix described above, 12 l of ddH2O, 3 l of 0.5 mM Cy3-dCTP (Amersham Pharmacia Biotech), and 3 l of the Klenow fragment of DNA polymerase I. After a static, 2.5-h incubation at room temperature, the labeled DNA probe was purified with a PCR purification kit (Qiagen) before being dried in a speed vacuum. Amplification of 4,290 E. coli genes. Our amplification method was based on a previously described protocol (31). Specific primer pairs (Sigma Genosys, The Woodlands, Tex.) for each protein-specifying gene of E. coli were used in two consecutive PCR amplifications. Two amplifications were performed to prevent contaminating genomic DNA within the initial PCR product from being spotted to the microarray. Any such carried-over material was eliminated by the “dilution” associated with the second amplification reaction. Genomic DNA (30 ng) was used as the template in the first round of PCR amplification, and 500-folddiluted PCR products served as templates for PCR reamplification. Duplicate 50-l scale reactions were performed in the reamplification. The PCRs were catalyzed with ExTaq polymerase (Panvera, Madison, Wis.) with the four dNTPs (Amersham Pharmacia Biotech) present at 0.2 mM and the primers at 0.5 M. Twenty-five cycles of denaturation at 95°C for 15 s, annealing at 64°C for 15 s, and polymerization at 72°C for 1 min were conducted. A 2-l aliquot of each PCR product was sized by electrophoresis through agarose gels. More than 95% of these resultant second PCR products displayed visible bands of the correct size. Second-round PCR mixtures, devoid of templates and primers, were saved to be spotted onto slides to serve as negative controls for hybridization experiments. Each second-round PCR mixture was purified with 96-well PCR purification kits (Qiagen). The eluant was dried with a vacuum centrifuge. Arraying amplified genes. Twenty microliters of 6 M Na2SCN or 50% dimethyl sulfoxide was added to each dried DNA sample (ⱖ0.1-ng/nl final concentration). A generation II DNA spotter (Molecular Dynamics, Sunnyvale, Calif.) was used
J. BACTERIOL. to array the samples onto coated glass slides (Amersham Pharmacia Biotech). Two aliquots of approximately 1 nl from 1,536 resuspended PCR products were arrayed in duplicate on each slide; three slides were used to order all amplified E. coli genes. To serve as controls, 76 specific E. coli PCR products, 8 amplified genes of Klebsiella pnuemoniae, and 12 plant cDNA clones were also spotted onto each slide. Arrayed glass slides, after baking at 80°C for 2 h, were stored in a desiccator at room temperature under vacuum. Hybridization and washing. Arrayed slides were placed in isopropanol for 10 min, boiled in ddH2O for 5 min, and dried by passage of ultraclean N2 gas prior to prehybridization. The prehybridization solution (PHS) was 3.5⫻ SSC (1⫻ SSC is 0.15 M NaCl plus 0.015 M sodium citrate) (BRL, Life Technologies Inc., Gaithersberg, Md.), 0.2% sodium dodecyl sulfate (SDS; BRL, Life Technologies, Inc.), 1% bovine serum albumin (fraction V; Sigma, St. Louis, Mo.). The hybridization solution (HS) contained 4 l of ddH2O, 7.5 l of 20⫻ SSC, 2.5 l of 1% SDS (BRL, Life Technologies Inc.), 1 l of 10 mg of salmon sperm DNA per ml (Sigma), and 15 l of formamide (Sigma). The slides were incubated at 60°C for 20 min in PHS to block nonspecific binding of probe. The slides were next rinsed five times in ddH2O at room temperature and twice in isopropanol before being dried by the passage of nitrogen. The dried probe was resuspended in the HS and denatured by heating at 94°C for 5 min. Thirty microliters of the probe containing HS was applied to a dried, prehybridized slide, covered with a coverslip (Corning, Corning, N.Y.), and put into a sealed hybridization chamber containing a small reservoir of water to maintain moisture. Hybridization occurred for approximately 14 h at 35°C. Coverslips were removed in washing buffer I (2⫻ SSC–0.1% SDS) warmed to 35°C prior to incubation for 5 min. Next, the slides were washed sequentially for 5 min in 1⫻ SSC–0.1% SDS and 0.1⫻ SSC–0.1% SDS. Slides were then passed through three baths, each passage lasting 2 min, of 0.1⫻ SSC. The slides were dried with a nitrogen gas flow. Data collection and analysis. Hybridization to each slide was quantified with a confocal laser microscope (Molecular Dynamics, Sunnyvale, Calif.) the photomultiplier tube of which was set to 700 and 800 V for the Cy-3 and Cy-5 signals, respectively. The images obtained were analyzed with ArrayVision 4.0 software (Imaging Research, Inc., Ontario, Canada). The fluorescent intensity (Ii) associated with each spotted gene (i) was reduced by subtracting the fluorescence (Ni) of an adjoining, nonspotted region of the slide. These readings (Ri ⫽ Ii ⫺ Ni) were exported to a spreadsheet for further data manipulation. The four “noDNA” spots derived from PCR mixtures devoid of template were controls used to determine the noise (background signal) level. The 96 genes present on each slide were used as internal controls (C96) to derive equivalent readings (ERi ⫽ Ri/C 96j) among the three slides ( j) of an individual whole genome array set. Hybridization to this 96-gene set allowed correction for any difference in the hybridization to the three slides within a set. This accounted for slide-to-slide differences in signal acquisition. For the IPTG induction experiment, it was presumed that the overall transcriptional pattern did not change significantly. Thus, the equivalent reading of each gene was summed (⌺in ER ⫽ ERi); normalization by multiplication with a correction factor (CF) of the summed values and the underlying equivalent readings was performed to equalize the summed readings of the control and treated samples (⌺in ERcontrol ⫽ CF ⫻ ⌺in ERtreated). This allowed calculation of fold induction of each gene’s expression by comparison of each gene’s normalized equivalent reading, norm ER, from a pair of conditions. The fold induction of any gene’s transcript by a chemical treatment is norm ERtreated/ norm ERcontrol, where norm ERcontrol ⫽ ERcontrol and norm ERtreated ⫽ CF ⫻ ERtreated. RNA abundance. To convert normalized equivalent readings into measures of transcript abundance (AB), a further correction was needed. That correction required the hybridization signal arising from an equimolar concentration of all transcripts. The surrogate for this correction factor was the fluorescent intensities arising from hybridization with the fluorescent copy of genomic DNA. Thus, the fluorescent intensities from hybridization with RNA-derived probes were corrected by using fluorescent intensities arising from genomic DNA-derived probes. The abundance of each gene’s transcription product(s) was determined by dividing the normalized equivalent reading of a genomic DNA-derived sample into the normalized equivalent reading from the RNA-derived sample (AB ⫽ norm ERtranscripts/ norm ERgenome). The convention of Riley and Labedan (32) was followed in grouping genes into functional sets. -Galactosidase content. -Galactosidase content was measured by the method of Miller using the combined action of chloroform and SDS to disrupt the cell envelope, thus allowing entry of the substrate (23). Two independent cultures of MG1655 were grown in LB medium at 37°C to densities (A600s) of 0.43 and 0.47, split, treated with 1 mM IPTG for 15 min, and assayed. The data from these two independent experiments performed on different days were averaged.
mRNA INVENTORY OF ESCHERICHIA COLI
VOL. 183, 2001
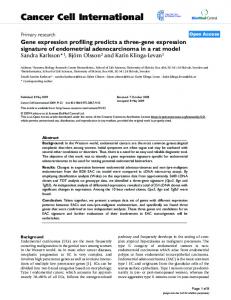
RESULTS Array quality. Preliminary experiments (data not shown) indicated that the fluorescent signals obtained with labeled cDNA derived from random priming of E. coli genomic DNA (3 g) were not saturating and were well within the linear range of the instrumentation. The noise level was determined by averaging the readings of the four control spots derived from PCR mixtures lacking a DNA template after subtracting the background signal derived from an adjacent area that had not been spotted. Using a probe derived from genomic DNA, hybridization signals exceeding noise by a factor of 2 were observed for 4,228 (99.5%) of the 4,290 arrayed genes. Sixty two genes (see Appendix) either failed in PCR amplifications or did not bind sufficient signal to be detected when present at a presumably equimolar ratio with the other genes in the probe sample. Interestingly, 4 (ilvL, leuL, rhoL, and tnaL) of the 27 known genes of this class encode short (⬍300 bp), attenuation leader polypeptides (19). This suggests that short open reading frames ORFs may not be as readily detected with this method as longer genes. IPTG induction. The effect of 1 mM IPTG upon expression of the arrayed genes was investigated. Duplicate RNA preparations of the control and induced cells were each labeled with Cy-3 and Cy-5 by cDNA synthesis. Averaging of measurements was essential for optimal signal detection (Fig. 1). lacZYA induction above the background was detected when the results of a single hybridization experiment in which Cy3-labeled cDNAs derived from treated and control cells were separately hybridized to individual slide sets as viewed in a log-log plot (Fig. 1A). Variation in the measurement of other transcripts was also significant, as indicated by the width of the spread in the data points falling along the diagonal of this scatter plot. Thus, dual-labeling experiments were performed. Improvements were observed by labeling the control sample with Cy-5 and the induced sample with Cy-3 before hybridizing to a single set of three slides (Fig. 1B). However, there was a skewing of the data away from the abscissa (x axis) and towards the ordinate (y axis). This suggested that dye bias could influence the results. Thus, averaging of these results with others obtained by using differentially labeled cDNA samples (induced cDNA labeled with Cy-5 and control cDNA labeled with Cy-3) from the same set of two RNA preparations resulted in a decreased variation between the treated and control samples. Such “label swapping” and/or repetition, which averaged four normalized equivalent readings of each transcript derived from each RNA sample, lessened the skewing and decreased the scatter (Fig. 1C). The experiment depicted in Fig. 1C was replicated; fresh cultures were induced and nucleic acids were processed to yield the data depicted in Fig. 1D. Each data point of the experiments shown in Fig. 1C and D represents four measurements of individual transcript abundance; this repetition when averaged yielded the tight constellation shown in Fig. 1E, which combined the data used to generate Fig. 1C and D. Examination of the extent of hybridization to any individual gene revealed a wide dynamic range with more than a thousand-fold variation in signal intensity between genes (Fig. 1).
547
The expression of only eight genes increased by a factor of more than 2 after exposure to 1 mM IPTG for 15 min (Fig. 1E), while repression by more than a factor of 2 was not observed. These induced genes are listed in Table 1. As expected, the most highly induced RNA ratios (10- to 40-fold) (Table 1) corresponded to the lac operon structural genes, as has been recently reported (31). Measurement of the -galactosidase content of MG1655 cultures treated with 1 mM IPTG for 15 min resulted in 540 ⫾ 60 Miller units (n ⫽ 2), while untreated cultures (n ⫽ 2) yielded 17 ⫾ 9 Miller units. Thus, lac transcription and translation increased in parallel. A commonality among some of the other induced genes was intriguing. b0956, encoding a putative dehydrogenase and preceded by a catabolite activator protein binding site, may have a catabolic function that parallels those of the lac operon and two other induced genes, melA and uxaA. melA encodes an ␣-galactosidase, while uxaA specifies an enzyme of hexuronate catabolism (2). Interestingly, potential melA induction by IPTG was suggested by hybridization of cDNA to an ordered set of clones carrying inserts of the E. coli chromosome (6) and in another microarray experiment (31). The function of the other induced genes is even more speculative; upstream of b1783 is a 54 binding site, while peptidase function is hypothesized for b2324. Induction of these latter genes was not observed by Richmond et al. (31). Estimate of steady-state transcript levels. The percentage of RNA that programs protein synthesis has been determined under a wide variety of growth regimens (4). Here we estimated the fraction of those protein-specifying transcripts devoted to each arrayed gene. Hybridization signals arising from annealing of RNA-derived Cy-3 labeled cDNA populations were normalized by dividing by the signal generated with Cy-3 fluorescent cDNA arising from copying of sheared E. coli genomic DNA as a probe. Each spot’s corrected signal from RNA-derived cDNA hybridization reflected the amount of RNA in the sample. Three RNA samples were thus measured; they were isolated from cells growing exponentially in rich medium, growing exponentially in minimal medium, and cells in minimal medium making a transition from the exponential phase to the stationary phase (for culture conditions, see Materials and Methods). RNAs from certain central metabolic (gapA and ptsH), defense (ahpC and cspC), DNA metabolic (hns), surface structure (acpP, ompACFT, and lpp), translation (rplBCKLMPWX, rpmBCl, rpsACDHJNS, trmD, fusA, infC, and tufAB), transcription (rpoAB), and unassigned (b4243) genes (32) were abundant (⬎0.1%, among the top 100 transcripts) in all three samples. Transcripts of exponential-phase cells cultured in rich medium. High-density microarrays were used to measure the transcriptional content of cells growing in rich medium. A total of 1,776 genes were apparently not expressed; their hybridization signals did not exceed the noise by a factor of 2. Of these nonexpressed genes, function has been ascribed to 465. They are listed in the Appendix. Each gene having an assigned function was expressed in at least one of the two tested stages of cultivation in minimal medium. The other genes, each representing between 0.0007 and 1% of the summed hybridizing signal, were expressed in LB brothgrown cells. The distribution of genes as a function of expression level is plotted in Fig. 2, while Fig. 3 depicts fractional
548
WEI ET AL.
J. BACTERIOL.
FIG. 1. Analysis of IPTG induction. Basal expression levels expressed as normalized equivalent readings were plotted on the ordinate, and induced levels, also normalized equivalent readings, were plotted on the abscissa. (A) Results obtained when two Cy-3-labeled probes were hybridized to duplicate whole genome array sets. (B) Experiment in which the Cy-5-labeled cDNA copy of control DNA and the Cy-3-labeled copy of induced RNA were coannealed to a single slide set. The RNAs used to generate the results in panel B were each labeled with the other dye to allow a “reciprocal” hybridization. The resulting data were averaged with the data presented in panel B to yield the scatter plot depicted in panel C. A second independent set of RNA samples were isolated, their cDNAs were labeled with both dyes, and the products were hybridized in both possible combinations to generate the results depicted in panel D. (E) Averaged results of the two independent experiments depicted in panels C and D.
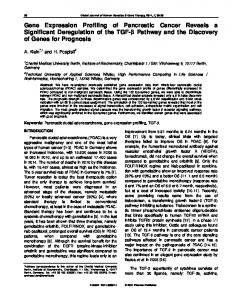
expression as a function of summed genes. The percentage of transcripts was plotted as a function of genes summed in Fig. 3. The order in which genes were summed was based upon expression level, with the most highly expressed gene in each condition summed first. Fewer genes were expressed in LB medium than in minimal medium (Fig. 2); the fraction of rare transcripts was smaller in rich medium (Fig. 3). The 50 most highly expressed genes in LB broth-grown cells are listed in left-most columns of Table 2; 29 of these intensely transcribed genes encode proteins involved in translation and protein folding (2, 22, 32). Table 3 summarizes the steady-state mRNA levels obtained
for several ribosomal protein-specifying operons. Sixty-nine determinations are reported, of which 63 (greater than 90%) exceeded 500 ppm (parts per million) (0.05%). Of those measurements not meeting this threshold, two (rpsL and yceD) were associated with poor-quality PCR products (see Table 3, footnote). The other four (secY, rpmJ, dnaG, and rpoD) represented hybridization to the penultimate or final genes of operons. Moreover, gradients of transcript levels were observed for the Spc, S10, L10(), S15, L35, S21 (), and L13 operons. The bases of such gradients were not investigated. Transcripts of exponential-phase cells cultured in defined minimal medium. The gene expression pattern of cells growing
mRNA INVENTORY OF ESCHERICHIA COLI
VOL. 183, 2001
549
TABLE 1. Genes with elevated expression after IPTG treatment Level of expression ina: Gene
lacA lacZ lacY b2324 uxaA b1783/yeaG melA b0956/ycbG
Thiogalactoside acyltransferase -Galactosidase Galactoside permease Peptidase? Altronate hydrolase ? ␣-Galactosidase Hydrogenase?
Minimal medium
LB medium
Function
Exponential phase
Transition phase
Uninduced ppm
Uninduced rank
IPTG induction (fold)
ppm
Rank
ppm
Rank
40 89 61 280 290 370 41 260
3,747 2,420 3,125 621 575 401 3,729 678
36.0 29.0 14.0 5.3 4.0 3.6 2.9 2.5
0.25 2 6 73 78 320 14 140
4,244 3,879 4,202 2,639 2,530 576 4,050 1,573
21 20 16 54 90 1,000 17 130
3,816 3,849 3,975 2,717 1,990 136 3,966 1,529
a ppm, fraction of particular transcript/summed transcripts hybridizing to all ORFs on the microarrays expressed in ppm; rank, genes ranked in order of expression, with 1 being the most highly expressed gene for each of the experiments.
exponentially in minimal medium was also examined. At this cell density, the pH remained at 7.0. Expression levels varied from 0.001 to 0.7%. Apparently, as illustrated in Fig. 2, biosynthetic requirements mandated that a significantly greater fraction of the genome was expressed in minimal medium. Only 776 genes were expressed negligibly (signal/noise ratio of ⬍2); 149 of these genes have presumed or demonstrated function. They are listed in the Appendix. The 50 genes most highly expressed in logarithmically growing cells cultured in minimal medium with glucose as a carbon or energy source are enumerated in middle columns of Table 2. The distribution of genes as a function of expression level (Fig. 2) and the fractional expression as a function of summed genes with genes ranked by expression level (Fig. 3) were also plotted. Such broad-distribution analyses readily revealed the significant differences observed in expression of E. coli when grown in defined and rich media. In minimal media, many more genes were transcribed over a somewhat broader range.
FIG. 2. Distribution of expressed genes. The histogram plots number of genes as a function of expression range. Diagonally striped, solid, and horizontally striped bars reflect distributions observed in RNAs derived from cells growing exponentially in minimal medium, cells transitioning to the stationary phase in minimal medium, and cells growing exponentially in rich medium, respectively. Expression of 766, 1,030, and 1,776 genes was not detected under the three respective conditions.
Eight biosynthetic genes became highly expressed (Table 2). Notable among them were metE, encoding the aerobic methionine synthase, and ilvC, an isoleucine-valine biosynthetic gene subject to feed-forward transcriptional activation (35) by its substrates. Both the ilvC (27, 39)- and metE (10)-encoded enzymes are sluggish catalysts. The metE product accounts for about 5% of E. coli protein when cells are cultured in minimal medium with glucose as a carbon or energy source (36). Other highly expressed biosynthetic genes included folE and cysK;the folE product, GTP cyclohydrolase I, catalyzes both cleavage of the 5-membered ring of guanine and the rearrangement of the ribose moiety of the substrate, GTP (9). cysK, encoding o-acetylserine (thiol)-lyase isozyme A, is responsible for more than 90% of sulfur fixation under aerobic conditions (17). Transcripts of the pyrBI operon encoding aspartate transcarbamylase also were highly expressed during exponential growth in minimal medium relative to an LB broth-grown culture. This expression level is a characteristic signature of strain MG 1655, whose aspartate transcarbamylase content is elevated more than 100-fold when grown in the absence of uracil due to an
FIG. 3. Fractional expression. The extent of ORF transcripts is plotted as a function of genes summed. The order in which genes were summed was based upon expression level, with the most highly expressed gene summed first.
550
WEI ET AL.
J. BACTERIOL. TABLE 2. Highly expressed genes under three different culture conditions
Genea
ppm (100) in LB medium (exponential phase)b
Genea
ppm (100) in minimal medium (exponential phase)b
Genea
ppm (100) in minimal (transition phase)b
infC (TA) rplK (TA) rplL (TA) rplA (TA) hemK rpmI (TA) rplW (TA) rplJ (TA) acpP lpp glpQ fusA (TA) gatB rpsF (TA) tufB (TA) ompC mopB (PF) atpF hns rpmB (TA) ompA tnaA rpoA trmD (TA) rplI (TA) gapA (CM) rplM (TA) rpmG (TA) rpsC (TA) rplT (TA) rplX (TA) priB ompF hupA rpsJ (TA) rplB (TA) rplU (TA) tig (PF) tufA (TA) rplD (TA) rplC (TA) gatA rpsA (TA) gatY rpsS ppa gatZ cspE (SR) cspC (SR) mopA (PF)
70 68 66 48 47 46 44 43 42 40 39 39 38 38 37 37 35 35 35 34 33 33 33 32 31 30 28 28 27 27 27 26 25 25 25 25 25 24 24 24 24 24 24 23 23 22 22 21 21 21
cspA (SR) metE (BS) tufB (TA) ompA ilvC (BS) rmf (TA) tufA (TA) ompT infC (TA) ahpC (SR) rplM (TA) ptsH (CM) aceB (CM) lpp rpsJ (TA) cirA gapA (CM) rpmI (TA) yjjS rpmC (TA) fusA (TA) b2745 ompF cspC (SR) aceA (CM) pyrB (BS) rplK (TA) rpsD (TA) cysK (BS) ptsI (CM) b1452 rpsS (TA) fepA pyrI (BS) aroF (BS) rpsH (TA) rpsN (TA) b0805 ompC rpsA (TA) thrL (BS) rplX (TA) rplL (TA) rpsM (TA) b4243 rplB (TA) b0817 folE (BS) icdA (CM) rplW (TA)
54 50 48 46 42 38 38 37 36 34 31 31 30 29 28 28 26 26 26 24 24 24 23 22 21 21 21 21 20 20 19 19 19 18 18 17 17 17 17 17 17 16 16 16 16 16 16 15 15 15
hdeA (SS) hdeB (SS) rmf (TA) dps (SS) lpp ompC icdA (CM) metE (BS) gapA (CM) tufA (TA) ompA infC (TA) uspA (SR) tufB (TA) ilvC (BS) rpsN eno (CM) ahpC (SR) ompT gadA (SS) aceB (CM) rplX (TA) fusA (TA) ptsH (CM) rpsD (TA) b3512 gpmA (CM) metK (BS) rpmC (TA) gadB (SS) rpsV (TA) cysK (BS) rpsJ (TA) rpsH (TA) rplE (TA) aceA (CM) b2266 rplM (TA) rpsS (TA) nlpD acpP rpmI (TA) rpoS (SS) rpoA hns b4253 rplB (TA) b1452 b0817 b1003
160 99 83 65 63 59 59 53 49 49 44 44 40 39 37 36 36 35 33 33 33 32 32 31 29 29 28 28 27 27 27 26 25 25 25 25 23 23 23 22 22 22 21 20 20 20 20 19 19 19
a PF, protein-folding genes; SR, stress-responsive genes; CM, central metabolic enzyme-specifying genes; BS, biosynthetic genes; TA, translation-associated genes; SS, rpoS (sigma S)-controlled genes. b Fraction of transcripts hybridizing to specified gene/summed transcripts hybridizing to all ORFs on the microarrays (expressed in ppm).
rph mutation that is polar on pyrE (13). The other highly expressed transcripts, thrL and aroF, encoded, respectively, the threonine leader polypeptide (19) and the phenylalanine-inhibited first enzyme of the common aromatic pathway. The aroF product, one of three isozymes, is estimated to account for more than 80% of the activity catalyzing the first common step of aromatic amino acid synthesis (28). Expression of several genes catalyzing fueling reactions was also elevated. As expected, ptsHI transcripts encoding phosphotransferase sugar transport common components (29) ac-
cumulated to a very high titer in glucose-minimal medium. Surprisingly, aceAB, encoding the glyoxylate shunt enzymes malate synthase and isocitrate lyase (7), was highly expressed. Perhaps the tricarboxylic acid (TCA) cycle functions in its branched state during this phase of growth requiring the glyoxylate shunt for anapleurotic replenishment (24). Alternatively, at this culture density, the cells have started to use the accumulated acetate. These data were further analyzed by examining individual transcript levels within the context of operon structure (Table
mRNA INVENTORY OF ESCHERICHIA COLI
VOL. 183, 2001
TABLE 3—Continued
TABLE 3. Expression of operons encoding ribosomal proteins in an exponential-phase culture in LB medium Operon (min)
Spc (73)
S10 (73)
␣ (73)
Str (73)
Genea
Rank
L14 L24
8.6 27.1
122 31
L5 S14 S8 L6 L18 S5 L30 L15 SecY L36
10.0 17.2 13.7 6.9 14.9 11.6 5.4 5.8 1.9 4.0
102 59 79 167 70 87 227 206 1053 359
(TR) rpsJ rplC rplD rplW rplB rpsS rplV rpsC rplP rpmC rpsQ
S10 L3 L4 L23 L2 S19 L22 S3 L16 L29 S17
24.6 23.9 24.0 43.9 24.6 22.8 15.7 27.4 19.1 13.6 7.8
35 41 40 7 36 45 66 29 53 80 142
(TR) rpsM rpsK rpsD rpoA rplQ
S13 S11 S4 ␣ L17
8.1 8.4 15.3 32.6 7.1
136 128 67 23 163
S12
0.9
2291
S7 EF-G EF-Tu
10.0 38.5 24.1
99 12 31
L11 L1
68.0 48.0
2 4
L10 L7/12
43.4 66.4
8 3
 ⬘
11.4 5.0
89 258
S15
16.0
63
Pnp
5.7
215
16.9 14.2
60 76
6.9 5.3
166 237
33.5 27.5
20 28
rplN rplX (TR) rplE rpsN rpsH rplF rplR rpsE rpmD rplO secY rpmJ
rpsLc (TR) rpsG fusA tufA (TR) rplK rplA
L10 or  (90)
(TR) rplJ rplL (TT) rpoB rpoC (TR) rpsO (TT) pnp
S2 (4)
rpsB tsf
S2 EF-Ts
L34 (83)
rpmH mpA
L34 RNAse P
L28 (82)
rpmB rpmG
L28 L33
Genea
Proteinb
infC (TR) rpmI rplT
IF3
70.2
1
L35 L20
46.2 27.2
6 30
S20 (0)
rpsT
S20
5.3
235
S1 (21)
rpsA
S1
23.8
43
S6 (95)
rpsF priB rpsR rplI
S6 n S18 L9
38.3 26.4 19.0 30.6
14 32 54 25
S21 or (67)
rpsU dnaG rpoD
S21 DnaG 70
17.3 2.1 4.2
58 875 876
L25 (48)
rplY
L25
16.7
61
L28 (82)
rpmB rpmG
L28 L33
33.5 27.5
20 28
L32 (24)
yceDd rpmF
ORF L32
1.4 9.7
1463 107
L13 (70)
rplM rpsl
L13 S9
28.0 8.0
27 140
trmD (57)
rpsP b2608 trmD rplS
S16 ORF TrmD L19
11.2 10.1 32.3 6.3
90 98 24 185
Operon (min)
ppm (100)
L11 (90)
S15 (69)
Proteinb
551
Continued
L35 (38)
ppm (100)
Rank
a Genes within operons are listed in the order in which they are transcribed. TR, sites of translational repression; TT, sites of transcriptional termination (15). b Ribosomal proteins are indicated by their standard alphanumeric designations (15). Other proteins are involved in translation (EF-G, EF-Tu, EF-Ts, and IF3), secretion (SecY), transcription (␣, , ⬘, and 70), RNA maturation and turnover (RNase P, TrmD, and Pnp), or replication (n and DnaG) (32). c Multiple PCR products were derived from the rpsL-specific amplification. d The yceD product was not of the expected size.
4). Results with selected amino acid biosynthetic operons are presented in conjunction with the operon responsible for phosphoenolpyruvate: carbohydrate phosphotransferase system (PTS)-mediated sugar uptake. These biosynthetic operons are predominantly controlled by attenuation. Detection of attenuator transcripts was difficult (see above and the Appendix) this difficulty was compounded by the multiple PCR products obtained after amplification of hisL (Table 4). The thr leader was found to be more highly expressed than the cognate structural genes; this was not observed when the trp or his operons were analyzed. The most poorly expressed of the listed genes was ilvY, which encodes a specific DNA binding protein that activates ilvC transcription while repressing its own synthesis (35). Conversely, ilvC was the most highly expressed of this group, as was indicated in Table 2. Measurement of pts operon expression ranged from 1,200 to 3,100 ppm; a gradient of transcript levels was observed for pts. Multiple promoters and termination sites, a hallmark of this operon (29), might provide a basis for this observation.
552
WEI ET AL.
J. BACTERIOL.
TABLE 4. Expression of some amino acid biosynthetic operons and the PTS operon in an exponential-phase culture in minimal medium Operon
Histidine
Isoleucine-valine
IRc regulator IR ALSd I ALS III Leucine
Threonine
Tryptophan
Proline AB Proline C Arginine E Arginine CBH PTS
Genea b
hisL hisG hisD hisC hisB hisH hisA hisF hisI ilvG ilvM ilvE ilvD ilvA ilvYⴱⴱ ilvCⴱ ilvB ilvN ilvIb ilvH leuA leuB leuC leuD thrL thrA thrB thrC trpL trpE trpD trpC trpB trpA proA proB proC argEⴱⴱ argCⴱ argBⴱ argHⴱ ptsH ptsI crr
ppm (100)
Rank
3.3 5.6 2.5 3.7 3.3 2.1 1.8 2.5 4.2 7.5 2.5 2.9 1.6 0.6 0.4 41.7 1.3 1.7 2.9 3.0 11.3 10.9 6.3 9.6 16.8 4.0 5.4 7.9 6.6 6.8 4.3 10.4 11.6 13.2 2.5 2.4 1.1 1.6 2.0 2.9 2.2 31.0 19.6 11.9
556 265 818 490 555 1,000 1,185 824 417 171 827 668 1,360 3,038 3,373 5 1,765 1,295 662 632 82 93 215 115 41 442 276 160 199 189 396 102 77 64 835 863 1,994 1,353 1,088 684 967 12 30 74
a Genes within operons are listed in the order in which they are transcribed (2), except for the divergent clusters, where the sites of initiation lie between the genes labeled with one and two asterisks. b Multiple PCR products were derived from the ilvI- and hisL-specific amplifications. c IR, isomeroreductase. d ALS, acetolactate synthase.
Comparable expression of genes within an operon was observed; the proA and proB mRNA titers were 240 to 250 ppm, while those for ilvl and ilvH were 290 and 300 ppm. Similarly, the ilvBN transcription level was found to be 130 ppm when ilvB was immobilized on the microarray and 170 ppm when ilvN was the capture reagent in the hybridization. Measures of argC, argB, and argH mRNA quantities differed by less than 50%, ranging from 200 to 300 ppm. Levels of mRNA from the leu operon were within a factor of 2, as were those of the thr structural genes. Measures of trp and his expression were within a factor of 3. Determinations of ilvGMEDA operon transcript levels were more variable; they ranged from 750 ppm for ilvG to 60 ppm for ilvA. There might be a biochemical basis
for this variation, since transcript level paralleled gene order within the operon. Transcripts of cells making a transition from the exponential phase to the stationary phase in defined minimal medium. During this transition, at a point where the pH had dropped slightly to 6.7, significant changes in gene expression were expected and observed. Expressed gene levels were from 0.0023 to 1.6%. A total of 1,030 genes, of which 110 have a defined role (Appendix) did not appear to be expressed at this transitional phase of growth. The 50 genes most highly expressed genes during this transition are listed in the rightmost columns of Table 2. Significantly, several rpoS-regulated genes, including hdeA (10-fold transcript elevation in comparison to the exponential-phase content) (12), hdeB (9-fold) (12), dps (4-fold) (12), gadA (8fold) (5), and gadB (10-fold) (5), as well as rpoS (3-fold) (12) itself, became highly expressed. Despite this remodeling of transcription, the overall patterns of gene number as a function of expression level (Fig. 2) and fractional expression as a function of ranked gene (Fig. 3) were not as distinct as one might imagine in comparison to the patterns from exponentially growing cells. Compilation. The observed expression patterns are summarized in Table 5, where gene products were grouped by metabolic function according to an established classification scheme (32). Exponential growth in minimal medium elevated the amount of pyrimidine and amino acid biosynthetic transcripts with respect to growth in the rich broth, LB. In contrast, cofactor and purine transcripts did not appear to accumulate relative to growth in LB broth. Expression of glyoxylate shunt and other glucose metabolism-related transcripts was also elevated in minimal medium; the seven-fold elevation of glyoxylate shunt transcripts exceeded the average of that observed for amino acid biosynthetic mRNAs. Expression of genes involved in sulfur fixation was also elevated during growth in minimal medium. The rapid growth observed in the LB broth was reflected in the gene expression profile, as was the difference in carbon or energy source between glucose and amino acids. LB brothgrown cultures displayed elevated expression of genes specifying glucogenic enzymes and of genes whose products degrade small molecules. Expression of the ATP and proton-motive force-generating machinery, elevated by a factor of about 2, paralleled increased ribosomal protein, aminoacayl-tRNA synthetase and protein folding-associated expression. Changes observed upon entering the transitional period between exponential and stationary phase growth in glucose minimal medium were less dramatic. Nonetheless, elevation of mRNAs specifying gluconeogenic, glycogenic, and TCA cycle enzymes was observed as was an increase in transcripts encoding enzymes responsible for metabolic pool interconversions and the nonoxidative branch of the hexose monophosphate shunt. Perhaps, as a prelude to the stationary phase, the cell needs to increase its ability to capture energy or convert specific, biosynthetic end products into other, alternative small molecules, such as trehalose. This sugar, whose accumulation occurs during stationary phase in a S-dependent fashion, serves as an osmoprotectant (11). The cell also displayed an increased titer of protein folding and global regulatory function transcripts while making a transition between growth phases.
mRNA INVENTORY OF ESCHERICHIA COLI
VOL. 183, 2001
553
TABLE 5. Summary of three E. coli expression profiles Abundance (100 ppm) in: Characteristic (no. of genes summed)
Cell processes Cell division (26) Chemotaxis and motility (12) Folding and ushering proteins (7) Transport of large molecules: protein, peptide secretion (32) Transport of small molecules Amino acids, amines (49) Anions (20) Carbohydrates, organic acids, alcohols (82) Cations (52) Nucleosides, purines, pyrimidines (6) Other (12) Elements of external origin Laterally acquired Phage-related functions/prophages (27) Plasmid-related functions (1) Transposon-related functions (34) Global functions Energy transfer, ATP proton motive force (9) Global regulatory functions (51) Macromolecule metabolism Basic protein synthesis, and modification (6) Degradation of: DNA (23) RNA (11) Polysaccharides (3) Proteins and peptides (61) Synthesis and modification of: DNA (89) Lipoprotein (11) Phospholipids (11) Polysaccharides (cytoplasmic) (6) Protein translation and modification (34) RNA synthesis (27) Macromolecules Glycoprotein Lipopolysaccharide (13) tRNA modification and charging (40) Metabolism of small molecules Amino acid biosynthesis (110) Biosynthesis of cofactors, carriers (115) Central intermediary metabolism 2⬘-Deoxyribonucleotide metabolism (12) Amino sugars (10) Entner-Douderoff (3) Gluconeogenesis (4) Glyoxylate bypass (5) Other metabolism of glucose (3) Nonoxidative branch, pentose pathway (8) Nucleotide hydrolysis (2) Nucleotide interconversions (13) Phosphorus compounds (17) Polyamine blosynthesis (8) Nucleoside and nucleotide salvage (18) Sugar-nucleotide synthesis, conversion (18) Sulfur metabolism (10) Pool, interconversion (46) Degradation of small molecules Amines (9) Amino acids (17) Carbon compounds (90) Fatty acids (10) Others (8) Energy metabolism, carbon Aerobic respiration (27) Anaerobic respiration (80) Electron transport (24) Fermentation (21) Glycolysis (18)
Minimal medium Exponential phase
Transition phase
LB medium (exponential phase)
110 14 32 82
100 7 61 101
100 11 110 100
91 29 200 120 10 21
81 28 160 98 9 27
68 23 340 76 17 12
240 55 2 58
170 42 6 35
230 65 9 38
77 176
54 290
150 180
47
48
74
38 29 6 84
30 15 3 93
31 22 4 110
230 41 20 15 290 100
190 50 15 16 300 100
310 37 21 6 430 150
15 130
12 130
18 210
120 720
93 690
33 640
34 12 4 9 76 9 26 1 41 32 16 37 42 39 120
32 11 3 12 75 5 43 1 39 30 13 38 34 25 190
32 15 6 21 12 4 43 3 20 22 13 54 48 10 210
16 22 140 20 15
10 14 110 17 21
25 72 250 30 8
77 75 32 40 130
58 57 24 50 240
120 110 48 44 150
Continued on following page
554
WEI ET AL.
J. BACTERIOL. TABLE 5—Continued Abundance (100 ppm) in: Characteristic (no. of genes summed)
Oxidative branch, pentose pathway (2) Pyruvate dehydrogenase (6) TCA cycle (18) Fatty acid biosynthesis: fatty acid and phosphatidic acid synthesis (23) Nucleotide synthesis Purine ribonucleotide synthesis (22) Pyrimidine ribonucleotide biosynthesis (10) Miscellaneous: not classified (109) ORFs: unknown proteins (1,324) Processes Adaptation Atypical conditions (16) Osmotic (14) Protection responses Cell killing (3) Detoxification (11) Drug or analog sensitivity (32) Structural elements Cell envelope Murein sacculus, peptidoglycan (34) Outer membrane constituents (17) Cell exterior constituents (16) Surface polysaccharides and antigens: surface structures (57) Ribosome constituents Ribosomal and stable RNAs (3) Ribosomal proteins (64) Ribosomal maturation and modification (6) ORFs not listed (102)
DISCUSSION Comprehensive expression profiling has been performed previously with the yeast Saccharomyces cerevisiae (8). Here we report that such profiling can also be accomplished and refined by using a dye-swapping, high-density microarray technology when the prokaryote E. coli is used as an experimental system. Adaptation of RNA isolation and labeling protocols from eukaryotes to prokaryotes is not straightforward, because eukaryotic mRNA manipulations often exploit the specific 3⬘-polyadenylation of this molecular species. The short half-life of bacterial mRNA is another obstacle. We chose to isolate RNA by a standard procedure that included a centrifugation step and to reverse transcribe bulk prokaryotic RNA to prepare our hybridization probe. Thus, the reported measurements are subject to possible systematic errors, including differential mRNA stabilities (18). Despite the large amount of stable RNA in the sample, hybridization to protein-encoding genes was readily detected. Recently, independent studies of E. coli (31, 34) successfully applied nylon-based medium-density DNA array or glass-based high-density DNA array technologies to assess gene expression changes in response to growth medium and heat shock. Nonetheless, errors could be introduced in the many steps from RNA purification to analyses of hybridization signals. As shown in Fig. 1, conditions have been optimized to yield highly reproducible data. The scatter plot of the optimized protocol (Fig. 1E) illustrated that measurements of gene expression were still subject to considerable variation when the signal was in the lowest part of the detectable range. It was found that
Minimal medium Exponential phase
Transition phase
LB medium (exponential phase)
46 89 73 190 110 79 220 3,500
41 120 94 130 77 49 230 3,400
40 93 150 100 83 18 250 2,600
120 38
83 63
74 26
5 80 42
3 83 31
3 97 38
95 230 37 75
120 260 39 51
130 200 62 52
790 56
860 110
1,500 7
expression of only eight genes was effected by IPTG treatment; all were induced. It was reassuring that the expected lacZYA induction was observed; the significance of the weaker inductions awaits confirmation by complementary techniques, perhaps based upon enzyme assay of gene fusions or analysis of an isogenic pair of strains differing in lacI. Such a correlation has been provided for IPTG induction of melA expression (31). Thus, such comprehensive gene expression profiling generates hypotheses requiring further study for verification. Having developed confidence in the technology, it was applied to monitoring expression as a function of growth stage and medium. For these experiments, normalization of signal intensity was essential. Probe, derived from replication of genomic DNA and used as a replica of equimolar transcription of the entire genome, allowed calculation of mRNA inventories. Thus, we have provided measures of steady-state transcript levels under prescribed sets of conditions rather than the fold change in mRNA titers that represents the difference in expression between two conditions. These inventories were satisfying in several ways. First, the most highly transcribed genes in actively growing cells cultured in LB medium often encoded proteins involved in translation. In contrast, cultures at a similar growth stage in glucose minimal medium expressed to a very high level several small molecule biosynthetic genes and the means to utilize glucose. Thus, agreement between this molecular analysis and the accumulated understanding of E. coli physiology (24, 25) was observed. This agreement was underscored in the analysis of cells making a transition from the exponential growth phase to
VOL. 183, 2001
the stationary phase; the elevated expression of several rpoScontrolled genes corresponded to expectations. Nonetheless, some caution is necessary; potential effects of differential mRNA stability (18) have yet to be considered. It is most unlikely that the technology is limited to highly expressed genes. First, reproducible expression measurements were obtained over a wide dynamic range (Fig. 1E). Second, the data from Fig. 3 and Table 1 illustrate that lac operon expression, although low before IPTG induction, was detected, suggesting that most transcripts can be readily measured by the techniques described. The lower limits of expression that can be observed may be defined by the analyses of well-characterized “promoter-down” mutants (30) or “spiking” experiments. In the latter, the templates for cDNA synthesis would contain constant amounts of total RNA derived from a deletion mutant to which various quantities of a corresponding transcript synthesized in vitro has been added. Compiling of data (Table 5) into functional groups (32) has become one method for the analysis of gene expression profiles. Work such as that presented here indicates that these categories do not respond as a bloc; rather subsets act differently, as has been observed for amino acid biosynthesis during a study of yeast (14). Nonetheless, such analyses allow global trends to be observed and the integration of gene expression patterns with the cell’s overall physiological status. The histogram (Fig. 2) allows one to appreciate the quantity of transcripts that falls within each expression range. Figure 3 provides an indication of how transcriptional capacity is distributed under the three distinct conditions that were examined. Moreover, unexpected results worthy of further study are found within the compilation presented in Table 5. Unlike transcripts dealing with energy transfer, ribosomal proteins, translation and aminoacyl-tRNA formation which were elevated in LB broth-grown cells, the sum of mRNAs specifying cell division proteins did not vary under the three conditions that were investigated. In a similar vein, hybridization to genes involved in the synthesis of the cell envelope was not increased when the probe was derived from cells cultured in LB broth. In such global analyses, the reliability of the data obtained is an issue. The method described here makes four measurements of the transcript level present in each RNA sample. Moreover, the organization of genes into operons provides internal benchmarking of the measurements. Analyses of transcripts from ribosomal protein, biosynthetic, and PTS operons (Tables 3 and 4) suggests that the data are of high quality, since the range of the measurements for each operon is rather small. Such an analysis is consistent with the methodological improvements illustrated in Fig. 1. Thus, an initial mRNA inventory was compiled. We believe that our analyses are subject to errors in measures of transcripts smaller than about 300 nucleotides and failures in PCR amplification. The compilation illustrated several physiological points. The protein biosynthetic demand during growth in rich medium was noted, accounting for about 15% of the polypeptide-specifying transcripts; what may be as significant is that more than one-quarter of all protein-specifying transcripts under any of the measured conditions lack a functional assignment. Consequently, gene expression profiling provides a further impetus to the continued study of E. coli.
mRNA INVENTORY OF ESCHERICHIA COLI
555
APPENDIX E. coli genes not giving a detectable signal when hybridized with genome-derived DNA were as follows: acrB, agaC, arcB, cydA, dacB, dnaT, entC, entF, exo, fruL, ilvL, leuL, lytB, pheL, phnA, potH, potl, putA, rbsD, rfaB, rhlB, rhoL, sdhC, selB, tdcA, tnaL, b0177, b0250, b0269, b0271, b0291, b0322, b0574, b1437, b1595, b1824, b1978, b2067, b2086, b2088, b2097, b2270, b2292, b2630, b2641, b2851, b2878, b3194, b3596, b3597, b3672, b3678, b3696, b3697, b3705, b4002, b4253, b4280, b4404, and b4405 Genes having a known function but not expressed when cells were cultured in rich medium were as follows: aas, acpDS, acrF, adiY, agaABDIRSVW, ais, alkB, alpA, apaGH, appY, aqpZ, araBEH, argACT, aroDE, arp, arsCR, artIMQ, asr, betIT, bglBG, bioCH, blc, bolA, cadAC, caiBF, cbl, cchB, ccmABCD, cdd, celAC, chaB, cheBRWYZ, chpAR, cmtAB, cof, cpsG, creB, criR, csgABDFG, cspBF, cvpA, cybC, cynST, cysHJUW, dam, dedA, deoR, dgkA, dicBC, dinIJ, dmsBC, dniR, dppBC, dsbE, dsdCX, dsrB, eaeH, ebgC, ecpD, emrY, endA, entDE, envRY, erfK, evgAS, exbB, farR, fdnI, fecIR, feoA, fepBDE, fes, fic, fimD_1, fimFGZ, fixX, flgACGHLMN, flhAD, fliACEFGJLMOPQRSTZ, folP, frdC, frvARX, frwD, ftsKL, fucAKORU, fumC, gabP, gadB, galKMPR, gapC, gatR, gcl, gcvA, gefL, gidB, gip, glcCDG, glgS, glnBK, glpEG, gltBDF, glvBCG, gntKUV, grxA, gusC, gutM, hdeAB, hdhA, hemH, hha, hhoB, hlpB, hlsMQ, hnr, hofBDFGH, holBE, hrpA, hslJS, htrCE, hyaBCDE, hybBDEFG, hycABDFGHI, hydN, hypACD, ibk, icc, ilvMNY, insA_2, insA_3, insA_4, katE, kch, kdgT, hdpE, kdtB, kduDI, kefC, lacA, lar, ldcC, leuDO, lhr, lit, livK, lrp, lysAR, marBR, may, mcrA, mdlB, mepA, metACR, mhpBE, moaD, moeB, molR, mreD, mscL, msyB, mukB, mutHY, nac, napBCFH, narIJZ, nel, nhaR, nikBDE, nirCD, nlp, nlpC, nrdEFG, nrfBFG, nupG, ogrK, osmBCE, pabA, panF, pfkB, pgpB, pheM, phnBCDFGHJKLOQ, phoBH, phpB, phrB, pinO, pitB, pnuC, potFG, ppdABCD, ppiC, prfH, priC, prkB, prmA, proBVW, prsA, pshM, psiF, pspBC, pssR, pstA, pth, ptrB, ptsO, purE, pyrIL, racC, rarD, rcsA, recDT, relBEF, rem, rfaHKYZ, rhaDRSCD, rimL, rmf, rna, rnb, rnhB, rnk, rpiBR, rpmHJ, rpsV, rspAB, sanA, sapBC, sdiA, sfa, sieB, slp, smf, smg, smpA, sms, sodC, sohA, soxRS, speBC, sprT, srlB, sspB, sugE, sulA, surE, syd, talC, tap, tdcCR, tdk, tehB, tesB, thiEH, thrLS, torADRT, tpr, treR, trkG, trpL, ubiX, ugpE, uhpT, uidA, umuD, ung, usg, uxaBC, vsr, wcaB, xapR, xasA, xerD and xylFH. Several operons have component genes that were apparently expressed and others that were not. Such inconsistencies (found in the dms, dpp, lac, nik, sap, and tdc operons) were not resolved. Genes without a known role are not listed. The “well-defined, though quiescent” genes in cells growing exponentially in minimal medium were as follows: acpS, adiY, agaBDIV, alpA, aapZ, arsC, aslB, cadBC, caiBF, cchAB, cdsA, chpABRS, cmtAB, criR, csrA, cynST, deoR, ebgC, ecpD, emrB, envR, eutEJ, feoA, fimD_1, fimZ, fixAX, figAFH, frdC, frvARX, frwCD, fucAIKOU, galK, gcl, gefL, gip, glcG, glgS, glnBK, glpEGLTBK, glvBC, gntV, greA, grxA, gutM, hofB, hrsA, hyaE, hybFG, hycABFGHI, hydN, hypAC, kdgT, kdpC, hdtB, kefC, lacZYA, lar, leuO, malG, mbhA, mcrC, mhpB, mreD, nanA, nikBE, nirCD, nlp, nrdG, nrfBCFG, oraA, pheM, phnCDL, pinO, ppdABCD, priC, prmA, pshM, ptrB, racC, rfaZ, rhaD, rhsC, rnk, rpiR, rspB, sdaB, sieB, smpA, sms, sprT, srlABDR, tdcB, thrS, tnaB, ttdAB, ublH and uhpT. Genes of unknown function are not listed. One hundred ten genes that were “silent” during transition of a culture from the exponential phase to the stationary phase in minimal medium are as follows: agaASW, ais, alkB, araFH, arsR, asr, bglG, ccmBCD, celA, cheWY, cpsG, cspBF, cvpA, cycW, dedA, dicBC, dsbE, dsrB, emrY, endA, evgS, fdnI, flgBCDGM, fliEFGHJLNOPQRT, gatR, glcD, gntKU, gusC, hdhA, hemK, hipB, hisMQ, hofFGH, holE, hrpA, hyaC, hybDE, hypD, kduI, lysR, malI, marBR, motA, napBCFH, narV, nuoAK, nupG, ogrK, pgsA, prfH, psrA, pspBC, pstA, pryL, rcsA, recT, relF, rhaR, rnb, sapBC, sdhD, sdiA, sfa, soxS, tdcCR, tdk, tpr, trkG, ubiX, uldAB, umuD, usg, and uxaB. Not listed are genes whose function is yet to be elucidated. ACKNOWLEDGMENTS We thank T. Van Dyk, Z. Xue, L. Huang, and D. Smulski of the DuPont Company for helpful comments on this work. We are grateful to Dana Smulski for performing growth measurements. D. Zimmer and S. Kustu, University of California, suggested the mathematical formalism describing the data manipulations; we greatly appreciate that input.
556
WEI ET AL.
J. BACTERIOL. REFERENCES
1. Bachmann, B. J. 1996. Derivations and genotypes of some mutant derivatives of Escherichia coli K-12, p. 2460–2488. In F. C. Neidhardt, R. Curtiss III, J. L. Ingraham, E. C. C. Lin, K. B. Low, B. Magasanik, W. S. Reznikoff, M. Riley, M. Schaechter, and H. E. Umbarger (ed.), Escherichia coli and Salmonella: cellular and molecular biology, 2nd ed., vol. 2. ASM Press, Washington, D.C. 2. Berlyn, M. K., K. B. Low, and K. E. Rudd 1996. Linkage map of Escherichia coli K-12, edition 9, p. 1715–1902. In F. C. Neidhardt, R. Curtiss III, J. L. Ingraham, E. C. C. Lin, K. B. Low, B. Magasanik, W. S. Reznikoff, M. Riley, M. Schaechter, and H. E. Umbarger (ed.), Escherichia coli and Salmonella: cellular and molecular biology, 2nd ed., vol. 2. ASM Press, Washington, D.C. 3. Bochner, B. R., and B. N. Ames 1982. Complete analysis of cellular nucleotides by two-dimensional thin layer chromatography J. Biol. Chem. 257: 9759–9769. 4. Bremer, H., and P. P. Dennis. 1996. Modulation of chemical composition and other parameters of the cell by growth rate, p. 1553–1569. In F. C. Neidhardt, R. Curtiss III, J. L. Ingraham, E. C. C. Lin, K. B. Low, B. Magasanik, W. S. Reznikoff, M. Riley, M. Schaechter, and H. E. Umbarger (ed.), Escherichia coli and Salmonella: cellular and molecular biology, 2nd ed., vol. 2. ASM Press, Washington, D.C. 5. Castanie-Cornet, M.-P., T. A. Penfound, D. Smith, J. F. Elliott, and J. W. Foster. 1999. Control of acid resistance in Escherichia coli. J. Bacteriol. 181: 3525–3535. 6. Chuang, S.-E., D. L. Daniels, and F. R. Blattner. 1993. Global regulation of gene expression in Escherichia coli J. Bacteriol. 175:2026–2036. 7. Cronan, J. E., Jr., and D. Laporte. 1996. Tricarboxylic acid cycle and glyoxlate bypass, p. 206–216. In F. C. Neidhardt, R. Curtiss III, J. L. Ingraham, E. C. C. Lin, K. B. Low, B. Magasanik, W. S. Reznikoff, M. Riley, M. Schaechter, and H. E. Umbarger (ed.), Escherichia coli and Salmonella: cellular and molecular biology, 2nd ed., vol. 1. ASM Press, Washington, D.C. 8. DeRisi, J. L., V. R. Iyer, and P. O. Brown. 1997. Exploring the metabolic and genetic control of gene expression on a genomic scale Science 278:680–686. 9. Green, J. M., B. P. Nichols, and R. G. Matthews. 1996. Folate biosynthesis, reduction, and polyglutamylation, p. 665–673. In F. C. Neidhardt, R. Curtiss III, J. L. Ingraham, E. C. C. Lin, K. B. Low, B. Magasanik, W. S. Reznikoff, M. Riley, M. Schaechter, and H. E. Umbarger (ed.), Escherichia coli and Salmonella: cellular and molecular biology, 2nd ed., vol. 1. ASM Press, Washington, D.C. 10. Greene, R. C. 1996. Biosynthesis of methionine, p. 542–560. In F. C. Neidhardt, R. Curtiss III, J. L. Ingraham, E. C. C. Lin, K. B. Low, B. Magasanik, W. S. Reznikoff, M. Riley, M. Schaechter, and H. E. Umbarger (ed.), Escherichia coli and Salmonella: cellular and molecular biology, 2nd ed., vol. 1. ASM Press, Washington, D.C. 11. Henge-Aronis, R. 2000. The general stress response in Escherichia coli, p. 161–178. In G. Storz, and R. Henge-Aronis (ed.), Bacterial stress responses. ASM Press, Washington, D.C. 12. Henge-Aronis, R. 1996. Regulation of gene expression during entry into stationary phase, p. 1497–1512. In F. C. Neidhardt, R. Curtiss III, J. L. Ingraham, E. C. C. Lin, K. B. Low, B. Magasanik, W. S. Reznikoff, M. Riley, M. Schaechter, and H. E. Umbarger (ed.), Escherichia coli and Salmonella: cellular and molecular biology, 2nd ed., vol. 1. ASM Press, Washington, D.C. 13. Jensen, K. F. 1993. The Escherichia coli K-12 “wild types” W3110 and MG1655 have an rph frameshift mutation that leads to pyrimidine starvation due to low pyrE expression levels J. Bacteriol. 175:3401–3407. 14. Jia, M. H., R. A. LaRossa, J.-M. Lee, A. Rafalski, E. DeRose, G. Gonye, and Z. Xue. 2000. Global expression profiling of yeast treated with an inhibitor of amino acid blosynthesis, sulfometuron methyl. Physiol. Genomics 3:83–92. 15. Keener, J., and M. Nomura. 1996. Regulation of ribosome synthesis, p. 1417–1431. In F. C. Neidhardt, R. Curtiss III, J. L. Ingraham, E. C. C. Lin, K. B. Low, B. Magasanik, W. S. Reznikoff, M. Riley, M. Schaechter, and H. E. Umbarger (ed.), Escherichia coli and Salmonella: cellular and molecular biology, vol. 1. ASM Press, Washington, D.C. 16. Kenyon, C. J., and G. C. Walker. 1980. DNA damaging agents stimulate gene expression at specific loci in Escherichia coli. Proc. Natl. Acad. Sci. USA 77: 2819–2823. 17. Kredich, N. M. 1996. Blosynthesis of cysteine, p. 514–527. In F. C. Neidhardt, R. Curtiss III, J. L. Ingraham, E. C. C. Lin, K. B. Low, B. Magasanik, W. S. Reznikoff, M. Riley, M. Schaechter, and H. E. Umbarger (ed.), Escherichia coli and Salmonella: cellular and molecular biology, 2nd ed., vol. 1. ASM Press, Washington, D.C. 18. Kushner, S. R. 1996. mRNA decay, p. 849–860. In F. C. Neidhardt, R. Curtiss III, J. L. Ingraham, E. C. C. Lin, K. B. Low, B. Magasanik, W. S. Reznikoff, M. Riley, M. Schaechter, and H. E. Umbarger (ed.), Escherichia coli and Salmonella: cellular and molecular biology, 2nd ed., vol. 1. ASM Press, Washington, D.C. 19. Landick, R., C. L. Turnbough, Jr., and C. Yanofsky. 1996. Transcription attenuation, p. 1263–1286. In F. C. Neidhardt, R. Curtiss III, J. L. Ingraham, E. C. C. Lin, K. B. Low, B. Magasanik, W. S. Reznikoff, M. Riley, M. Schaechter, and H. E. Umbarger (ed.), Escherichia coli and Salmonella:
cellular and molecular biology, 2nd ed., vol. 1. ASM Press, Washington, D.C. 20. LaRossa, R. A., and T. K. Van Dyk. 2000. Applications of stress responses for environmental monitoring and molecular toxicology, p. 453–468. In G. Storz and R. Hengge-Aronis (ed.), Bacterial stress responses. ASM Press, Washington, D.C. 21. Lowry, O. H., J. Carter, J. B. Ward, and L. Glaser. 1971. The effect of carbon and nitrogen sources on the levels of metabolic intermediates of Escherichia coli J. Biol. Chem. 246:6511–6521. 22. Mayhew, M., and F.-U. Hartl. 1996. Molecular chaperone proteins, p. 922– 937. In F. C. Neidhardt, R. Curtiss III, J. L. Ingraham, E. C. C. Lin, K. B. Low, B. Magasanik, W. S. Reznikoff, M. Riley, M. Schaechter, and H. E. Umbarger (ed.), Escherichia coli and Salmonella: cellular and molecular biology, 2nd ed., vol. 1. ASM Press, Washington, D.C. 23. Miller, J. H. 1972. Experiments in molecular genetics. Cold Spring Harbor Laboratory Press, Cold Spring Harbor, N.Y. 24. Neidhardt, F. C., J. L. Ingraham, and M. Schaechter. 1990. Physiology of the bacterial cell: a molecular approach. Sinauer Associates, Inc., Sunderland, Mass. 25. Neidhardt, F. C., and M. A. Savageau. 1996. Regulation beyond the operon, p. 1310–1324. In F. C. Neidhardt, R. Curtiss III, J. L. Ingraham, E. C. C. Lin, K. B. Low, B. Magasanik, W. S. Reznikoff, M. Riley, M. Schaechter, and H. E. Umbarger (ed.), Escherichia coli and Salmonella: cellular and molecular biology, 2nd ed., vol. 1. ASM Press, Washington, D.C. 26. O’Farrell, P. H. 1975. High-resolution two-dimensional electrophoresis of proteins J. Biol. Chem. 250:4007–4021. 27. Petersen, J. G., and S. Holmberg. 1986. The ILV5 gene of Saccharomyces cerevisiae is highly expressed. Nucleic Acids Res. 14:9631–9651. 28. Pittard, A. J. 1996. Biosynthesis of the aromatic amino acids, p. 458–484. In F. C. Neidhardt, R. Curtiss III, J. L. Ingraham, E. C. C. Lin, K. B. Low, B. Magasanik, W. S. Reznikoff, M. Riley, M. Schaechter, and H. E. Umbarger (ed.), Escherichia coli and Salmonella: cellular and molecular, biology, 2nd ed., vol. 1. ASM Press, Washington, D.C. 29. Potsma, P. W., J. W. Lengeler, and G. R. Jacobson. 1996. Phosphoenolpyruvate: carbohydrate phosphotransferase systems, p. 1149–1174. In F. C. Neidhardt, R. Curtiss III, J. L. Ingraham, E. C. C. Lin, K. B. Low, B. Magasanik, W. S. Reznikoff, M. Riley, M. Schaechter, and H. E. Umbarger (ed.), Escherichia coli and Salmonella: cellular and molecular biology, 2nd ed., vol. 1. ASM Press, Washington, D.C. 30. Reznikoff, W. S., and J. F. Abeison. 1978. The lac promoter, p. 221–243. In J. H. Miller, and W. S. Reznikoff (ed.), The operon. Cold Spring Harbor Laboratory, Cold Spring Harbor, N.Y. 31. Richmond, C. S., J. D. Glaser, R. Mau, H. Jin, and F. R. Blattner. 1999. Genome-wide expression profiling in Escherichia coli K-12. Nucleic Acids Res. 27:3821–3835. 32. Riley, M., and B. Labedan. 1996. Escherichia coli gene products: physiological functions and common ancestories, p. 2118–2202. In F. C. Neidhardt, R. Curtiss III, J. L. Ingraham, E. C. C. Lin, K. B. Low, B. Magasanik, W. S. Reznikoff, M. Riley, M. Schaechter, and H. E. Umbarger (ed.), Escherichia coli and Salmonella: cellular and molecular biology, 2nd ed., vol. 2. ASM Press, Washington, D.C. 33. Roberts, R. B., D. B. Cowie, P. H. Abelson, E. T. Bolton, and R. J. Britten. 1963. Studies of biosynthesis in Escherichia coli, publication 607. The Kirby Lithographic Company, Washington, D.C. 34. Tao, H., C. Bausch, C. Richmond, F. R. Blattner, and T. Conway. 1999. Functional genomics: expression analysis of Escherichia coli growing on minimal and rich media J. Bacteriol. 181:6425–6440. 35. Umbarger, H. E. 1996. Biosynthesis of the branched-chain amino acids, p. 442–457. In F. C. Neidhardt, R. Curtiss III, J. L. Ingraham, E. C. C. Lin, K. B. Low, B. Magasanik, W. S. Reznikoff, M. Riley, M. Schaechter, and H. E. Umbarger (ed.), Escherichia coli and Salmonella: cellular and molecular biology, 2nd ed., vol. 1. ASM Press, Washington, D.C. 36. VanBogelen, R. A., K. Z. Abshire, A. Pertsemlidis, R. L. Clark, and F. C. Neidhardt. 1996. Gene-protein database of Escherichia coli K-12, edition 6, p. 2067–2117. In F. C. Neidhardt, R. Curtiss III, J. L. Ingraham, E. C. C. Lin, K. B. Low, B. Magasanik, W. S. Reznikoff, M. Riley, M. Schaechter, and H. E. Umbarger (ed.), Escherichia coli and Salmonella: cellular and molecular biology, 2nd ed., vol. 2. ASM Press, Washington, D.C. 37. VanBogelen, R. A., P. M. Kelley, and F. C. Neidhardt. 1987. Differential Induction of heat shock, SOS, and oxidation stress regulons and accumulation of nucleotides in Escherichia coli. J. Bacteriol. 169:26–32. 38. Van Dyk, T. K., and R. A. Rosson. 1998. Photorhabdus luminescens luxCD ABE promoter probe vectors. Methods Mol. Biol. 102:85–95. 39. Wittenbach, V. A., D. R. Rayner, and J. M. Schloss. 1992. Pressure points in the biosynthetic pathway for branched-chain amino acids, p. 69–88. In B. K. Singh, H. E. Flores, and J. C. Shannon (ed.), Biosynthesis and molecular regulation of amino acids in plants. American Society of Plant Physiologists, Rockville, Md. 40. Wodicka, L., H. Dong, M. Mitman, M. H. Ho, and D. J. Lockhart. 1997. Genome-wide expression monitoring in Saccharomyces cerevisiae. Nat. Biotechnol. 15:1359–1367.