LA-UR-04-7688, AIAA Journal, 43(11), 2431-2437, 2005
High-Frequency Response Functions for Composite Plate Monitoring with Ultrasonic Validation Gyuhae Park, Amanda C. Rutherford, Jeannette R. Wait, Brett Nadler, Charles R. Farrar*, Thomas N. Claytor Engineering Sciences & Applications Los Alamos National Laboratory Los Alamos, NM 87545
ABSTRACT In this study, frequency response functions (FRF) measured by piezoelectric Macro-Fiber Composite (MFC) actuators/sensors are used to detect subsurface delamination in a composite plate. The plate is impacted to seed damage in the form of ply delamination. Then, the MFCbased active-sensing system exerts an excitation into the plate, and measures the subsequent responses. Traditional piezoceramic materials are also mounted in comparable locations on the plate to compare their performances. FRF and damage indicator features are derived from the measured signals and used to assess the condition of the plate. Validation of the delamination is completed using an ultrasonic C-scan method. The effective area of observed damage is well correlated to the damage indicator feature.
*
Author to whom correspondence should be addressed. Email:
[email protected]
1
LA-UR-04-7688, AIAA Journal, 43(11), 2431-2437, 2005 NOMENCLATURE ρ
Correlation coefficient
Zi,1
Baseline FRF data at frequency i
Zi,2
Compared FRF data at frequency i
x
Original signal
x
Standardized signal
µ
Mean of signal
σ
Standard deviations
1. INTRODUCTION The use of composite materials for structural systems has increased because of their lightweight and high strength. However, the use of composites leads to various types of failure modes, including delamination, fiber breakage, matrix cracking, and fiber-matrix debonding. Delamination appears to be the most frequent failure mode, usually caused by imperfect fabrications, cracks in matrix materials, impacts by foreign objects, or other hazardous service environments 1 . The delamination substantially reduces the stiffness and the buckling load capacity, which, in turn, influences the structure’s stability characteristics.
In order to ensure safe and reliable operation, a large amount of research efforts have focused on the development of cost-effective structural health monitoring (SHM) systems for composite structures. These SHM systems can be generally classified into two categories; low-frequency global vibration-based methods and high-frequency local response methods such as Lamb wave propagation.
The global mode here refers to the first few modes that typically used in
experimental modal analysis, while the local mode indicates the vibration resonances of local area of a structure, which are insensitive to the boundary or operational conditions of the entire
2
LA-UR-04-7688, AIAA Journal, 43(11), 2431-2437, 2005 structure and beyond the frequency range that typical experimental modal analysis techniques could be applied. Although numerous methods have been proposed to detect damage using lowfrequency vibration data, its actual application poses many technical challenges. The most fundamental challenge is the fact that damage is typically a local phenomenon and may not significantly influence the lower-frequency global response of a structure that is normally measured during vibration tests. Another fundamental challenge is the effect of environmental and operational condition changes that leads to significant modifications on the measured dynamic responses and may produce similar changes as those caused by structural damage. Zou et al.1 summarized the model-dependent vibration-based methods for identification of delamination of composite structures and their aforementioned practical limitations. Kessler et al. 2 investigated the potential role of frequency response functions (FRF) of a composite structure for SHM. A 2-d finite element (FE) model was built for comparison to experimental data, and changes in resonant frequencies and mode shapes are used to detect and locate the delaminated region in conjunction with FE data. Amraoui and Lieven3 used the deviation of the root mean square of the FRF measured by a Laser Doppler Vibrometer, coupled with neural networks, for delamination identification in composite structures. Because these low-frequency methods lack of the required sensitivity, the authors proposed the use of distributed piezoactuators in order to improve the sensitivity to minor defects in composite plates.
The high-frequency response methods, in particular Lamb wave propagations, are widely used for monitoring of composite plates4,5,6,7. Lamb waves are mechanical waves corresponding to vibration modes of plates with a thickness on the same order of magnitude as the wavelength. The changes in wave attenuation, reflection, or time-of-flight are typically used to detect and
3
LA-UR-04-7688, AIAA Journal, 43(11), 2431-2437, 2005 locate damage with various signal processing techniques. The advances in sensor and hardware technologies for efficient generation and detection of Lamb waves and the need to detect subsurface damage in laminate composite structures, particularly those used in aircraft industries, has led to a significant increase in the studies that use Lamb waves for detecting defects in composite structures. However, it is a well-known fact that Lamb waves in composite plates travel relatively short distances compared to metallic counterparts because of high damping present within the material.
In order to obtain an acceptable signal to noise ratio, one often
needs to employ significantly increased numbers of sensors and actuators for composite plate monitoring. In addition, data retrieval and management may not be trivial, and a large data storage capacity is required to process and compare the measured data. The large number of sensors/actuators may also lead to frequent sensors/actuators failures, which produce falseindications regarding the structural health and negates the effectiveness of the techniques.
This paper describes the model-independent damage assessment of composite plates by monitoring the changes in FRF measured by piezoelectric active-sensing systems. It is a well known fact that the FRF represents a unique dynamic characteristic of a structure. From the standpoint of structural monitoring, the damage will alter the stiffness, mass, or energy dissipation properties of a system, which, in turn, results in the changes in the FRF of the system. Contrary to most vibration-based methods, which lie in the low-frequency modal-analysis domain, the FRFs examined in this study are measured at relatively high-frequency ranges, up to 20 kHz, to improve the sensitivity to minor defects in a composite structure. The goal of this study is to assess the condition of a composite plate with minimum instrumentation and signal processing, compared to other SHM techniques. The use of FRF to detect and locate damage,
4
LA-UR-04-7688, AIAA Journal, 43(11), 2431-2437, 2005 especially at higher frequency ranges, is an unique approach primarily because it provides required sensitivities and repeatability, and allows judicious selection of frequency ranges for a given structure.
In this study, multiple reference signals are first recorded before the composite plate is damaged. The composite plate is then impacted to seed damage in the form of fiber cracks and ply delamination. The active sensing system exerts an excitation into the plate, and measures the subsequent response to obtain the FRF of the structure. A damage indicator feature is derived from the measured FRF to assess the state of the structure. The performance of the method is validated with ultrasonic scans, in which the extent of delamination is well correlated to the damage indicator feature. This study also addresses data normalization issues to account for environmental variability, and sensor robustness issues by comparing the performance of traditional piezoceramic materials and recently developed Macro-Fiber Composite (MFC) actuators 8 . The theory behind this technique and experimental results are presented in the following sections.
2. TEST STRUCTURE: COMPOSITE PLATE The test structure is shown in Figure 1. The dimension of the quasi-isotropic composite plate is 609 x 609 x 6.35 mm, whose lay-up contains 48 plies stacked according to the sequence [6(0/45/-45/90)]s using 60% Toray T300 graphite fibers in a 934 Epoxy matrix. Two pairs of piezoceramic and MFC patches are mounted on one surface of the plate as shown in Figure 1. In this study, one piezoelectric (PZT) material or MFC is designated as an actuator, exerting a random input into the structure, and the remaining patches are used to measure the responses.
5
LA-UR-04-7688, AIAA Journal, 43(11), 2431-2437, 2005 The sizes of the PZT and MFC are 25.4 x 25.4 x 0.254 mm and 25.4 x 12.7 x 0.254 mm, respectively, and they are small enough not to be intrusive. Piezoelectric materials are very useful in structural health monitoring because they can perform both duties of sensing and actuation within a structure. The electro-mechanically coupling property of PZT allows one to design and deploy an “active” and “local” sensing system whereby the structure in question is locally excited by a known input, and the corresponding responses are measured by the same excitation source.
The employment of a known input also facilitates subsequent signal
processing of the measured output data.
MFC1
PZT1
MFC2
Figure 1: The composite plate used for the test.
6
LA-UR-04-7688, AIAA Journal, 43(11), 2431-2437, 2005
Figure 2: Macro-Fiber Composite Actuator. The use of PZT materials for structural actuation and sensing is a fairly well developed area. The PZT, however, imposes certain restrictions for its practical use in real-world applications. For instance, the extremely brittle nature of the PZT material requires extra attention during the handling and bonding procedures.
In addition, the conformability to curved surfaces is
extremely poor requiring extra treatment of the surfaces.
Macro-fiber composite actuators are
developed at NASA Langely center to overcome these limitations. The MFC is a layered, planar actuation device that employs rectangular cross-section, unidirectional piezoceramic fibers (PZT 5A) embedded in a thermosetting polymer matrix. This active, fiber reinforced layer is then sandwiched between copper-clad Kapton film layers that have an etched interdigitated electrode pattern. An overview of these actuators can be found in the reference8,9. The MFC actuators provide not only the required durability and flexibility, but also higher electro-mechanical coupling by capitalizing on the stronger longitudinal d33 constants by using interdigitated electrodes. A typical MFC actuator is shown in Figure 2.
A total of 14 baseline measurements with the PZTs and MFCs were recorded to capture environmental variability before damage was introduced. The baselines were measured under
7
LA-UR-04-7688, AIAA Journal, 43(11), 2431-2437, 2005 different ambient and temperature conditions over a three week period. For this study, time histories were sampled at a rate of 51.2 kHz, producing 32,768 time points using a commercial dynamic signal analyzer. An amplified random signal (1 V) at the same sampling frequency (51.2 kHz) was used as the voltage input for the testing.
Figure 3: Experimental Setup of the composite plate
Damage is then introduced into the plate by firing a small projectile out of a gas gun. A gas gun is used to propel a 192.3g steel projectile with a spherical nose at the composite plate.
Five
shots aimed at different locations and at varied velocities (31.09 m/s, 39.93 m/s, 36.88 m/s, 35.66 m/s, 32.92 m/s) created different damage scenarios. Two laser probes were installed inside the barrel of the gas gun to measure the velocities of the projectile. Before the first impact test, two cables were attached to two sides of the plate so that that plate could hang from the test frame in a nearly free-free condition. The overall test setup is shown in Figure 3.
8
LA-UR-04-7688, AIAA Journal, 43(11), 2431-2437, 2005
266.7 mm
152.4 mm MFC1 MFC
Impact I4, 117 4, ft/s35.66 m/s
1” I2, 131m/s ft/s Impact 2, 39.93
MFC2 MFC Impact 31.09 m/s I1, 1021,ft/s
I5, 108 5, ft/s32.92 m/s PZT1 Impact 152.4 mm 6”
152.4 mm 6” Impact I3, 121 3, 36.88 ft/s m/s
PZT2 152.4 mm
266.7 mm
Figure 4: Locations of MFC/PZT and the impact
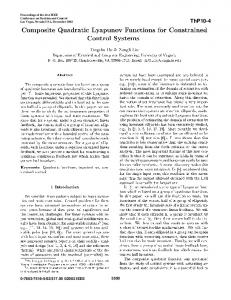
The impact locations are shown in relation to the MFC and PZT sensors in Figure 4. No physically visible damage was identified during the tests except for Impact 2. Impact 2, with the highest velocity, caused visible damage to the plate, shown in Figure 5. Time-domain data were measured after each impact.
9
LA-UR-04-7688, AIAA Journal, 43(11), 2431-2437, 2005
Figure 5: Damage introduced by Impact 2
3. DATA PROCESSING AND DAMAGE INDICATOR FEATURES For SHM strategies that rely on vibration response measurements, the ability to normalize the measured data with respect to varying operational and environmental conditions is essential if one is to avoid false-positive indication of damage.
This insensitivity to environmental
conditions is accomplished through the following standard data normalization procedure;
x=
x- µ σ
(1)
where x is the standardized signal, µ and σ are the mean and standard deviation of the original signal, x , respectively. This process was previously used10 in time-series data analysis for SHM so that the damage detection algorithm could distinguish between structural damage and 10
LA-UR-04-7688, AIAA Journal, 43(11), 2431-2437, 2005 operational variability. This process eliminates the DC bias in time-series data and normalizes the variations associated with the differences in excitation levels, which can be caused by changes in the PZT capacitance and in the damping of a host structure with respect to temperature variations. This procedure is performed because one cannot directly measure the magnitude of the excitation induced by PZT patches. This normalization procedure was applied to all signals measured in this study. It should be noted that this data normalization process may not be a universal process, and the procedure would not work on the data where the environmental condition affects the absolute signal-to-noise ratio or creates new local modes. This procedure is mainly used so that the amplitude of the sensing response from varying levels of PZT excitations can be normalized, which can be possibly caused by the environmental condition changes.
Each input and output time history is split up into 29 separate 4096-point blocks, with 75% overlap. A Fast Fourier Transform is then performed on all data blocks in order to transfer the time history information into the frequency domain for the FRF estimate. Here, the FRF is defined as the ratio of the output and input voltage (cross-spectrum / auto-spectrum, commonly referred to as the H1 estimate) for the MFC sensor and actuator. Only the responses in the frequency range of 5-20 kHz are analyzed for damage assessment in order to minimize the effect of boundary condition changes, which usually occurs in lower frequency ranges.
In structural health monitoring, the process of feature extraction is required for the selection of key information from the measured data that distinguishes between a damaged and an undamaged structure. The extractions also accomplish the condensation of the large amount of
11
LA-UR-04-7688, AIAA Journal, 43(11), 2431-2437, 2005 available data into a much smaller data set that provides concise damage indication. In this study, a scalar damage metric, referred to as the Cross-Correlation Coefficient metric, is used to interpret and quantify information from different FRF data sets. The correlation coefficient determines the linear relationship between the two data sets, n
1 ρ= n −1
∑ (Re( Z i =1
i ,1
) − Re( Z 1 ))(Re( Z i , 2 ) − Re( Z 2 ))
σZσZ 1
(2)
2
where ρ is the correlation coefficient, Zi,1 is the baseline FRF data and Zi,2 is the compared FRF data at frequency i, Z1 and Z 2 are the means of the signals and the σ terms are the standard deviations.
For convenience, the feature examined in this study is the maximum value of the
Cross-correlation coefficient.
This procedure is done in order to reduce the effect of the
horizontal shift of the frequency spectrum usually caused by temperature changes. In addition, the feature examined in this case is typically (1 - ρmax), in order to ensure that, with increasing damage or change in structural integrity, the metric values also increase. Therefore, a damage metric value of zero, when compared to a baseline measurement, corresponds to perfect correlation. Perfect correlation between a given measurement and a baseline measurement, in turn, means that there is no damage present for that given measurement. A greater damage metric value means that a certain degree of dissimilarity, with respect to a baseline measurement, is present in a particular measurement. The goal here is to show that this dissimilarity is directly related to the amount of damage present. It should be once again noted that the cross-correlation metric accounts for vertical and horizontal shifts of data sets, which are usually associated with temperature changes.
12
LA-UR-04-7688, AIAA Journal, 43(11), 2431-2437, 2005 4. EXPERIMENTAL RESULTS 4.1 Sensor Ruggedness Structural health monitoring sensors/actuators must be rugged to withstand operational environments. Traditional PZT wafers used for active SHM methods are, however, brittle and they are especially vulnerable under impact loadings. After Impact 2, it has been identified that the bonding condition between both PZT and the plate significantly degraded. After Impact 5, it has been visually observed that PZT 1 was broken, as shown in Figure 6. It is important to point out that, even with the degraded bonding condition and until the final visual breakage, the piezoelectric patches were still able to produce sufficient sensing and actuation signals, potentially leading to the false-indication of the structural condition. This type of sensor failure would be especially problematic for most wave propagation approaches because these methods usually require a large number of sensors/actuators for composite plate monitoring.
Figure 6: The failure of PZT 1 after Impact 5
On the other hand, MFC sensors provide a superior capability compared to the PZT. Neither of the two MFC sensor’s integrity was compromised with the induced impacts. This flexible sensor
13
LA-UR-04-7688, AIAA Journal, 43(11), 2431-2437, 2005 certainly provides the advantage of being robust and reliable compared to other available SHM sensors. Based on this observation, only the signals measured from MFC are analyzed to assess the condition of the plate.
In addition, the results point out the importance of an automatic
sensor self-diagnostic procedure in SHM, where the sensors verify their own functionality during operation. The procedure for monitoring the bonding integrity between piezoelectric sensors and the host structure, as well as sensor breakage, was investigated and is a subject of another paper11. 4.2 Frequency Response data Frequency baseline responses obtained by MFC 1 (sensor) and MFC 2 (actuator) are shown in Figure 7 in the frequency range of 5-20 kHz after following the data normalization procedure using Equation (1). The coherence plot, which indicates the correlation between the input and the output, is also shown in Figure 8 to indicate the quality of test measurements is excellent except the anti-resonance regions. For comparison purposes, the frequency responses without using the normalization procedure are also shown in Figure 9. As illustrated, the normalization procedure dramatically reduces the fluctuation of the FRF signatures caused by temperature changes. The temperature variations during the three week test period are estimated to be in the range of ± 7 oC. It is believed that the temperature variation in composite structures are more significant compared to metallic structures because of thermal expansion coefficient mismatch between the matrix and the fiber and different dependency of each elastic modulus on temperature. The purpose of the baseline measurements was to provide a means of comparison between the undamaged and the damaged conditions of the plate. In an effort to capture potential differences caused by environmental and operational condition changes, the baseline measurements were taken at various times over the course of three weeks, and several other
14
LA-UR-04-7688, AIAA Journal, 43(11), 2431-2437, 2005 boundary condition changes are also manually imposed including horizontal and vertical positioning of the plate, suspending the plate with cables to simulate a nearly free-free condition, or resting the plate on soft forms or hard blocks. As illustrated in Figure 7, which exhibits the FRFs with varying conditions without labels, these boundary condition changes introduce almost no impact on the measurements made higher than 5 kHz.
3
Transfer Function (V/V)
2.5
2
1.5
1
0.5
0 0.5
1
1.5 Frequency (Hz)
2 x 10
4
Figure 7: 14 baseline FRF measurements (MFC 1: Sensor, MFC 2: Actuator) after the data normalization procedure
Coherence function
1
0.8
0.6
0.4
0.2
0 0.5
1
1.5 Frequency (Hz)
2 x 10
4
Figure 8: The coherence function of the 14 baseline measurements 15
LA-UR-04-7688, AIAA Journal, 43(11), 2431-2437, 2005
0.14
Transfer Function (V/V)
0.12
0.1
0.08
0.06
0.04
0.02
0 0.5
1
1.5 Frequency (Hz)
2 x 10
4
Figure 9: 14 baseline FRF measurements without the data normalization procedure
The concept of using FRF for structural damage identification is not entirely new. Several investigations have been already made to utilize the measured FRF for detecting damage in structures12,13,14. In addition, the piezoelectric impedance-based method15 is also in line with those based on FRF, because it indirectly measures the mechanical impedance of a structure over selected frequency ranges. However, none of the studies have addressed the data normalization issues as presented in this study. The effect of temperature on an FRF measured at high frequency ranges is an important problem and has been pointed out in Dune et al. (2001)14. Therefore, the normalization procedure, as performed in this study, should be implemented in order to minimize the variability associated with operational and environmental condition changes.
16
LA-UR-04-7688, AIAA Journal, 43(11), 2431-2437, 2005
3
Transfer Function (V/V)
2.5
2 Impact I
Baselines 1.5
1
0.5
0 0.5
1
1.5 Frequency (Hz)
2 x 10
4
x 10
4
Figure 10: Baselines and after Impact 1 (dotted line) 3
2.5 Transfer Function (V/V)
Baselines 2 Impact 2 1.5
1
0.5
0 0.5
1
1.5 Frequency (Hz)
2
Figure 11: Baselines and after Impact 2 (dotted line)
17
LA-UR-04-7688, AIAA Journal, 43(11), 2431-2437, 2005
2.5
Transfer Function (V/V)
2
Impact 4
Impact 3
1.5
1
0.5
0 0.5
1
1.5
2
Frequency (Hz)
x 10
4
Figure 12: Responses after Impact 3 and Impact 4 (dotted line) 3
Tranfer Function (V/V)
2.5
2
Impact 4 Impact 5
1.5
1
0.5
0 0.5
1
1.5 Frequency (Hz)
2 x 10
4
Figure 13: Responses after Impact 4 and Impact 5 (dotted line)
18
LA-UR-04-7688, AIAA Journal, 43(11), 2431-2437, 2005 For the normalized FRF, the measurements are quite repeatable. The essential pattern of the FRF signatures remains the same over the 3 week test period when damage was not induced. The normalization procedure is, therefore, applied to the subsequent measurements taken after the impacts. When Impact 1 (31.09 m/s) is introduced, no or minor changes in the response were observed, shown in Figure 10, indicating that no (or very small, if any) damage is introduced by Impact 1. Impact 2 (39.93 m/s) produces considerable changes in frequency response functions as shown in Figure 11. This change could be considered an indicator of the severity of damage induced by the impact. This impact also causes visual damage to the plate, as shown in Figure 5. All the remaining impact shows the noticeable changes in FRF signature. Figure 12 and Figure 13 illustrate the response after Impact 3 and 4 and after Impact 4 and 5, respectively. Once again, it is easy to see that the signals are qualitatively different before and after the corresponding impact, which indicates the presence of damage in the plate.
4.3 Damage Indicator Feature Feature extraction algorithms are employed to qualitatively assess how different the signals are from each other test to test. The feature examined in this study is the correlation coefficient, as described in the previous section. Because impacting the plate is a cumulative damage process, the correlation coefficient is calculated between each impact and the preceding condition. For example, the correlation coefficient is calculated between Impact 1 measurements and the mean of the first five baselines. Then, it is calculated between Impact 2 measurements and the mean of Impact 1 measurements. This procedure implies that the correlation coefficient is a measure of how the system changes between one damage state and the next. These results are summarized in Table 1.
19
LA-UR-04-7688, AIAA Journal, 43(11), 2431-2437, 2005
Table 1. Cross correlation damage metric Baseline Speed (m/s) Baseline Impact 1 Impact 2
0-0.0353
Impact 1
Impact 2
Impact 3
Impact 4
Impact 5
31.09
39.93
36.88
35.66
32.92
0.02180.0465
0.66740.6974 0.64850.6712 0.35950.3717
Impact 3 Impact 4
0.35520.3973 0.22390.2287
In Table 1, the largest variation of damage metric in the baselines is identified to be 0.0353. Therefore, any value higher than that is taken to represent changes in the structural condition or the presence of damage. After Impact 1, the maximum value for the damage metric is 0.0465. Although it is higher than the established threshold value, it is considered as a “suspicious” condition rather than definite “damaged” condition because of its minor increase. It is confirmed by the ultrasonic scan (described later) that Impact 1 did not produce any delamination in the plate.
Rather, it is believed that Impact 1 causes fiber-split, or fiber-breakage, and these
damaged conditions could not be identified through the ultrasonic scans. Impact 2 stands out as having the highest damage metric relative to other conditions.
Impact 2 was the highest
projectile velocity and caused the most visible damage to the plate. All other impacts cause relatively large increases in the damage metric, which indicates that the impact introduced invisible damage into the plate. The results in Table 1 also show that Impact 4 causes more significant changes in the plate compared to Impact 3, even though it has a lower impact velocity.
20
LA-UR-04-7688, AIAA Journal, 43(11), 2431-2437, 2005
It should be noted that the analysis performed in this study does not consider the distribution of the damage sensitive feature (correlation coefficients) in a statistical context. The main reason was that, with the induced damage, the feature shows the changes in the range of 650 - 1500% compared to the baselines, as summarized in Table 1, and without a statistical analysis, one can clearly infer that they are outliers from the baseline feature distribution. However, if one wants to estimate the extent of damage or the sensitivity of the proposed method, the statistical distribution of the damage sensitive feature need to be characterized, and a method based on the statistical rigorous algorithms should be employed.
5. ULTRASONIC VALIDATION Because no visual damage was identified except for Impact 2, the pulse-echo ultrasonic method is used to detect and quantify the damage to validate the method presented in the previous sections. For these tests, a rectangular plastic dam was fabricated and secured to the backside of the plate as shown in Figure 14. The reservoir formed by the composite plate and dam was filled with 40.5 mm of water. Automated ultrasonic scanning was then performed.
A 5 MHz
transducer with a diameter of 12.7 mm and a focus of 38 mm was used to scan the plate.
To produce the ultrasonic image of the plate, the amplitude of the backwall signal was measured at every 0.5 mm, as the transducer traveled across one quadrant of the plate. Because of the scanning system limitations, the entire plate could not be scanned at once. Therefore, four quadrants are scanned individually and then the images are pasted together. Variation of the
21
LA-UR-04-7688, AIAA Journal, 43(11), 2431-2437, 2005 amplitude of the backwall signal is indicative of the attenuation/scattering in the material. If delamination is present, the backwall signal would be completely lost.
Plastic Dam
Figure 14: Ultrasonic Test setup
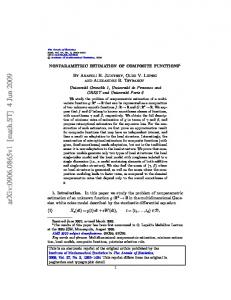
The ultrasonic view of the plate is shown in Figure 15. The white areas represent full amplitude backwall responses. Increasingly dark regions show delamination between different plys, with the darkest areas near the surface of the impact zone. As shown in the Figure, Impact 1 does not introduce any delamination to the plate, as confirmed by the previous analysis. It is speculated that Impact 1 produces minor fiber breakage, and results in minor changes in frequency responses. The other four impacts produce relatively large areas of delamination, which are all detected by the active-sensing FRF based methods.
22
LA-UR-04-7688, AIAA Journal, 43(11), 2431-2437, 2005
Figure 15: Ultrasonic view of the plate with induced delamination
Table 2 summarizes the impact velocities versus both delamination areas and corresponding damage metric values. The effective area of observed damage is well correlated to the damage indicator features. The question of the differences in damage metric values between Impact 3 and 4 (Impact 4 has the lower velocity but higher damage metric value in the FRF analysis) is also answered by the ultrasonic testing. Impact 4 obviously produced larger delamination area than Impact 3, which supports the previous FRF analysis.
23
LA-UR-04-7688, AIAA Journal, 43(11), 2431-2437, 2005 Table 2: Summary of frequency response and ultrasonic testing results
31.09
Delamination area (mm2) 0.00
Maximum damage metric 0.0465
Impact 2
39.93
9813
0.6712
Impact 3
36.88
7361
0.3717
Impact 4
35.66
8935
0.3973
Impact 5
32.92
5032
0.2287
Tests
Impact Speed (m/s)
Impact 1
When reviewing the results, the sensing ranges of the MFC patches can be considered to extend to the outer-most boundaries of the plate because there is no clear relationship found between the impact locations and MFC. In order to pin-point the damage location, the frequency range must be kept much higher, or increased numbers of sensors/actuators would be required.
The ultrasonic testing confirms the effectiveness of the high frequency FRF based SHM method based on active sensing systems.
With a minimum instrumentation and signal processing
technique, the condition of the structure can be qualitatively, yet somewhat quantitatively assessed. The damage indicator feature is well-correlated to the extent of delamination. In addition, by employing relatively higher frequency ranges, the method is sensitive to small defects in the structure, and at the same time, the effects of boundary and ambient condition changes can be completely eliminated. Another advantage of this method would be improved speed and assessment. The data acquisition and analysis of each impact test took less than one minute. Therefore, this method is capable of providing a real-time health monitoring system because the requirement on the hardware and signal processing is significantly relaxed compared to other SHM methods. Another important consideration when designing SHM systems is
24
LA-UR-04-7688, AIAA Journal, 43(11), 2431-2437, 2005 sensor ruggedness. In this study, MFC sensors proved their ruggedness compared to traditional PZT in the impact experiment, in which relatively harsh operational conditions are imposed.
6. CONCLUSION A composite plate subjected to varying states of damage was examined in this work. Damage was introduced to the plate by firing a small projectile out of a gas gun to introduce delamination. Frequency response functions were calculated from both PZTs and MFCs at high frequency ranges (5-20 kHz) and were used to assess the conditions of the plate. The MFCs proved their ruggedness versus PZT in the impact experiment, surviving all impacts while PZTs failed. In addition, the damage feature was able to identify all states of damage, with Impact 2 being the most severe case. Furthermore, the proposed method was validated by ultrasonic scanning methods, where the delaminated area is well correlated to the damage indicator feature.
ACKNOWLEDGEMENTS This research was funded through the Laboratory Directed Research and Development program, entitled “Damage Prognosis Solution,” at Los Alamos National Laboratory.
REFERENCES 1
Zou, Y., Tong, L., and Steven, G.P., “Vibration-based Model-Dependent Damage
(Delamination) Identification and Health Monitoring For Composite Structures – A Review,” Journal of sound and Vibration, Vol. 230, No. 2, 2000, pp. 357-378.
25
LA-UR-04-7688, AIAA Journal, 43(11), 2431-2437, 2005
2
Kessler, S.S., Spearing, S.M., Atalla, M.J., Cesnik, C.E., and Soutis, C., “Damage Detection in
Composite Materials using Frequency Response Methods,” Composites Part B: Engineering, V.33, No.1, 2002, pp. 87-95. 3
Amraoui, M.Y., and Lieven, N.A.J., “Laser Vibrometry based Detection of Delaminations in
Glass/Epoxy Composites,” ASME Journal of Vibration and Acoustics, Vol. 126, No. 3, 2004, pp. 430-437. 4
Sohn, H., Park, G., Wait, J.R., Limback, N.P., and Farrar, C.R., “Wavelet-based Signal
Processing for Detecting Delamination in Composite Plates,” Smart Materials and Structures, Vol. 13, No. 1, 2004, pp. 153-160. 5
Badcock R.A. and Birt, E.A., “The Use of 0-3 Piezocomposite Embedded Lamb Wave Sensors
for Detection of Damage in Advanced Fiber Composites,” Smart Materials and Structures, Vol. 9, No.2, pp. 291-297. 6
Ihn, J.B. and Chang, F.K., “Detection and monitoring of hidden fatigue crack growth using a
built-in piezoelectric sensor/actuator network: II. Validation using riveted joints and repair patches,” Smart Materials and Structures, Vol. 13, No. 3, 2004, pp. 621-30 7
Kessler, S.S., Spearing, S.M., and Soutis, C., “Damage Detection in Composite Materials using
Lamb Wave Methods,” Smart Materials and Structures, Vol.11, No.2, 2002, pp. 269-278 8
Wilkie, W.K., Bryant, R.G., High, J.W., Fox, R.L., Hellbaum, R.F., Jalink, A., Little, B.D.,
Mirick, P.H., “Low-cost piezocomposite actuator for structural control applications,” Proceedings of the 7th Society of Photo-Optical Instrumentation Engineers on Smart Structures and Materials, SPIE, Newport Beach, CA, March 5-9, 2000.
26
LA-UR-04-7688, AIAA Journal, 43(11), 2431-2437, 2005
9
Sodano, H.A., Park, G., and Inman, D.J., “An Investigation into the Performance of Macro-
Fiber composites for Sensing and Structural Vibration Applications,” Mechanical Systems and Signal Processing, Vol. 18, No. 3, 2004, pp. 683-697. 10
Sohn, H., and Farrar, C.R., “Damage Diagnosis using Time Series Analysis of Vibration
Signals,” Smart Materials and Structures, Vol. 10, No. 3, 2001, pp. 446-451. 11
Park, G., Farrar, C.R., Rutherford, C.A., Robertson, A.N., 2005, “Piezoelectric Active Sensor
Self-diagnostics using Electrical Admittance Measurements,” ASME Journal of Vibrations and Acoustics, submitted. 12
Diaz, S.H., and Soutis, C., “Delamination Detection in Composite Laminates from Variations
of Their Modal Characteristics,” Journal of Sound and Vibration, Vol. 228, No. 1, 1999, pp. 1-9. 13
Zhang, H., Schulz, M.J., Ferguson, F., Pai, P.F., “Structural Health Monitoring using
Transmittance Functions,” Mechanical Systems and Signal Processing, Vol. 13, No. 5, 1999, pp. 765-787 14
Dunne, J.P., Pitt, D.M., Kilian, K.J., and Sofge, D.A., “Recent Advances in Active Damage
Interrogation,” Proceedings of 42nd AIAA/ASME/ASCE/AHS/ASC Structures, Structural Dynamics, and Materials Conference and Exhibit, Seattle, WA, April 16-19, 2001, AIAA0125192. 15
Park G, Sohn H, Farrar C.R, Inman D.J., “Overview of piezoelectric impedance-based health
monitoring and path forward.” The Shock and Vibration Digest, Vol. 35, No. 6, 2003, pp. 451463
27