Abstractâ Classifying phishing websites can be expensive both computationally and financially given a large enough volume of suspect sites. A distributed ...
2015 IEEE World Congress on Services
High-performance Classification of Phishing URLs Using a Multi-modal Approach with MapReduce Niju Shrestha, Rajan Kumar Kharel, Jason Britt, and Ragib Hasan Department of Computer & Information Sciences University of Alabama at Birmingham Birmingham AL, 35294 problem we address in this paper is to examine a website and determine whether it is a phishing website or a genuine website. Current approaches for such classification run as standalone processes. Common multimedia information retrieval algorithms prioritize producing good results over producing results faster. Most existing research neglects run time performance, which reduces their usability in the real world. In this paper, we argue that a phishing classification algorithm that achieves high performance by utilizing the distributed computing model on a cloud could provide a practical and real-time solution. To attain higher performance while using a multi-modal approach, we utilize Hadoop’s MapReduce framework. Hadoop mappers are used to extract the multi-modal features from the phishing websites. In our work, the visual features extracted are local color code histogram and dominant color feature. The textual feature extracted is the term frequency of the webpage. A majority vote amongst the three classifiers based on local histogram, dominant color, and word frequency feature is used to determine the most similar brand for a phish. The classification is also done using the MapReduce framework. To demonstrate the advantage of our cloud based classification approach, we used four different computing environments to evaluate the runtime performance and financial cost for the multi-modal phish classification. One environment is non-distributed and three environments are distributed. All three distributed environments performed better than the non-distributed environment in terms of both runtime and financial cost.
Abstract— Classifying phishing websites can be expensive both computationally and financially given a large enough volume of suspect sites. A distributed cloud environment can reduce the computational time and financial cost significantly. To test this idea, we apply a multi-modal feature classification algorithm to classify phishing websites in a non-distributed and several distributed environments. A multi-modal approach combines both visual and text features for classification. The implementation extracts color feature and histogram feature from the screenshot of a phishing website and text from its html source code. Feature extraction and comparison is accomplished by applying the MapReduce framework. Implementing the multimodal approach in a distributed environment proves to reduce the runtime as well as the financial costs. We present results that show our work is 30 times faster than existing state of the art systems in phishing website classification problem. Keywords- Phishing, Map Reduce, Color code
I.
INTRODUCTION (HEADING 1)
In phishing attacks, malicious attackers steal sensitive information by masquerading as a trustworthy entity. Numerous types of phishing attacks have been identified including phishing attacks that use fake websites. Such phishing websites are created to imitate a particular organization and attempt to convince people to deliver their logon credentials and other information. Financial institutions, email providers, gaming websites, and social networks are all vulnerable to being imitated by phishing websites. A 2013 report from the Kaspersky’s Lab states that phishing attacks are one of the three most prevalent threats in external attacks against corporations [8]. The Anti-phishing Working Group (APWG) reported an average of 41,738 new attacks per month in the first quarter of 2014 [9]. The report also states that the number of phishing sites in the first quarter of 2014 grew 10.7% over the previous quarters. Quickly identifying a phish’s brand and reporting it to the victim organization is very important in dealing with phishing attacks. It allows the victim organization to respond to the attack by requesting the website to be removed from the hosting service, to initiate internal responses to limit account compromise, and to notify users.
Contributions: The contributions of this paper are as follows: We develop a high performance multi-modal phishing website classification system using MapReduce.
2.
We conduct performance evaluations to demonstrate the significant performance and cost advantage of our system over the existing state-of-the-art.
3.
We conduct extensive experiments on real cloud using Amazon EMR and Amazon S3.
Organization: The rest of the paper explores the details of the multi-modal phish classification algorithm and its performance in a non-distributed versus a distributed environment. In Section II, we discuss the related research. Section III presents our approach and algorithms. We describe our distance measures for the classification task in Section IV, and the classification technique in Section V. In Section VI, we discuss our experimental setup and results, and provide an analysis in
One key insight is that phishing websites are visually similar to the authentic brand’s website. Also, the text content in the phishing website and legitimate brand’s website are very similar. Considering those two things, visual similarity and text content, we propose a multi-modal approach to classify and identify a website as a phishing website. The classification
978-1-4673-7275-6/15 $31.00 © 2015 IEEE DOI 10.1109/SERVICES.2015.38
1.
205 206
Section VII. Finally, we conclude in Section VIII and explore potential future directions of research. II.
textual feature is term frequency feature vector. Altogether the three features extracted in this way forms the basis of comparison of the websites.
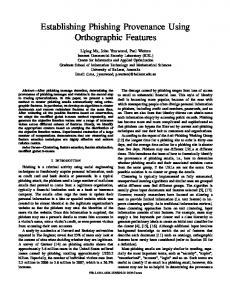
RELATED WORK For distributed computing purpose, we used MapReduce architecture implemented in the Hadoop framework shown in Figure 1.
Most phishing classification is focused on the binary classification of websites as phishing or non-phishing websites. There does exist binary classification work that utilizes html source code comparisons and URL extracted features. Two binary classification approaches make use of source code comparisons by breaking the source code into components and comparing the components [13] [14]. URL based approaches extract features from the URL to perform classification [15]. There is some phishing classification work focused on nonbinary classification and clustering phishing websites based upon imitated brand. Weaver and Collins cluster phishing websites based upon the host’s websites IP address or ASN number [16]. [17] and [18] use a structural analysis technique comparing local domain files to create clusters of related phish. Zawoad et al. cluster phishing websites using email addresses receiving the phished credentials [19]. These email addresses are found in the phishing kits used to create the phishing websites. Some recent spam and phishing research uses image analysis. Zhang et al. [1] proposed a multimodal framework that clusters spam images to detect a common source. Fu et al. [2] used Earth Movers’ Distance (EMD) to measure Web page visual similarity and perform binary phish classification. Cordero et al. [3] used a computer vision approach by applying Principal Component Analysis (PCA) on screenshots to project 256-d dataset into a 4-d. [20] uses Microsoft Office Document Imaging (MODI) for OCR purposes and extracts texts from a webpage. The extracted text is then searched via Google to determine its credibility. In [21], the authors propose a method to read each line of the html source code of a webpage and check for images, login URLs, script tags, pop-up windows etc. to determine a security percentage of the webpage. But, the authors had not tested their work on real phish websites. Existing research focuses on the classification or clustering effectiveness, but not on run time and financial costs of performing classification or clustering. Considering the sheer volume of phish webpages, execution time plays a vital role in practicality of a solution. Also, most of the existing solutions are text-based, which can be easily gamed because a website can be built only using images and logos. III.
Figure 1.
Feature Extraction from Webpage Screenshots Using MapReduce
MapReduce provides an easy computational model, which is data scalable. In this approach, programs are written in a functional programing style. Then they are automatically parallelized and executed on large clusters of computers. Hadoop’s run time system takes care of dividing the input data, scheduling program executions in different nodes, handling machine features, and managing the machine-to-machine communication like MPI. Similarly, the framework also handles faults and deadlocks, so that the programmers need not worry about it. Hadoop uses Hadoop Distributed File System (HDFS) which provides high-performance access to data across Hadoop clusters and plays a key role in managing large data pools and supporting big data analytics applications. B. Model Our ground truth data set consisting of the 380 manually gathered brand websites is processed and stored. Both visual and textual features are collected in the process. Similar process is done for the test data as well. The test data is then compared to the brand websites from the ground truth dataset and matched using majority voting between the three classifiers. Each classifier compares a test website to the brand website based on one of the three features – local histogram, dominant color and word frequency. Each classifier finds the most similar ground truth brand page according to its feature. The three classifiers are then combined using a majority vote to choose a ground truth brand page.
OUR APPROACH AND ALGORITHMS
In this section, we provide an overview of our MapReduce based Phishing classifier. A. System Components Our system consists of a series of Hadoop mapper and reducer nodes working under the MapReduce programming model. There are two major components and each of them employs their own Hadoop MapReduce nodes. One of these components processes the images of the phishing websites under observation. Processing any website here means extracting visual and textual features from the webpage using Hadoop mappers. The visual features include local color histogram and dominant color feature. Another major system component processes the texts extracted from the websites. The
C. Local Color Histogram We apply LCH (Local Color Histogram) to compare the visual similarity of the two websites. The histogram of an image refers to a histogram of the pixel intensity values. In our approach, we represent each pixel by a 6-bit color code [4] formed by taking the two most significant bits from each 8-bit R, G, B channel as shown in Figure 2. So, for each pixel, we can map particular pixel to a value range of [0, 63]. In this case, 64-bin histogram is created for each image. There are two different ways to calculate histogram for a particular image.
207 206
containing the word and the number of times it occurred in the webpage. A word list is generated for each of the bodies of text to be compared. Combining the two word lists creates a dictionary, which is the feature set. Based on the feature set value for each text, a feature vector is generated. The cosine similarity of the two feature vectors determines the similarity of the two webpages. Figure 2.
Color Code Extraction from pixel
E. Dominant Color Detection Color features are extensively used in multimedia retrieval systems. Retrieving low-level visual features such as color has received significant attention in recent research. In general, a color feature is considered to be one of the distinguishable features in image matching and retrieval system. The authors [5] have postulated that the early perception in human visual system performs dominant color identification by eliminating the details in small areas. Therefore, human perception of a particular image is a combination of dominant colors and not an exact color distribution. Our dominant color extraction algorithm in RGB color space is as follows.
They are GCH (Global Color Histogram) and LCH (Local Color Histogram). In our approach we used LCH to extract the visual information from the phishing screenshot. To calculate LCH, the screen shot of a phishing webpage is divided into M*N grid cells and GCH for each cell is calculated. The similarity of the two images, phishing webpage screenshot and the ground truth screenshot is the sum or average similarity of corresponding cell pairs between these two images. Based on our observation, we found that the phishing website and its targeted legitimate website are visually similar. The LCH algorithm is sensitive to local color distributions, but GCH is not. GCH cannot detect the change in location of an object on the screen such as a logo, text and images. Also, two visually different images may have very similar global color histograms. This contributes to the false positive rate.
1. 2. 3. 4. 5. 6. 7. 8. 9.
Enumerate every fifth pixel. Extract RGB value from the pixel. If the RGB value is in grayscale, ignore it. Retrieve RGB value’s counter value. If count is null, initialize it with 1. Else increase its value by 1. Go to step 1 Retrieve the RGB with highest counter value. Convert the RGB value to CIE Lab color space.
Conversion from RGB to CIE Lab color space is a two-step process carried out using following algorithms. Algorithm for Conversion from RGB to XYZ [10] 1. 2.
Figure 3.
Local Color Histogram Extraction
Figure 3 shows screenshots of a phish webpage and legitimate webpage for an established brand. Clearly, the two webpages are very similar visually. We divide the images into 9 blocks and extract the LCH for each block. Then, a blockwise histogram comparison is done to determine similarity between the two webpages.
3. 4.
D. Term Frequency Feature selection is an important step in text matching and categorization. The chosen features should be a good representation of the text. They should also readily allow text from different categories to be differentiated. Term frequency is one method used to determine text similarity. After removing all stops words and preprocessing the text extracted from a webpage, a word list is generated
var_R = (R /255) var_G = (G / 255) var_B = (B / 255) if (var_R > 0.04045) var_R = ((var_R + 0.055) else var_R = var_R / 12.92 if (var_G > 0.04045) var_G = ((var_G + 0.055) else var_G = var_G / 12.92 if (var_B > 0.04045) var_B = ((var_B + 0.055) else var_B = var_B / 12.92 var_R = var_R * 100 var_G = var_G * 100 var_B = var_B * 100 //Observer. = 2°, Illuminant = D65 X = var_R * 0.4124 + var_G 0.1805 Y = var_R * 0.2126 + var_G 0.0722 Z = var_R * 0.0193 + var_G 0.9505
/ 1.055) ^ 2.4
/ 1.055) ^ 2.4
/ 1.055) ^ 2.4
* 0.3576 + var_B * * 0.7152 + var_B * * 0.1192 + var_B *
Algorithm for Conversion from XYZ to CIE Lab color [10] 1.
208 207
var_X = X / ref_X
//ref_X = 95.047
2.
3.
var_Y = Y / ref_Y //ref_Y var_Z = Z / ref_Z //ref_Z if (var_X > 0.008856) var_X = var_X ^ (1/3) else var_X = (7.787 * var_X) + (16 / if (var_Y > 0.008856) var_Y = var_Y ^ (1/3) else var_Y = (7.787 * var_Y) + (16 / if (var_Z > 0.008856) var_Z = var_Z ^ (1/3) else var_Z = (7.787 * var_Z) + (16 / CIE-L* = ( 116 * var_Y ) - 16 CIE-a* = 500 * ( var_X - var_Y ) CIE-b* = 200 * ( var_Y - var_Z )
= 100.000 = 108.883
except that here the input sequence file is combination of texts extracted from the webpages and the output is the word frequency feature vector.
116)
116)
116)
Color space is a scheme for describing color. International Commission on Illumination has defined CIE XYZ color space which is widely used in scientific work [6]. CIELuv and CIELab are two CIE based color spaces. In our work, we used CIELab color space because it is nearly linear to human visual perception.
Figure 4.
Output from the Image Features Extractor
F. Feature Extraction A typical MapReduce job for processing big data involves splitting of input data file into chunks and feeding them to multiple mappers. Each mapper does its respective task and writes the produced output to a context. Reducers would then aggregate or combine results produced by all the mappers. Figure 3 demonstrates our visual feature extraction process. Since, Hadoop’s MapReduce has better performance for a large file than a number of smaller files, the ground truth and test data set screenshots are incorporated into screenshot sequence files. Sequence files are flat files consisting of key/value pairs where each pair would represent an input [7]. MapReduce uses sequence files for input and output. Temporary mapper outputs are also stored in sequence files. The ground truth screenshots sequence file that we create has the brand name as the key and the byte representation of the webpage image as the value. The test data sequence file has a unique id for each webpage as the keys.
Figure 5.
Feature Extraction from Webpage Text Using MapReduce
The process of visual and textual feature extraction is completely independent of each other and can be executed in parallel. Figure 6 shows the output from the text feature extractor mapper.
The feature extractor is a MapReduce job that takes a sequence file as its input. It processes the bytes representation of the screenshots and extracts the local color histogram and dominant color features. The output is written to another sequence file. The key remains same as the input file while the value is the set of vectors representing the extracted features. A screenshot of output from the color features extractor is shown in Fig 4. The first two values after the key is the image width and image height respectively. The color code features are written after the image dimension information. We extract local histograms for 9 (3*3) blocks. Each histogram contains 64 bins. The local histogram features vectors are followed by the dominant color feature. Three floating point values at the end represent dominant color information for the webpages.
Figure 6.
Output from the Text Features Extractor
To calculate the word frequency in a web page, we do some preprocessing of the content. First we only extract words from the webpage and remove stop words from them, as defined by Google. We skip digits, words containing “_” and words less than 3 characters long. After pre-processing, we calculate the frequency of the each word in the document. Mapper writes the filename as the key and the word frequency information as the
A similar process is carried out to extract textual features from the webpages. Figure 5 is pretty much like Figure 3
209 208
value. In Figure 6, the first value is the key, and the content after that is the word frequency information for that particular web page. The feature vector is of form [word1:count1 word2:count2 … wordn:countn]. IV.
While comparing any two webpages, their word frequency vectors are combined to form a dictionary. The similarity of the test webpage and the ground truth is calculated based on the occurrences of the dictionary words in them.
DISTANCE MEASURES
Extracted three different features are used to compare the web pages with the ground truth pages. We have used different distance metrics to compare the test images with the ground truth. Manhattan distance is used to calculate the distance between the local histogram features of the screenshots and shown in (1). D (Ti, Gj) =
V.
CLASSIFICATION
The webpage classification process is to associate/cluster similar webpages based on their visual and textual similarity. The details of the classification process are given below and in Fig 7.
(1)
In (1), Ti is the ith test webpage screenshot and Gi is the jth ground truth screenshot. X[k] and Y[k] are the values of kth histogram bins. To calculate the Manhattan distance between these two images, we enumerate each block from the list of 9 blocks and calculate the Manhattan distance between two histograms. Adding those all 9 distances gives the distance between two images based on the color code features. Figure 7.
Similarly, we have used DeltaE measure to calculate distance between the dominant color of the test webpages and the ground truth webpages. The following (2) gives a distance between two colors (L*1, a*1,b*1) and (L*2, a*2, b*2) in CIE Lab color space [11].
From our feature extraction process described in Section 3.5, we have our visual and textual feature files ready for both the ground truth data set and the test data set. Now, the classification process is carried out by two other MapReduce jobs. One of them would carry out the classification according to visual features, namely – the color code local histogram feature and the dominant color feature, whereas other MapReduce job would classify based on the text features. Again, both classification processes are completely independent of each other and can be executed in parallel.
(2) Where =
-
= = =
Setup: The mappers of the job are fed with all the information about the ground truth in order to make them compare each of the test webpage with the entire ground truth webpage set. The process is demonstrated through Fig 7.
-
=
Input: The mappers’ input is the sequence files derived from feature extraction process for the test data set. The sequence files contain the unique id of the webpage as the keys and it’s features as the values.
= =
=1 = 1+ = 1+
Output: The mappers’ output is the most similar brands assigned to the webpages based on each individual feature that we discussed in Section 3.1, 3.2 and 3.3. Basically, the MapReduce job computes distance/similarity of each of the test webpage to the entire ground truth data set, as described in Section 4. The classifier then chooses the closest brand according to a feature for the test webpage. The MapReduce output is written to another sequence file.
Finally, we have used cosine similarity to calculate the distance between the test webpages and the ground truth webpages based on the word frequencies, as shown in (3). D (A, B) =
Classification Process
Finally, we have brands assigned by the classifiers based on three different features. A majority voting is then carried out to pick one brand per test webpage.
(3)
Equation 3 is the formula to calculate cosine similarity between two vectors. First, we extract the word frequency features from both test and ground truth web page. This features set includes word and number of occurrence of the word in the webpage.
210 209
VI.
UAB cluster. The last two test beds are clusters of Amazon EC2 instances on Amazon Elastic MapReduce (EMR) environments. The first Amazon EMR environment consists of 20 m1.large Amazon EC2 instances, while the second environment consists of 20 m1.xlarge instances. The main differences between the Amazon m1.large and Amazon m1.xlarge instance are the memory size, core count, and different processor type.
EXPERIMENT
A. Dataset The experimental dataset is selected from the UAB phishing data mine from the phish data collected between February 1st 2013 and June 31st 2013. The data consists of 80965 phishing websites information [4]. The data mine contains source URLs, the html source, all files referenced by the phish, and a screen shot of the phish webpage. The html source, files referenced by the phish, and the screenshots have been collected using a web crawler that makes use of a web browser mechanization tool. The source URLs for the phish come from a large spam-based URL provider, a large antiphishing company, private companies, security companies, and financial institutions. Because of the source URL providers the UAB data mine favors financial institutions and under represents gaming and social media phish.
VII.
DISCUSSIONS
Costs and run times of execution in different test beds are compared. There are several interesting results to notice as shown in Fig 10.
The ground truth data set consists of 380 different brand websites who could be targeted by a large-scale phishing attacks. For each brand website the html page source and a screenshot were gathered manually. Fig 8 sums up information about our data.
Figure 10.
Figure 8.
Performance in different Environments
A single node machine running a non-MapReduce version of our technique takes around 10 hours for completion. A nonMapReduce version follows a sequential execution pattern. However, there is no need for creating sequence files with this approach. Nevertheless, the processing of over 6.6 GB of data in a single node machine sequentially is impractical.
Data Size
The total size of the webpage screenshots is 6.6 GB, which is a reasonable size data for our research. The ground truth data and the test data sets were then combined into sequence files, as Hadoop MapReduce performance is better for a large file than a number of smaller files. The conversion into sequence files slightly reduced the size.
When we utilized Hadoop’s MapReduce framework and tested our approach on an 8-node local cluster, the execution time drastically reduced to mere 20 minutes. This was a huge gain. Considering the fact that setting up a cluster in today’s date has been much easier by many Cloud Service Providers (CSPs), our next test bed was Amazon EMR. We created two 20-node clusters of Amazon EC2 m1.large and m1.xlarge instances and their execution times were 10 minutes and 6 minutes respectively.
B. Test Environment and Results Fig 9 shows our test environments configurations and the time and cost of executing our proposed technique in the machine.
It is also clear from Figure 9 that m1.xLarge instances are better than others in terms of the specifications. Therefore, the cost of using 20 of them is relatively larger. The cost of Amazon EC2 instances is calculated using standard Amazon web service usage calculator [12]. We have also used Amazon S3 bucket for storage of the input, output and intermediate files produced by the MapReduce jobs. However, the cost of storage is not very significant. Figure 9.
The cost associated with using Amazon environment was determined easily. However, there is no such detailed cost tracking mechanism for the local machines of UAB. To determine the cost of operation of local UAB machines, we considered various factors. These factors were the commodity costs of the machines, cost of network infrastructures,
Test Environments
There are four different environments that we tested on. The first two environments are local UAB machines/cluster. The first test environment is a single node machine on the local UAB cluster, while the second environment is an 8-node local
211 210
[4]
maintenance, system administration, cooling, and power costs. Considering all these costs and the lifetime of the machines, we calculated the cost of operation on an hourly basis. The machine cost per hour was then multiplied by the total execution time of our algorithm to determine the total cost, which is mentioned in Figure 9.
[5]
[6] [7] [8]
The Amazon EMR m1.large environment outperforms the UAB environments on both cost and performance and also strikes the best balance between cost and performance.
[9] [10] [11] [12] [13]
Another important thing worth mentioning at this point of discussion is that our approach can accommodate very large number of features from the data without significant increase in execution time. Also, our implementation approach is very generic and can be utilized for many of the image processing applications like content-based image retrieval etc.
[14]
VIII. CONCLUSTIONS AND FUTURE WORK Automatic phishing website classification in distributed cloud environment using Hadoop MapReduce framework is developed. The multi-modal features, visual and text are extracted from phishing webpage screenshot and html source codes respectively. The feature extraction and classification are both done in distributed cloud environment using Hadoop MapReduce framework. The results from our experiments show that feature extraction and classification of phishing websites in distributed cloud environment is less time consuming as compared to non-distributed environment. Hence, it stands out as a practical solution when we consider the growing volume of phishing attacks.
[15]
There are many possible enhancements to our approach. In the future, we plan to further explore other visual and text features to improve accuracy of our classification process. Currently, we are considering only color information, considering textural features might improve the accuracy. Structure of the phishing website can also be an important factor while comparing the phishing website and ground truth webpages. Structure of a webpage can be obtained from the DOM element of the HTML page. So, we can try to extract the HTML tag elements as features. Furthermore, we can try techniques of combining classifiers other than majority voting. We can also try machine learning and probabilistic model techniques for better accuracy.
[19]
[16]
[17]
[18]
[20]
[21]
[22]
Acknowledgement. This research was supported by an Amazon.com AWS for Education Grant and the National Science Foundation CAREER Award CNS-1351038. IX. [1]
[2]
[3]
REFERENCES
C. Zhang, W.-B. Chen, et al., “A Multimodal Data Mining Framework for Revealing Common Sources of Spam Images,” Journal of Multimedia, Vol. 4, No. 5, A. Y. Fu and X. Deng, “Detecting Phishing Web Pages with Visual Similarity Assessment Based on Earth Mover’s Distance (EMD),” in IEEE TRANS. On Dependable and Secure Computing 2006 A. Cordero and T. Blain, “Catching Phish: Detecting Phishing Attacks from Rendered Website Images,” in Proc. of the 16th Intl. Conf. on World Wide Web, 2007.
212 211
M. J. Swain and D. H. Ballard, “Color Indexing,” in Intl. J. of Computer Vision, 1991. Yang, N. C., Chang, W. H., Kuo, C. M., & Li, T. H. (2008). A fast MPEG-7 dominant color extraction with new similarity measure for image retrieval. Journal of Visual Communication and Image Representation, 19(2), 92-105. Kerr, Douglas A. "The CIE XYZ and xyY Color Spaces." (2010). http://wiki.apache.org/hadoop/SequenceFile http://www.kaspersky.com/about/news/virus/2013/Malware_spam_and_ phishing_the_threats_most_commonly_encountered_by_companies http://blog.phishlabs.com/the-week-in-cybercrime-july-3-2014 http://www.easyrgb.com/ http://en.wikipedia.org/wiki/Color_difference http://calculator.s3.amazonaws.com/index.html R. Basnet, S. Mukkamala and A. H. Sung, "Detection of Phishing Attacks: A Machine Learning Approach," Soft Computing Applications in Industry, pp. 373-383, 2008. R. Suriya, K. Saravanan and A. Thangavelu, "An Integrated Approach toDetect Phishing Mail Attacks A Case Study," in Proceedings of the 2nd International Conference Cyprus, Turkey, 2009. B. Gyawali, T. Solorio, M. Montes-y-Gomez, B. Wardman and G. Warner, "Evaluating a Semisupervised Approach to Phishing URL Identification in a Realistic Scenario," in Proc. of the Conference on Email and Anti-Spam, Perth, Western Australia, Australia, 2011. R. Weaver and M. Collins, "Fishing for Phishes: Applying CaptureRecapture Methods to Estimate Phishing Populations," in Proc. of the Anti-Phishing Working Groups 2nd Annual eCrime Researchers Summit, Pittsburgh, PA, 2007. J. Britt, B. Wardman, A. Sprague and G. Warner, "Clustering Potential Phishing Websites Using DeepMD5," in Proc. of the 5th USENIX Conference on Large-Scale Exploits and Emergent Threats, 2012. B. Wardman, G. Shukla and G. Warner, "Identifying Vulnerable Websites by Analysis of Common String in Phishing URLs," in Proc. of the eCrime Researchers Summit, Tacoma, WA, 2009. S. Zawoad, A. Dutta, A. Sprague, R. Hasan, J. Britt and G. Warner, "Phish-Net: Investigating Phish Clusters Using Drop Email Addresses," in Proc. of the 2013 APWG eCrime Researchers Summit, San Francisco, 2013. M. Dunlop, S. Groat and D. Shelly, “GoldPhish: Using Images for Content-Based Phishing Analysis,” in Proc. of the 5th Intl. Conf. on Internet Monitoring and Protection, 2010. M. Alkhozae and O. Batarfi. "Phishing Websites Detection based on Phishing Characteristics in the Webpage Source Code." International Journal of Information and Communication Technology Research (2011). J. Dean and S. Ghemawat. MapReduce: simplified data processing on large clusters. Commun. ACM 51, 1 (January 2008), pp. 107-113. 2008.