AbstractâHigh-Performance Computing (HPC) in the cloud has reached the mainstream and is currently a hot topic in the research community and the industry.
2012 IEEE 4th International Conference on Cloud Computing Technology and Science
High Performance Computing in the Cloud: Deployment, Performance and Cost Efficiency Eduardo Roloff, Matthias Diener, Alexandre Carissimi, Philippe O. A. Navaux Informatics Institute Federal University of Rio Grande do Sul, Porto Alegre, Brazil {eroloff,mdiener,asc,navaux}@inf.ufrgs.br
Abstract—High-Performance Computing (HPC) in the cloud has reached the mainstream and is currently a hot topic in the research community and the industry. The attractiveness of cloud for HPC is the capability to run large applications on powerful, scalable hardware without needing to actually own or maintain this hardware. In this paper, we conduct a detailed comparison of HPC applications running on three cloud providers, Amazon EC2, Microsoft Azure and Rackspace. We analyze three important characteristics of HPC, deployment facilities, performance and cost efficiency and compare them to a cluster of machines. For the experiments, we used the well-known NAS parallel benchmarks as an example of general scientific HPC applications to examine the computational and communication performance. Our results show that HPC applications can run efficiently on the cloud. However, care must be taken when choosing the provider, as the differences between them are large. The best cloud provider depends on the type and behavior of the application, as well as the intended usage scenario. Furthermore, our results show that HPC in the cloud can have a higher performance and cost efficiency than a traditional cluster, up to 27% and 41%, respectively.
I. I NTRODUCTION Today, cloud services have the potential to provide an alternative to traditional cluster and grid systems [1]. The motivation of moving applications into the cloud is to reduce maintenance and procurement costs while increasing scalability and availability. However, the focus of cloud providers is normally on content delivery and not on high performance computing (HPC). For this reason, there is lack of research targeting the deployment and execution of HPC applications in the cloud. Previous research in this area focuses on porting specific applications to clouds [2], analyzing general properties of different providers [3], comparing single instances of different cloud providers [4]. More detailed performance analysis is restricted mostly to the Amazon EC2 cloud [5]. The objective of this work is to perform a comprehensive evaluation of three important aspects of running HPC applications in the cloud: deployment, performance and cost efficiency. For the evaluation, we use a set of well known HPC benchmarks, the NAS Parallel Benchmarks (NPB) [6], and run them on three different cloud providers: Amazon Elastic Cloud Compute (EC2), Microsoft Windows Azure, and Rackspace. Furthermore, we compare the results to a real cluster with similar characteristics to analyze differences in performance and cost efficiency and provide answers to the questions: Does HPC in the cloud make sense? If yes, for which use cases?
We study the issues that were encountered during setup of the cluster of cloud instances and deployment of applications. We analyzed the process of creating and customizing instances, connection and management issues and initialization time. We also compare the adaptability of the solutions regarding instance sizes, operating systems and network interconnections. In the performance experiments, we evaluate computing performance as well as intra-node and inter-node communication performance. The NAS suite provides a diverse set of benchmarks for HPC applications, evaluating integer and floating point performance as well as communication and data transport between threads and processes. We experimented with a single node to focus on the computational and intranode communication performance, and clusters of 2 and 4 nodes, to focus on computational and inter-node communication. Another important aspect of the cloud is the cost, we evaluate the cost efficiency of each provider and the cluster using a new metric which takes into account the setup costs, hourly costs and performance. In this way, we provide a fair comparison of the providers and arrive at a notion of efficiency for a cloud solution compared to a cluster. With this metric, it is possible to determine which usage pattern and application type can benefit from using a cloud instead of a cluster as a platform to run HPC applications. For these three aspects, each provider has strong points and weaknesses and there is no best provider overall. To efficiently execute large applications in the cloud, it is necessary to analyze two factors, the behavior of the target application and the intended usage scenario, to be able to choose the most appropriate provider. Furthermore, these factors also determine if an application can run faster and more cost efficiently on the cloud than on a traditional cluster. The remainder of this paper is organized as follows. The next section discusses characteristics and issues of deploying HPC applications in the cloud providers we selected for evaluation. The methodology and results of the performance tests is shown in Section III. In Section IV, we introduce the methodology to analyze the cost efficiency of the clouds and show the results using this methodology. Section V presents and compares related work. Finally, Section VI shows our conclusions and ideas for future work.
371
978-1-4673-4510-1/12/$31.00 ©2012 IEEE
2012 IEEE 4th International Conference on Cloud Computing Technology and Science
II. D EPLOYING HPC A PPLICATIONS IN THE C LOUD – I SSUES AND C ONSIDERATIONS
B. Hardware and Software Configurations
In this section we discuss the deployment features of the cloud providers, focusing on the features that are useful to build and operate HPC environments. We analyze the setup procedures to create instances in the cloud, the different hardware and software configurations, system access methods and network interconnection. The discussion in this section is considering a GNU/Linux environment. A. Setup Procedures For our testing purposes, we need to setup a single instance system to test the OpenMP [7] version of benchmarks and also two systems with multiple instances, one with two nodes and other with four nodes to test the MPI [8] version. All the instances need to have the same tools to be possible to run our experiments. In this section we discuss the processes to setup cloud instances, issues to create these instances and the time to boot and have access to them. 1) Amazon EC2: In EC2 the user has a setup tool that helps to configure a computing instance. This tool has a total of eight steps, where the user can set a lot of customized characteristics of the instance, such as the kernel version. In EC2 it is mandatory that the user has a security group defined to create a instance, so this extra step is needed for the first setup. One good characteristic of EC2 is the ability to create multiple instances running the setup tool just once. This is very useful to create multiple instances with the same properties, which is important for HPC. 2) Windows Azure: On Azure user needs to follow four steps to create a instance. To connect several Azure instances to each other, it is necessary to create an affinity group, this extra-step is necessary for the first setup. A big issue in Azure is that it needs exclusive access to create and delete an instance, so is required to wait until the procedures for an instance is finished to start to configure or delete another one. 3) Rackspace: Rackspace provides the easiest tool to setup a system, the user just selects the version of OS and the name of the machine (for management purposes inside Rackspace only) and the machine size. After these steps, the system generates a password for the root user and creates the instance. The user needs to configure one instance at a time, but the provider can create them in parallel. We summarize in Table I the time to create and boot one and four instances and the time spent to delete all the four images from the cloud provider. A short boot and deletion time increases the flexibility and cost efficiency of the cloud, as the user needs to pay during these times as well. EC2 has very short boot and delete times, comparable to a real machine. As Azure instances have to be managed sequentially, they cannot be booted or deleted in parallel. This drastically increases the time needed to manage multiple instances. Rackspace has a time-consuming boot process, however the time does not increase when booting multiple instances. The time to delete instances is short.
An important aspect of building an HPC environment in the cloud is the flexibility of the hardware and software configurations the provider offers. In this section, we analyze the quantity of hardware configuration available, the number of different operating systems available, and the ability to store and change a customized instance. 1) Amazon EC2: EC2 offers eleven configurations for single machines, with a high variety of settings. The smallest configuration is a single core machine with 613 MByte of main memory. There are three large configurations, each one with eight cores and with a different focus: I/O performance, high memory size, or CPU performance. For these configurations, five GNU/Linux versions and five Windows versions are available. EC2 also offers four cluster configurations, two of them are regular clusters with four and eight nodes, one cluster with focus on I/O performance and a GPU cluster. For these configurations, four versions of GNU/Linux and two versions of Windows are offered. In EC2 it is possible to change the size of an instance, but it is necessary to shut the instance down, adjust its size, and then reboot the instance again. Users can create an image directly in the cloud, when an instance is running he can set it as an EC2 image and use it to create new instances. The EC2 cloud uses Xen [9] as the virtualization system. Amazon does not provide a concrete description of the machines, they create their own metric called Compute Units to describe the performance of a hardware configuration. One EC2 compute unit is the equivalent of a 2007 Intel Xeon core running at 1.0 – 1.2 GHz, or a 2006 Intel Xeon core running at 1.6 GHz. 2) Windows Azure: The Azure version of IaaS was just released in June 2012 and is still a preview service. As virtualization tool, it uses Hyper-V [10]. Azure has five hardware configurations for single machines, the smallest is one shared-core with 768 MByte of main memory and the largest configuration is an eight core machine with 14 GByte of main memory. For these configurations Azure offers five Windows versions and four GNU/Linux versions. In Azure the user can change the size of an instance, he needs to stop the instance and then choose the new size of it and reboot. Users can create personal images to launch new instances directly in the cloud using an existing one, but when the user does this, the actual instance is deleted and he needs to launch another one. Also, the user can configure an image in his local system and then upload it to the cloud.
372
978-1-4673-4510-1/12/$31.00 ©2012 IEEE
TABLE I T IME ( MIN : SEC ) NEEDED TO MANAGE THE CLOUD INSTANCES .
Provider EC2 Azure Rackspace
Boot 1 instance
Boot 4 instances
Delete 1 instance
Delete 4 instances
2:34 3:06 12:37
2:34 12:43 12:57
0:33 3:07 0:23
0:33 12:26 0:23
2012 IEEE 4th International Conference on Cloud Computing Technology and Science TABLE II H ARDWARE AND S OFTWARE P ROPERTIES OF A SINGLE MACHINE . Property Number of different hardware configurations Change size of created instances Min/Max memory size (GByte) Min/Max number of cores Supported OS
EC2
Azure
Rackspace
11
5
8
Yes
Yes
No
0.613 – 68
0.768 – 14
0.256 – 30
1 to 8 GNU/Linux, Windows
3) Rackspace: Rackspace has eight hardware configuration for single machines, the smallest one is a machine that shares a single core among four instances and has 256 MByte of main memory, the largest is an eight core machine with 30 GByte of memory. The information about the cores is not available in the user portal, we needed to call the support to obtain it. The Rackspace IaaS cloud uses openstack1 as the cloud management system. For these configurations Rackspace has twenty GNU/Linux versions and nine Windows versions available. Also, the instances in Rackspace have a virtual hard disk that the user can use to store applications and data, in the other providers storage is just provided for the OS. This space is limited and users need to buy extra space for larger applications. Changing the size of an instance is not supported by Rackspace, it is necessary to delete an instance and create another one. To create an image, the user needs to backup an existing one and launch the backup as a different instance. Table II contains a summary of the hardware and software properties of single machine configuration that the cloud provides are offering. C. System Access and Interconnection This subsection describes the functionalities that each provider offers in terms of connection for user management, interconnection between instances, and the ability to connect to other systems. 1) Amazon EC2: The access to the machines is available using SSH and FTP over the Internet. Each instance receives its own DNS name. The user does not know the root password and the access is granted by using a ssh key generated by EC2. When a user configures a new instance he needs to define which private key to use. A good aspect of this method is that is possible to use the same key for all instances. When a new instance is created, it is necessary to choose a security group to be part of. The instances in the same security group can connect to each other. To connect a local system to the cloud it is necessary to create a key pair and use it in both systems, but if the user needs to use a specific kind of connection, EC2 suggests to configure a VPN connection between them. 1 http://openstack.org
2) Windows Azure: To access the instances, the user receives a DNS name. Azure has a functionality to create affinity groups, which is useful for managing the instances. If the instances belong to the same affinity group, they receive the same DNS name, just varying the connection ports for SSH and FTP between them. When creating a new instance, the user can define if the access will be made by setting the user name and password or using a ssh key generated by him. 3) Rackspace: Each instance in Rackspace receives a public IP address and can be accessed over the Internet. Authentication is made by user name and password, the initial password is defined by Rackspace. Instances can connect to each other by using the IP address. To connect another system to the cloud, the user can use the same IP address, and it is possible to connect to it as in a local network. None of the cloud providers provide information about the specific network interconnection used between the machines. Additionally, it is not possible to determine the network latency or distance between nodes. This can provide challenges to applications that communicate a lot, and is a major disadvantage compared to clusters. In EC2 and Azure, the user can create instances in groups, called security or affinity groups. The providers intend to allocate instances in the same group, closer to each other, however they cannot guarantee it. We think that this feature needs to be extended to be more transparent to the user. III. P ERFORMANCE A NALYSIS To compare the performance of cloud solutions we use a single instance to evaluate the performance of the computation and intra-node connections. Furthermore, we use instances with two and four nodes to additionally evaluate the inter-node connections. In this section we present the benchmarks used in the experiments and a description of the cloud machines and the cluster used to run the benchmarks. Subsequentely, we present and discuss the results we obtained. A. Benchmarks used in the Evaluation To evaluate the computing performance, we used the OpenMP and MPI implementations of the Numerical Aerodynamic Simulation Parallel Benchmarks (NPB), version 3.3.1. NAS was designed to compare the performance of parallel systems, and is composed of kernels which calculate Computational Fluid Dynamics (CFD), derived from important problems in aerophysical applications. These CFD simulations reproduce a large portion of the data movement and computation found in complete CFD codes. We run the benchmarks with problem class B, which is a medium problem size suitable for clusters of machines. The memory usage of all benchmarks is lower than of all the machines used in the evaluation. Table III summarizes the properties of the benchmarks. The DC benchmark focuses on the performance of file system access, creating and modifying large data files (up to 20 GByte). As we do not benchmark disk access, we did not include DC in our experiments.
373
978-1-4673-4510-1/12/$31.00 ©2012 IEEE
2012 IEEE 4th International Conference on Cloud Computing Technology and Science TABLE III OVERVIEW OF THE NAS B ENCHMARKS USED IN THE E VALUATION . Name Description BT CG DT EP FT
Block Tridiagonal Conjugate Gradient Data Traffic Embarrassingly Parallel Fast Fourier Transform
IS
Integer Sort
LU
Lower and Upper Triangular
MG
Multigrid
SP UA
Scalar Pentadiagonal Unstructured Adaptive
Focus Floating point performance Irregular communication Data Movement Floating point performance All to All communication Integer performance Regular communication Regular communication Floating point performance Irregular communication
Language
Version
Fortran
OpenMP, MPI
Fortran
OpenMP, MPI
C
MPI
Fortran
OpenMP, MPI
Fortran
OpenMP, MPI
4) Cluster: These machines consist of nodes with two Intel Xeon E5530 processors, each containing four cores running at 2.33 GHz with one thread per core and 12 GByte of main memory. They are interconnected with a standard Gigabit Ethernet network. Table IV summarizes the relevant properties of the execution environments for comparison. 5) Common Software Configuration: All systems are using Ubuntu 12.04 as the operating system. The benchmarks were compiled with GCC 4.6.3. For the MPI experiments, we used mpich2 as the runtime environment.
C
OpenMP, MPI
C. Performance Results
Fortran
OpenMP, MPI
Fortran
OpenMP, MPI
Fortran
OpenMP, MPI
Fortran
OpenMP
B. Machines For our experiments we use three well know IaaS cloud providers, Amazon Elastic Compute Cloud (EC2), Microsoft Windows Azure and Rackspace. Additionally, we performed the experiments on a cluster of real machines. To compare the cloud computing platforms and evaluate their overhead, we ran the benchmarks on a set of machines whose specifications approximate the hardware specifications of the cloud solutions as closely as possible. In this section we describe these systems and their configuration. 1) Amazon Elastic Compute Cloud: We selected the HiCPU Extra Large On-Demand configuration, which is the one whose specifications match the specifications of the Azure and Rackspace configurations the closest. The selected configuration consists of eight cores with about 2.5 GHz – 3.0 GHz. The cost of this configuration is USD 0.66 per hour2 . The use of EC2 cluster configurations is also possible, but using these is the same as renting a cluster and is not adequate for the cloud computing philosophy, because the size of the cluster is predefined and you cannot increase it, so for this experiments, we use the EC2 regular machines. 2) Windows Azure Cloud: The chosen configuration, Extralarge Compute, consists of a machine with eight cores running at 1.6 GHz and 14 GByte of memory. The cost of this configuration is USD 0.64 per hour3 . 3) Rackspace Cloud: We select the largest configuration available in Rackspace, this configuration consists of a 8 cores machine running at 2.4 GHz and 30 GByte of main memory. The cost of this configuration is USD 1.80 per hour4 . 2 http://aws.amazon.com/ec2/#pricing 3 http://www.windowsazure.com/en-us/pricing/calculator/advanced/ 4 http://www.rackspace.com/cloud/cloud
hosting products/servers/pricing/
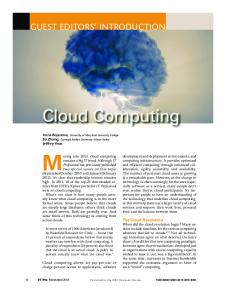
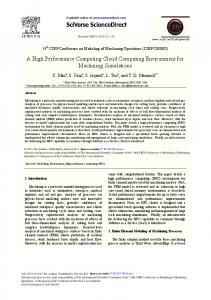
We performed the experiments in three configurations, with 1, 2 and 4 nodes per system. Each benchmark was executed 50 times in each configuration. Figures 1, 2 and 3 show the average execution time, as well as the confidence interval for a confidence level of 95% in a Student’s t-distribution. As the absolute values of the execution time vary widely between the benchmarks, we chose to normalize all values to the execution time on the cluster. Figure 1 contains the performance results for a single node running the OpenMP version of the benchmarks. For all benchmarks, the cluster was the fastest system. However, the results differ greatly for different providers and benchmarks. Azure and Rackspace have a similar performance with a slight advantage for Azure, except in the case of IS and LU when Rackspace was better. For BT, FT and IS, the performance of EC2 is similar to the other two cloud providers as well. For CG, LU, MG, SP and UA, the performance is much worse however. Interestingly, for the EP benchmark shows a better performance compared to the other clouds. This can be attributed to the higher processor frequency in EC2, as this benchmark only focuses on raw computation. Benchmarks with a higher amount of communication, present worse results. Summarizing the results of a single instance, Azure and Rackspace perform better than EC2, but all clouds have a reduced performance compared to the cluster. Figure 2 contains the performance results for two nodes running the MPI version of the benchmarks. Compared to the single instance, the behavior of results are different. For TABLE IV C ONFIGURATION OF THE SYSTEMS USED IN THE PERFORMANCE EVALUATION . Parameter Instance name
Azure
Rackspace
Cluster
Extra Large VM
n/a
n/a
n/a
n/a
Intel Xeon E5530
1.6
2.4
2.33
8
8
8
14
30
12
Processor model Processor ∼ 2.5 – 3.0 Speed (GHz) Number of 8 cores Memory/machine 7 (GByte)
374
978-1-4673-4510-1/12/$31.00 ©2012 IEEE
EC2 High-CPU Extra Large 2006/2007 Intel Xeon
Execution Time (normalized)
2012 IEEE 4th International Conference on Cloud Computing Technology and Science
400 %
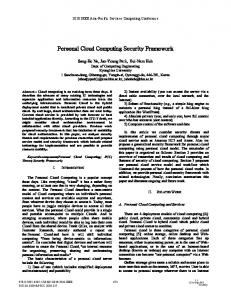
all benchmarks except EP, for which all cloud providers have a very similar performance, Rackspace has the worst performance with a more than double execution time compared to the cluster. EC2 was faster for EP and DT than Azure, for the other benchmarks the proportion between them are similar to the single node results. An interesting point is that for the FT and IS benchmarks, Azure reaches the same performance as the cluster. Summarizing the results, Azure performs better than EC2 with Rackspace performing worse than both. Again, the cluster performs better than the clouds. The results of the final experiment, running the MPI version of the benchmarks on 4 nodes, are shown in Figure 3. Here, the results on the clouds are much closer to the cluster than in the previous two experiments. The reason for this behavior can be attributed to the network performance, which prevents a better scaling of the cluster performance. For all benchmarks except DT and EP, Azure is faster than the cluster. EC2 is faster than the cluster for CG and IS. Rackspace has the same performance as the cluster for the FT benchmark. Rackspace and EC2 show a similar performance for all benchmarks with a slight advantage for EC2. In summary, Azure has a better performance than the other clouds and the cluster, with EC2 and Rackspace having a slightly worse performance than the cluster.
300 %
D. Discussion of Performance Results
600 % 500 % 400 % 300 % 200 % 100 % 0% BT
CG
EP
FT
IS
LU MG
Azure
EC2
SP
UA Avg.
Rackspace
Execution Time (normalized)
Fig. 1. Execution time of the OpenMP implementation, running on a single node. Values are normalized to the execution time on the cluster.
600 % 500 %
200 % 100 % 0% BT
CG
DT
EP
FT
IS
Azure
EC2
LU MG
SP Avg.
Rackspace
Fig. 2. Execution time of the MPI implementation, running on 2 nodes. Values are normalized to the execution time on the cluster.
Execution Time (normalized)
200 %
150 %
100 %
50 %
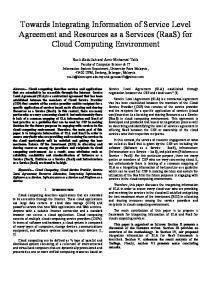
Figure 4 summarizes the performance results for all experiments, normalized again to the cluster. As we can see, all clouds present performance issues. The performance of a single or two nodes is generally worse than the cluster. However, the performance of the clouds scales well, and they achieve the same performance of the cluster or even surpass it with four nodes. EC2 and Azure have the same behavior with a similar rate for scaling more instances. Rackspace presents a high degradation with two instances. Overall, Azure has best results in clouds, but as seen in last sections, for applications that focus on raw computation, EC2 and Rackspace perform better. Another important result is the relatively low variability. With one node, we observed a very low variability in all experiments. For two and four nodes, we obtained almost the same variability that was presented by the cluster. Compared to a previous work [4], the results for EC2 and Azure are much better now, both in terms of execution time and variability. We can therefore conclude that the cloud providers are improving their management systems and procedures, as well as the hardware. IV. C OST E FFICIENCY
0% BT
CG
DT EC2
EP
FT Azure
IS
LU MG
SP Avg.
Rackspace
Fig. 3. Execution time of the MPI implementation, running on 4 nodes. Values are normalized to the execution time on the cluster.
Since the price of each cloud solution vary greatly, only taking the performance into account when comparing cloud providers is not sufficient. A fairer comparison is achieved by scaling the performance value with the price per hour. We call this metric cost efficiency. In this section, we will introduce this metric and use it to obtain a more comprehensive comparison of the cloud solutions and the cluster. Additionally, this
375
978-1-4673-4510-1/12/$31.00 ©2012 IEEE
2012 IEEE 4th International Conference on Cloud Computing Technology and Science
For the cloud solutions, there is no additional charge except the hourly price as specified by the provider. We do not take into account the price to create and configure of the instances.
Execution Time (normalized)
400 % 300 %
B. Calculating the Cost Efficiency and Break Even Point 200 % 100 % 0% One node
Two nodes EC2
Fig. 4. cluster.
Azure
Four nodes Rackspace
Average execution times, normalized to the execution time on the
metric also makes it possible to calculate the usage behavior with which a cluster made in the cloud can be more cost efficient than owning a cluster of the same size. We calculate this value as well for the clouds, expressing it as a number of days, after which using the cloud is more cost efficient than the cluster. A. System Cost Table V shows the cost per hour for one, two and four instances of the cloud solutions and the cluster. The value for the cluster was calculated as follows. We take into account the hardware cost for a machine and the power consumption during execution of the benchmarks. Considering a price of $12,000 and that the machine will be used for three years, we arrive at a hardware cost per hour of $12, 000 = $0.457 3 × 365 × 24 The average power consumption was measured being 275 W during execution of the benchmarks. Assuming a price of $0.0991 per kWh5 , the hourly cost is 275W × $0.0991 = $0.0273 The total cost per hour is therefore $0.484. We cannot measure the price for facilities and personnel and do not include it in the total price. 5 Average
price per kWh in the US (2010), from http://www.electricchoice. com/electricity-prices-by-state.php
TABLE V C OST ( IN D OLLAR / HOUR ) OF EACH SOLUTION . Parameter
EC2
Azure
Rackspace
Cluster
Cloud cost Hardware cost Power cost
0.66 – –
0.64 – –
1.80 – –
– 0.457 0.0273
Cost per node Cost for 2 nodes Cost for 4 nodes
0.66 1.32 2.64
0.64 1.28 2.56
1.80 3.60 7.20
0.484 0.968 1.936
To compare performance and price of cloud solutions and the cluster, we introduce two metrics which scale the performance with the price. The first one, which we call cost efficiency, is a value which represents the cost per hour of running equal work on various system. The second metric, the break even point, represents the number of days per year, after which execution on a cluster becomes cheaper than on the cloud. These metrics will be presented in the following sections. 1) Cost Efficiency: To calculate the cost efficiency of each solution, we need two values, the performance and the cost. It is necessary to normalize the performance results to take into account the different absolute execution times. We use the normalized average execution time from Section III-C and presented in percentage values in Table VI as the performance values and the cost from the last subsection. The cost efficiency is calculated as follows: Cost Efficiency = Average Performance × Cost per Hour This value represents the price per hour of performing the same work as the cluster in one hour. 2) Break Even Point: With the cost efficiency factor, it is possible to calculate the break even point for cloud usage. This factor is important, because even though the cluster might be more efficient for a continuous and full load, real world usage is less than that. Therefore, we define a point that represents the number of days of continuous usage, after which it becomes more cost efficient to use the cluster instead of the cloud. If the cluster is used for less days per year than the break even point, it is cheaper to use the cloud instead. To determine this point, it is necessary to calculate the cost of a cluster for a year and then divide this value by the cost efficiency factor and by 24 to obtain the value in days. The resulting formula is Break Even Point =
to obtain the number of days for the break even point. C. Results Here we show the results for cost efficiency and the break even point for our experiments. 1) Cost Efficiency: After calculating the price per hour and the cost efficiency for our experiments it was possible to determine which cloud provider has the best cost benefit and this data is useful to determine when to use cloud computing instead of a cluster. These results are shown in Table VI. We see that in most cases, the cluster runs the workloads more cost efficiently than the clouds. The single-node performance of the clouds is lower than the cluster, therefore the cost efficiency is lower as well. Scaling from one to two nodes
376
978-1-4673-4510-1/12/$31.00 ©2012 IEEE
Yearly Cost 24 × Cost Efficiency
2012 IEEE 4th International Conference on Cloud Computing Technology and Science TABLE VI C OST E FFICIENCY METRIC AND B REAK E VEN POINT. Parameter
EC2
Azure
Rackspace
Cluster
Normalized average execution time (%)
1 node 2 nodes 4 nodes
361.3 281.0 120.7
172.3 146.7 73.2
187.1 382.8 140.2
100.0 100.0 100.0
Cost efficiency (Dollar/hour)
1 node 2 nodes 4 nodes
2.39 3.71 3.19
1.10 1.89 1.14
3.37 13.78 10.09
0.484 0.968 1.936
Break Even Point (days)
1 node 2 nodes 4 nodes
74 96 222
161 187 620
53 26 71
– – –
does not increase the cloud performance significantly while doubling the price, and the cost efficiency decreases. However, with four nodes, all clouds improve their cost efficiency, and Azure starts to be more cost efficient than the cluster. In this case, Azure is about 41% more efficient, in other words, it costs 41% less to perform the same amount of work in the cloud than in the cluster. 2) Break Even Point: In our case the hourly cost of the cluster is $0.484 per node, which represents a yearly cost of $4,239.8 for a node. Table VI shows the values of the break even point obtained with our metric. The values show that for many use cases, all cloud solutions provide a viable alternative to owning a cluster. Even in the least efficient case, 26 days for Rackspace with two nodes, it is necessary to run the cluster with full load for about a month per year to benefit from the higher investment in machines. The other extreme case is running on Azure with four nodes, where the cloud is always more efficient than the cluster, even if the cluster is used with a full load for the entire year. Using these two metrics, Rackspace had the worst overall cost efficiency for all configurations, while Azure had the highest efficiency. However, as the performance evaluation showed, these results depend on the kind of application to be executed. For example, applications focusing on raw computation, such as EP, can perform more efficiently on EC2 or Rackspace. V. R ELATED W ORK We can divide the related work in this area in three groups: research on running HPC applications on cloud, performance evaluation of clouds, and migration of applications into the cloud. In this section, we will give a brief overview over this research and compare it to our work. Lu et al. [2] and Li et al. [11] evaluate the possibility of writing scientific applications to run on the Azure platform. They conclude that it is a viable solution for scientific applications that involve large data sets. They explore the features of the platform to write the applications. The article of Walker [5] evaluates the performance degradation of Amazon EC2 instances. He compares the performance of the NAS Parallel Benchmarks with their performance on a real machine and analyzes the network efficiency by executing the mpptest [12] MPI benchmark. Both computing and network performance proved to be challenges for the
Amazon EC2 solution. In this paper, we perform similar experiments, but we extended the comparison to Rackspace, Azure, Amazon and a cluster pointing to more aspects, as deployment, performance and cost-efficieny, trying to find the best cloud to run scientific applications. Deelman et al. [13] evaluate the cost of Amazon EC2 by porting a real-life astronomy application to the cloud and execute it using different resource provisioning plans. They conclude that the cloud is a cost-effective option since the scientific application provider does not need to buy an entire cluster for a few runs of the application. Many clusters are underused as the hardware quickly becomes obsolete. The cloud solves this problem as it is a responsibility of the cloud provider to keep upgrading the hardware and provide an upto-date service to the users. In our research, we compare EC2, Azure and Rackspace and evaluate the relation between cost and performance of both clouds in different aspects. The performance and performance variability of the EC2 cloud is evaluated by Jackson et al. [14], comparing the cloud system to real clusters by running several scientific applications. Their results show that performance degradation and variability of the EC2 are very high, citing the speed of the interconnections as a major problem. Ekanayake et al. [15] evaluate the performance of a new MapReduce implementation, CLG-MapReduce, and compare it to the existing implementations Hadoop and Dryad on cloud platforms. Furthermore, they compare the performance to a more traditional MPI implementation. Their results show that for various applications, CLG-MapReduce has a similar performance to MPI. However, almost all evaluated applications, such as the EP benchmark from NAS, have little or no communication between the threads. As communication is an important part of HPC applications, we evaluate a wider range of applications, with different amounts of communication and varying communication patterns. Li et al. [3] compare four commercial cloud providers: Amazon EC2, Windows Azure, Google AppEngine and Rackspace CloudServers. They measure the performance of several components of the cloud solutions, including computing, network, database and storage. They conclude that no cloud solution is best overall in terms of performance, but that each cloud excels in different areas. The focus of our work is the single instance performance, as it is the primary building block for larger HPC applications, but they don’t evaluate the performance using applications. As an example of migration of applications to the cloud, Ward et al. [16] study the automatic migration of commercial applications to the IBM cloud. They create a framework which automates many of the steps needed, and analyze the time and work savings compared to traditional server deployment. The IBM cloud and the studied applications are based on GNU/Linux, which simplifies the migration process. In contrast to the work presented here, our work focuses on evaluating major cloud providers as a platform for HPC and compare it to a traditional cluster solution. We evaluate the deployment process of HPC application to the cloud, also
377
978-1-4673-4510-1/12/$31.00 ©2012 IEEE
2012 IEEE 4th International Conference on Cloud Computing Technology and Science
deploy largely unmodified HPC applications to the clouds to measure the performance of ir, and introduce a metric to compare performance and cost of different cloud computing solutions. VI. C ONCLUSIONS AND F UTURE W ORK For the HPC community, the opportunity of using public cloud providers attracts attention. Cloud computing provides a way to eliminate the need to maintain permanent clusters or grids, so that users and developers can focus on the application and research side. Currently, there is a large number of public cloud providers, allowing users to choose the best provider for their needs. The question of which cloud provider is best for a certain application and usage scenario is very important for the successful deployment of HPC in the cloud. Additionally, it is necessary to compare the advantages and disadvantages of the cloud versus a traditional cluster. In this paper, we provided a comprehensive analysis of three important aspects of HPC in the cloud: deployment, performance and cost efficiency. We analyzed the procedures to create and manage an environment in the providers, and ran a set of well-know HPC benchmarks to evaluate their performance. Finally, we introduced a metric for the cost efficiency and calculated its value for each platform. This analysis was performed on three public cloud providers, Amazon Elastic Compute Cloud, Microsoft Windows Azure, and Rackspace, as well as a traditional cluster. With these results, we gained a more comprehensive understanding of when it is better to execute an HPC application in the cloud than on a cluster. Our analysis showed that the cloud can provide a viable platform for running HPC applications, despite some disadvantages in the deployment. For several benchmarks, the cloud providers had a higher performance and cost efficiency than the cluster, up to 27% and 41%, respectively. Furthermore, the performance scaled similarly to the cluster and had a low variability. Our results also showed that it is necessary to analyze the behavior of the target application, as well as the characteristics of the providers to choose the most appropriate provider. For the future, we will port complete HPC applications to the cloud. Also, we intend to extend the cost and efficiency metric to cover more factors and to be more flexible. ACKNOWLEDGMENT This work was partially supported by CNPq, FAPERGS, RNP and Microsoft.
R EFERENCES [1] D. Kondo, B. Javadi, P. Malecot, F. Cappello, and D. Anderson, “Cost-benefit analysis of cloud computing versus desktop grids,” in Parallel Distributed Processing, 2009. IPDPS 2009. IEEE International Symposium on, may 2009, pp. 1 –12. [2] W. Lu, J. Jackson, and R. Barga, “Azureblast: a case study of developing science applications on the cloud,” in Proceedings of the 19th ACM International Symposium on High Performance Distributed Computing, ser. HPDC ’10. New York, NY, USA: ACM, 2010, pp. 413–420. [Online]. Available: http://doi.acm.org/10.1145/1851476.1851537 [3] A. Li, X. Yang, S. Kandula, and M. Zhang, “Cloudcmp: comparing public cloud providers,” in Proceedings of the 10th annual conference on Internet measurement. ACM, 2010, pp. 1–14. [4] E. Roloff, F. Birck, M. Diener, A. Carissimi, and P. O. A. Navaux, “Evaluating High Performance Computing on the Windows Azure Platform,” in Proceedings of the 2012 IEEE 5th International Conference on Cloud Computing (CLOUD 2012), 2012, pp. 803–810. [5] E. Walker, “Benchmarking amazon ec2 for high-performance scientific computing,” Usenix Login, vol. 33, no. 5, pp. 18–23, 2008. [6] D. Bailey, T. Harris, W. Saphir, R. Van Der Wijngaart, A. Woo, and M. Yarrow, “The nas parallel benchmarks 2.0,” Technical Report NAS95-020, NASA Ames Research Center, Tech. Rep., 1995. [7] OpenMP Architecture Review Board, “OpenMP application program interface version 3.0,” May 2008. [Online]. Available: \url{http: //www.openmp.org/mp-documents/spec30.pdf} [8] M. Snir, S. W. Otto, S. Huss-Lederman, D. W. Walker, and J. Dongarra, MPI: The complete reference. Cambridge, MA: MIT Press, 1996. [9] P. Barham, B. Dragovic, K. Fraser, and S. Hand, “Xen and the art of virtualization,” ACM SIGOPS Operating Systems Review, vol. 37, no. 5, pp. 164–177, 2003. [Online]. Available: http: //dl.acm.org/citation.cfm?id=945462 [10] A. Velte and T. Velte, Microsoft Virtualization with Hyper-V, 1st ed. New York, NY, USA: McGraw-Hill, Inc., 2010. [11] J. Li, M. Humphrey, D. Agarwal, K. Jackson, C. van Ingen, and Y. Ryu, “escience in the cloud: A modis satellite data reprojection and reduction pipeline in the windows azure platform,” in Parallel Distributed Processing (IPDPS), 2010 IEEE International Symposium on, april 2010, pp. 1 –10. [12] W. Gropp, “Reproducible measurements of MPI performance characteristics,” Recent Advances in Parallel Virtual Machine and, 1999. [Online]. Available: http://www.springerlink.com/index/ PE2J40W56L9GM1Y9.pdf [13] E. Deelman, G. Singh, M. Livny, B. Berriman, and J. Good, “The cost of doing science on the cloud: The montage example,” in High Performance Computing, Networking, Storage and Analysis, 2008. SC 2008. International Conference for, nov. 2008, pp. 1 –12. [14] K. Jackson, L. Ramakrishnan, K. Muriki, S. Canon, S. Cholia, J. Shalf, H. Wasserman, and N. Wright, “Performance analysis of high performance computing applications on the amazon web services cloud,” in Cloud Computing Technology and Science (CloudCom), 2010 IEEE Second International Conference on, 30 2010-dec. 3 2010, pp. 159 –168. [15] J. Ekanayake and G. Fox, “High performance parallel computing with clouds and cloud technologies,” Cloud Computing, pp. 20–38, 2010. [16] C. Ward, N. Aravamudan, K. Bhattacharya, K. Cheng, R. Filepp, R. Kearney, B. Peterson, L. Shwartz, and C. Young, “Workload migration into clouds challenges, experiences, opportunities,” in Cloud Computing (CLOUD), 2010 IEEE 3rd International Conference on, july 2010, pp. 164 –171.
378
978-1-4673-4510-1/12/$31.00 ©2012 IEEE