International Journal of Grid and Distributed Computing Vol. 5, No. 1, March, 2012
High performance Grid computing for detecting gene-gene interactions in genome-wide association studies M. Ben Haj Hmida, Y. Slimani Department of Computer Science, Faculty of Sciences of Tunis, Tunisia
[email protected],
[email protected] Abstract The huge amount of biological information implies a great challenge for data analysis, particularly for combinatorial methods such as Multifactor Dimensionality Reduction. This method can be computationally intensive, especially when more than ten polymorphisms need to be evaluated. The Grid is a promising architecture for genomics problems providing high computing capabilities. In this paper, we describe a framework for supporting the MDR method on Grid environments. This framework helps biologists to automate the execution of multiple tests of gene-gene interactions detection. To evaluate the efficiency of the proposed framework, we conduct experiments on the Grid5000. A Grid infrastructure distributed in nine sites around France, for research in large-scale parallel and distributed systems. compute-intensive Keywords: Genomics, gene-gene interactions, distributed computing, grid computing environment.
1
Introduction
A grand challenge problem [18] refers to a computing problem that cannot be solved in a reasonable amount of time with conventional computers. Problems like eco-system simulations, genetic epidemiology or fluid dynamics can be considered of this kind. Such a kind of problems generates huge amount of data requiring large-scale computations using thousands of processors. Thus, solving Grand Challenge problems may require computational resources that exceed those that can be provided by a single organization. In consequence, Grid computing was proposed to address these computational problems enabling software applications to take advantage of widespread computational resources that are managed by diverse organizations in a secure and reliable way. In genetic epidemiology, genome-wide association studies have been designed to assess associations of millions of single nucleotide polymorphisms (SNPs) to find genetic variations associated to a particular disease. The huge amount of biological information implies a great challenge for data analysis, particularly for combinatorial methods such as Multifactor Dimensionality Reduction [14]. Multifactor Dimensionality Reduction (MDR) [14] is a non-parametric data mining approach for detecting and characterizing combinations of attributes or independent variables that interact to influence a dependent or class variable. The rationale behind this method is to identify the multilocus genotypes that best predict the outcome of interest. The MDR 33
1
International Journal of Grid and Distributed Computing Vol. 5, No. 1, March, 2012
approach aims to reduce the dimensionality of multilocus genotype space to facilitate the identification of gene-gene interactions. This method can be computationally intensive, especially when more than hundreds polymorphisms need to be evaluated. For example, an exhaustive evaluation of pairwise interactions between 5000 SNPs will produce more than one billion combinations. In such a situation, the computational horsepower of a single institution is not able to perform such large amount of computation. A promising solution to inhence computational power is to benefit from existing institutional shared resources. This solution is possible by Grid computing technologies. Grid computing is a computing architecture that provides capabilities for manipulating geographically distributed resources as a single meta-system. The Grid provides protocols and services to share computing resources, data and software managed by multiinstitutional Virtual Organizations (VO) [7]. Through VOs, grid computing aggregates heterogeneous resources that belong to different administrative domains and thus create a unique and valuable resource for the collaborating community. Grid services are provided by middleware systems such as Globus, Legion, gLite, and Unicore [7]. These middleware systems are meta-systems that run on top of existing operating systems and networks. The development of grid systems supporting genomics is needed to help biologists to address computational problems. The design of such systems has to take into account actual Grid standards like Web Service Resource Framework (WSRF) [6]. WSRF is a set of Web services specifications that describe the means by which a stateful resource is defined and associated with a Web services description, forming the overall type definition of a WS-Resource [17]. This paper describes a redesign of the architecture of a framework for supporting the MDR method on Grid environments and presents performance evaluations of the new framework. The remainder of the paper is organized as follows: the MDR method is briefly reviewed in section 2 and the grid-enabled MDR framework implementation is detailed in section 3. Section 4 provides some results obtained from executions of the framework on grid environments. Section 5 tries to compare our framework to related works. Finally, section 6 concludes the paper and presents future work..
2
Multifactor Dimensionality Reduction method
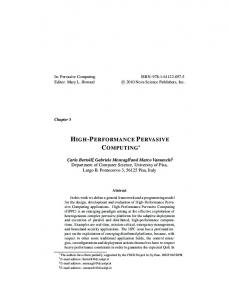
As defined by Moore in [12], there are four steps to detect, characterize, and interpret gene-gene interactions. The first step aims to identify the interesting attributes. This can be done by applying a filter using entropy-based measures of information gain and interaction. In the second step, the attributes can be ranked to choose the most interesting ones. Once interesting attributes are selected, they are combined to generate new attributes that capture interaction information. In the third, constructive induction methods, such as MDR, can be used. The MDR method creates a new dataset that can be processed on the third step. At this point, a variety of classification methods can be used. The chosen method has to construct a model that will be evaluated using the cross-validation method to limit false-positives [12]. And at the final step, the biologist can use the appropriate visual tool to interpret the final model. The MDR method can be summarized by the following data mining steps (as illustrated by figure 1) [2]: • Step 1: select all subsets of k explanatory variables among m available and for each 34
International Journal of Grid and Distributed Computing Vol. 5, No. 1, March, 2012
Figure 1. Summary of the four steps of the MDR method. subset k, enumerate all possible genotype combinations. These genotype combinations represent the interacting genes. • Step 2: For each combination, compute the case-control ratio and partition the multilocus genotypes into two subgroups labeled as high or low risk. This step reduces a k-dimensional model to one dimension only. • Step 3: a ten-fold cross-validation procedure is used to assess the ability of the multilocus genotype combinations to predict the disease outcome. The sample is divided into a training set (for example, 9/10 of cases and controls) and an independent test set (for example, 1/10 of cases and controls). For each subset of the data, the training set classification error is computed for each genotype combination. This step is repeated in the ten random subsets. The interaction with the lowest classification error (averaged over the ten random subsets) is selected as the ’best interaction’. The whole cross-validation procedure is itself repeated ten times in order to protect against chance division and all resulting statistics are averages over these ten runs. • Step 4: all interactions selected through steps 1 and 2 are also evaluated for their crossvalidation consistency (number of times the same genotype combination is identified across the ten repetitions of the cross-validation procedure) and testing accuracy. For each model size (i.e., number of SNPs combinations), the steps of the MDR method are repeated. The result is a set of models, one model for each considered size . From this set, the model with the combination of SNPs that maximizes the cross-validation consistency and minimizes the prediction error is selected. Since the development of epistatic software is considered as a challenge, Moore et al. [12] developed one of the most powerful softwares implementing the MDR software. This software is a user-friendly open source package written in Java and freely available from 35
International Journal of Grid and Distributed Computing Vol. 5, No. 1, March, 2012
www.epistasis.org. It offers a simple manner to execute the MDR method by automating the whole method. Unfortunately, its greatest limitation is the combinatorial nature of the method. Genetic datasets with hundreds of variables for each individual sample will quickly overwhelm MDR. Therefore, a scalable implementation of this computationally intensive method becomes essential in large-scale datasets. Distributed and parallel computing present potential approaches to address the computation challenge. Several efforts are done to develop parallel or distributed version of the MDR method. The pMDR software [3] supports parallel execution of the method among several nodes. But pMDR was developed for Linux and written in C++ using Message Passing Interface (MPI). However, it has no support for alternative platforms. A newer parallelization is proposed by Ma et al. [11] for processing single-locus and two-locus SNPs analyses on a high-performance computing cluster. This version also uses MPI and provides binaries for several processors type, MPI libraries and compilers. However, these implementations are developed for specific and expensive hardware, need consequent deployment efforts and lack of portability. While Graphics Processing Units (GPUs) systems provide cost effective performance compared to supercomputers, several works implemented the MDR method on GPUs [8, 15]. Despite these works achieved good performances, they require the users to well understand the GPU architecture to fully exploit the computation power of the GPU. Also, these works present implementations for specific GPUs which cannot be run on different architectures. To face the growing amount of biological data we need platform-independent softwares what grants their deployment on the largest number of computing nodes to achieve the highest scalability. So, we aim to develop a framework that supports intensive computing and provides platforms interoperability. We propose to use the Grid architecture as computing platform.
3 3.1
Implementation details Distributed formulation of the MDR method
The MDR method is directly applicable to the distributed scenario. Different models can be generated at different computing nodes, and then collected on a single node to select n! . the best models. Consider a dataset of n SNPs, the number of k-locus is Ckn = k!(n−k)! PN The analysis of more than two-locus, i.e. from 1-locus to N-locus, will produce k=1 Ckn multi-locus (SNPs combinations). A distributed scenario implies the split of this amount of multi-locus across all nodes to be processed in parallel. Given M computing nodes, a naive approach is to P distribute equal number of combinations to each node. Thus, each node N n k=1 Ck will calculate multi-locus combinations. Although, this distribution concerns M only the processor load and does not describe how to assign computation to each node. Algorithm 1 describes the manner to distribute k-locus analysis over M computing nodes considering SNPs number (n), minimum (min) and maximum (max) sizes of multi-locus combinations. In this algorithm, split[k] represents the number of nodes taking in charge multi-locus analysis of size k. For example, for 100 nodes, 100 SNPs, a minimum size of 1, and a maximum size of 4 we will assign the first node to one-locus and two-locus analysis, 4 nodes to 3-locus analysis, and 96 nodes to 4-locus analysis. Ultimately, the first node will 36
International Journal of Grid and Distributed Computing Vol. 5, No. 1, March, 2012
compute one-locus, two-locus and
1 4
of 3-locus combinations.
Input: M , n, min, max Output: multi-locus combinations assigned to each node Pmax Cn load = k=min k M for k = min to max do Ckn split[k] = load if split[k] == 0 then assign k-locus analysis to first node else Ckn work = split[k] for j = 0 to split[k] − 1 do assign combination(j ∗ work + 1, (j + 1) ∗ work) of k-locus analysis to next node end assign combination((split[s] − 1) ∗ work + 1, Ckn ) of k-locus analysis to next node end end Algorithm 1: Distribution of multi-locus analysis over M computing nodes. 3.2
Framework Architecture
The MDR framework [1] enables the execution of MDR method on a Grid environment. Based on Web services technology [6], it supports distributed execution of the MDR method leveraging the heterogeneity of Grid environments. The MDR framework is developed conforming to WSRF recommendations [6] to be deployed on top of the Globus middleware. Previous research activities on the MDR framework [1] have been focused on the development of a system prototype orchestrated by a load balancing module. This module spreads the combinations between lower level dispatching nodes or directly between computing nodes. It groups computing nodes into virtual clusters depending on their computing performances to manage intra-cluster and potentially inter-cluster load balancing. But we realized that the time consumed by the load balancing task is greater that the time it saves. Thereafter, we propose a redesign of the framework to achieve faster executions. As shown in Figure 2, the framework is now composed of only two node types: computing nodes, on which MDR method is executed; and user node, which provides a graphical interface allowing users to configure and execute a distributed MDR task on a Grid. User nodes are composed of a graphical interface, a data manager and an MDR client module. The graphical interface module allows the user to choose the dataset to analyze and set the parameters of the distributed MDR execution like the number of computing nodes, the minimum size and the maximum size of SNPs combinations. The data manager allows gathering the properties and metadata of the datasets stored on the Grid. After choosing the dataset to be analyzed, the user submits a distributed execution of an MDR process through the MDR client, which operates as an interface between the graphical interface and the dispatching module, which distributes computations among computing nodes by invoking the web services residing on those nodes. If needed, the data manager 37
International Journal of Grid and Distributed Computing Vol. 5, No. 1, March, 2012
Figure 2. Web Services interactions between a client and the Grid-enabled MDR framework. transfers the dataset to computing nodes. A computing node is composed of an MDR module, which consists on an extended version of the MDR software [12]. The MDR Service exports the MDR module through a Web service. Computing nodes also have an FTP server allowing datasets transfer to be locally analyzed by the MDR module.
4
Empirical experiments
To evaluate the effectiveness of the distributed MDR method, it is necessary to identify metrics that are quantifiable and can be easily measured. These metrics help determine the value of the framework and its strengths and weaknesses. We use running time and efficiency as evaluation criteria. In these experiments, we used simulated benchmark dataset containing 16000 individuals and 100 SNPs. The performance evaluations were conducted on Grid5000 [4], a dedicated reconfigurable and controllable experimental platform featuring 13 clusters, each with 58 to 342 PCs, interconnected through Renater (the French Educational and Research wide area Network). It gathers roughly 5000 CPU cores featuring four architectures (Itanium, Xeon, G5 and Opteron) distributed into 13 clusters over 9 cities in France (Bordeaux, Grenoble, Lille, Lyon, Nancy, Orsay, Rennes, Sophia- Antipolis, and Toulouse). Our evaluations were done on Orsay and Bordeaux clusters. They are bi-processors machines composed of AMD Opteron at 2.0GHz (Orsay) and 2.6GHz (Bordeaux) with 2GB (Orsay) and 4GB (Bordeaux) of memory, interconnected by a 1Gb/s Ethernet network. We 38
International Journal of Grid and Distributed Computing Vol. 5, No. 1, March, 2012
Table 1. Performance measures of the MDR framework # Nodes
Running time (sec.)
1 100 200 300 390
108494 1103 578 402 341
Speed-up
Efficiency
98.36 187.71 269.89 318.16
0.98 0.94 0.90 0.82
achieved several experiments, by varying the number of nodes from 100 to 400 and fixing the minimum (min) and maximum (max) sizes of multi-locus combinations to respectively 1 and 4. To evaluate the performance of our framework we measured the sped-up and efficiency achieved compared to sequential execution of the original MDR software [12]. These measures are reported in table 1. The experiment result shows that the execution time for processing 100 SNPs in a single processor (by original MDR software) exceeds 30 hours. Although, the proposed framework reduces this time and makes it rational when hundreds of processors are used. From table 1, we can sight that our framework has almost linear speed up when increasing the number of computing nodes which shows that the distribution proposed in Algorithm 1 is nearly load balanced. 1200 1100
Execution Time (Secs)
1000 900 800 700 600 500 400 300 100
150
200
250 Number of Nodes
300
350
400
Figure 3. Running time of the MDR framework. Figure 3 depicts the running time obtained from executing the distributed version of the MDR method by our framework on different amount of nodes. It shows that, for an increasing number of nodes, the execution time decreases proportionally. For example, the execution time on 300 nodes (402 sec) is 2.75 times faster than the execution time on 100 nodes (1103 sec) and 1.4 times faster than 200 nodes (578 sec). Figure 4 displays the efficiency of the proposed framework. Despite the efficiency decreases by increasing the number of nodes, it still remains above 0.8 which represents a high performance. We achieved this good efficiency because the MDR method is highly parallel and our distributed version involves only two synchronization stages during the distributed 39
International Journal of Grid and Distributed Computing Vol. 5, No. 1, March, 2012
1 0.98 0.96
Efficiency
0.94 0.92 0.9 0.88 0.86 0.84 0.82 0.8 100
150
200
250 Number of Nodes
300
350
400
Figure 4. Efficiency of the MDR framework. execution. In the first stage, remote web services are invoked for each computing node. And in the second stage, the resulting models are transferred to the client node which aggregates them to produce the final model. To understand the origin of the efficiency decrease, Figure 5 shows the percentage of the execution times of the overhead introduced by the WSRF mechanisms (WSRF overhead), the distributed part (MDR computation), and the sequential part (results transfer and aggregation) of the distributed MDR method with respect to the total execution time. The WSRF mechanisms covers resource creation, notification subscription, task submission, results notification, and resource destruction. As shown in Figure 5, MDR computation represents 98% of the total execution time on 100 nodes, whereas it represents 81% of the total execution time on 390 nodes. At the same time, the results transfer and aggregation ranges from 1.47% to 16.42%, and the WSRF overhead range from 0.53% to 2.64%. We can observe that neither the results transfer and aggregation nor the WSRF overhead represent a significant overhead with respect to the total execution time. We also observe that the percentages of these overheads with respect to the total execution time increase with the increasing number of nodes. Indeed, results transfer and aggregation takes 16 seconds on 100 nodes and 56 seconds on 390 nodes, whereas WSRF overhead takes 6 seconds on 100 nodes and 9 seconds on 390 nodes. Therefore, we conclude that WSRF overhead is slightly affected by the increasing the number of nodes but still marginal compared to the total execution time. The conclusion to be drawn from the performance analysis discussed above is that WSRF mechanisms provided us to develop a compute-intensive framework for large data analysis with good efficiency and scalability properties.
5
Related works
Even if there is no works, in our knowledge, that face directly the MDR problem, there are some efforts that consider the execution of time-consuming Data Mining processes. Some of the projects like GridWeka [10], WekaG [13], and Weka4WS [16] aimed to adapt 40
International Journal of Grid and Distributed Computing Vol. 5, No. 1, March, 2012
Figure 5. Execution times percentages of the different steps of the Grid-enabled MDR framework. the Weka toolkit to a grid environment. Other works like those of Halling-Brown aim to develop a unified interface to access a large set of computational resources [9]. GridWeka [10] is an ongoing work at the University of Dublin, which distributes classification algorithms using the cross-validation method over computers in an ad- hoc Grid. The system is composed by two main components: Weka Server and Weka Client. Each participating machine runs the original Weka as server component. The Weka client allows users to specify the target algorithms and datasets, and also to specify resources and tasks constraints. Another system using the client server architecture is WekaG [13]. The WekaG server implements data mining algorithms while the client side instantiates grid services. WekaG is an implementation of a more general architecture called Data Mining Grid Architecture (DMGA) based on Weka and Globus Toolkit 4. DMGA provides the composition of services on workflows. WekaG provides the same user interface as Weka and can support parallel algorithms. Weka4WS [16] is framework that extends the open-source Weka toolkit (Weka) to support distributed data mining in Grid environments. Weka4WS also extends the Weka GUI to enable the invocation of the data mining algorithms that are exposed as Web Services on remote machines. Weka4WS uses the Web Services Resource Framework (WSRF) [6] to ensure interoperability with standard Grid environments such as Globus Toolkit 4. The architecture of Weka4WS includes three kinds of nodes: • storage nodes, which contain the datasets to be mined; • compute nodes, on which remote data mining algorithms are run; • user nodes, which are the local machines of users. Remote execution is managed using basic WSRF mechanisms (state management, notifications, etc.), while the Globus Toolkit 4 services are used for standard Grid functionalities, 41
International Journal of Grid and Distributed Computing Vol. 5, No. 1, March, 2012
such as security and file transfer. As part of the European Union ImmunoGrid (http://www.immunogrid.eu) project whose aim is to develop simulations of the immune system at the molecular, cellular and organ levels, Halling-Brown et al. developed a lightweight generic framework for combining disparate computational resources at the ImmunoGrid partners sites [9]. This framework offers a Web interface to hide the underlying middleware and resources from the user. This interface is coupled to a resource broker which is responsible of submitting jobs on the grid resources via the different underlying middlewares. the framework allows also a direct usage of resources using Web Services. GridWeka and WekaG tried to adopt Weka to a Grid infrastructure using the client server architecture. But this architecture is not so flexible and powerful to support large scale requirements such as security, resource management etc. By contrast, Weka4WS and our framework are based on a Web services approach that makes them more adapted to run on a grid architecture. The Halling-Brown work builds an upper middleware that hides much of the complexity of the grid both from developers of a new grid infrastructure and from the users of that infrastructure. Therefore it concentrates on providing a generic framework for running biological application more than developing or porting a specific method or tool to the grid. While all these projects are based on grid technologies and provide remote and concurrent execution, they do not support execution on large number of nodes. Contrariwise, our framework presents good efficiency and scalability around 400 nodes.
6
Conclusion
We proposed a framework based on WSRF technology for the distributed execution of the MDR approach on a Grid environment. This framework architecture is redesigned according to the MDR execution scheme and composed of only two types of nodes to achieve more efficiency. Compared to other MDR frameworks, we provide a larger computing capabilities. Based on WSRF technology, our framework is open and extensible. It is open thanks to the use of web services which use standard protocols. Furthermore it is extensible since it integrates existing or new methods and softwares by exporting them as Web services. This framework is suitable for distributed execution on large scale platforms by avoiding communication overheads and frequent synchronization which present the bottle neck for parallel and distributed applications. Experimentations were conducted on the Grid5000 [4] experimental platform which indicated good efficiency and scalability around 400 computing nodes. As perspective of our work, we think that it would be interesting to experiment our framework in real datasets. We also intend to make more experimentation with larger number of nodes and datasets sizes.
Acknowledgements Experiments presented in this paper were carried out using the Grid’5000 experimental testbed, being developed under the INRIA ALADDIN development action with support 42
International Journal of Grid and Distributed Computing Vol. 5, No. 1, March, 2012
from CNRS, RENATER, CPER Nord-Pas-de-Calais/FEDER Campus Intelligence Ambiante, several Universities as well as other funding bodies (see https://www.grid5000.fr).
References [1] M. Ben Haj Hmida and Y. Slimani, Grid-Enabled Framework for Large-Scale Analysis of Gene-Gene Interactions. Communications in Computer and Information Science, 162, 3, pp.348-357, (2011) [2] L. Briollais, Y. Wang, I. Rajendram, V. Onay, E. Shi, J. Knight, and H. Ozcelik, Methodological issues in detecting gene-gene interactions in breast cancer susceptibility: a population-based study in Ontario. BMC Med. 5, 22 (2007) [3] W. S.Bush, S. M. Dudek, and M. D. Ritchie, Parallel multifactor dimensionality reduction: a tool for the large-scale analysis of gene-gene interactions. Bioinformatics. 17, pp.2173-2174 (2006) [4] F. Cappello, E. Caron, M. Dayde, F. Desprez, Y. Jegou, P. Vicat-Blanc Primet, E. Jeannot, S. Lanteri, J. Leduc, N. Melab, G. Mornet, B. Quetier, and O. Richard, Grid5000: a large scale and highly reconfigurable grid experimental testbed. Proceedings of the 6th IEEE/ACM International Workshop on Grid Computing, (2005) November 13-14; San Diego, CA, USA, pp.99-106 [5] E. Christensen, F. Curbera, G. Meredith, and S. Weerawarana, Web Services Description Language (WSDL) 1.1, W3C Note 15 March 2001. [6] K. Czajkowski, The WS-Resource Framework Version 1.0, 2004. http://www106.ibm.com/developerworks/library/ws-resource/ws-wsrf.pdf. [7] I. Foster and C. Kesselman, The Grid: Blueprint for a New Computing Infrastructure. Morgan Kaufmann, San Francisco (1999) [8] C. Greene, N. A. Sinnott-Armstrong, D. S. Himmelstein, P. J. Park, J. H. Moore, and B. T. Harris, Multifactor dimensionality reduction for graphics processing units enables geneome-wide testing of epistasis in sporadic ALS. Bioinformatics, 26, pp.694-695 (2010) [9] M. D. Halling-Brown, D. S. Moss, C. E. Sansom, and A. J. Shepherd, A computational Grid framework for immunological applications. Phil. Trans. R. Soc. A. 367, pp. 27052716 (2009) [10] R. Khoussainov, X. Zuo, and N. Kushmerick, Grid-enabledweka: A toolkit for machine learning on the grid. ERCIM News, No. 59 (2004) [11] L. Ma, H. B. Runesha, D. Dvorkin, J. R. Garbe, and Y. Da, Parallel and serial computing tools for testing single-locus and epistatic SNP effects of quantitative traits in genome-wide association studies. BMC Bioinformatics, 9, 315 (2008) [12] J. H. Moore, J. C. Gilbert, C-T. Tsai, F. T. Chiang, W. Holden, N. Barney, and B. C. White, A flexible computational framework for detecting, characterizing, and interpreting statistical patterns of epistasis in genetic studies of human disease susceptibility. Journal of Theoretical Biology. 241, pp.252-261 (2006) [13] M. S. P`erez, A. S`anchez, P. Herrero, V. Robles, and J. M. Pena. Adapting the weka data mining toolkit to a grid based environment. Proceedings of the 3rd Atlantic Web Intelligence Conference, (2005) June 6-9; Lodz, Poland, pp.492-497 43
International Journal of Grid and Distributed Computing Vol. 5, No. 1, March, 2012
[14] M. D. Ritchie, L. W. Hahn, N. Roodi, L. R Bailey, W. D. Dupont, F. F. Parl, and J. H. Moore, Multifactor-dimensionality reduction reveals highorder interactions among estrogen metabolism genes in sporadic breast cancer. American Journal of Human Genetics. 69, pp.138-147 (2001) [15] N. A. Sinnott-Armstrong, C. S. Greene, F. Cancare, and J. H. Moore, Accelerating epistasis analysis in human genetics with consumer graphics hardware. BMC Res. Notes 2, 149 (2009) [16] D. Talia, P. Trunfio, and O. Verta. Weka4WS: A WSRF-Enabled Weka Toolkit for Distributed Data Mining on Grids. Proceedings of the 9th European Conference on Principles and Practice of Knowledge Discovery in Databases, (2005) October 3-7; Porto, Portugal, pp.309-320 [17] S. Tuecke, K. Czajkowski, I. Foster, J. Frey, S. Graham, C. Kesselman, T. Maguire, T. Sandholm, P. Vanderbilt, and D. Snelling, Open Grid Services Infrastructure (OGSI) Version 1.0, Global Grid Forum Draft Recommendation (2002) [18] B. W. Wah, Report on Workshop on High Performance Computing and Communications for Grand Challenge Applications: Computer Vision, Speech and Natural Language Processing, and Artificial Intelligence. IEEE Trans. Knowl. Data Eng. 5, 1, pp.138-154 (1993) [19] I. H. Witten and E. Frank, Data Mining: Practical machine learning tools and techniques. 2nd Edition, Morgan Kaufmann, San Francisco (2005) Authors Moez Ben Haj Hmida received his Master in Computer Science from the University of Tunis El Manar, Tunisa, in 2005. He is currently pursuing his PhD in Computer Science at the same university. He is currently a Lecturer at the Institute of Applied Sciences and Technology of Sousse, Tunisia. His current research interests include parallel, distributed and grid-based data mining applications. Yahya Slimani received his BSc (Eng.), DEng and PhD from the Computer Science Institute of Alger’s (Algeria), University of Lille (France) and University of Oran (Algeria), in 1973, 1986 and 1993, respectively. He is currently a Professor at the Department of Computer Science, Faculty of Sciences of Tunis. His research activities concern data mining, parallelism, distributed systems and grid computing. He has published more than 120 papers from 1986 to 2008 and has contributed to Parallel and Distributed Computing Handbook, McGraw-Hill, 1996. He also joined the Editorial Board of the Information International Journal in 2000 and the J.UCS in 2005.
44