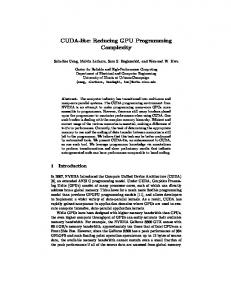
It's 93% of GPU compute time, but only 36% of total time. What's going on during
that other ~60% of time? Maybe it's one-time startup overhead not worth looking ...
High-Productivity CUDA Programming Cliff Woolley, Sr. Developer Technology Engineer, NVIDIA
HIGH-PRODUCTIVITY PROGRAMMING
© NVIDIA 2013
High-Productivity Programming What does this mean? What’s the goal? Do Less Work (Expend Less Effort) Get Information Faster Make Fewer Mistakes
© NVIDIA 2013
High-Productivity Programming Do Less Work (Expend Less Effort) Use a specialized programming language Reuse existing code
Get Information Faster Make Fewer Mistakes
© NVIDIA 2013
High-Productivity Programming Do Less Work (Expend Less Effort) Get Information Faster Debugging and profiling tools Rapid links to documentation Code outlining Type introspection/reflection
Make Fewer Mistakes
© NVIDIA 2013
High-Productivity Programming Do Less Work (Expend Less Effort) Get Information Faster Make Fewer Mistakes Syntax highlighting Code completion Type checking Correctness checking
© NVIDIA 2013
High-Productivity Programming What kinds of tools exist to meet those goals? Specialized programming languages, smart compilers Libraries of common routines Integrated development environments (IDEs) Profiling, correctness-checking, and debugging tools
© NVIDIA 2013
HIGH-PRODUCTIVITY CUDA PROGRAMMING © NVIDIA 2013
High-Productivity CUDA Programming What’s the goal? Port existing code quickly Develop new code quickly Debug and tune code quickly …Leveraging as many tools as possible
This is really the same thing as before! © NVIDIA 2013
High-Productivity CUDA Programming What kinds of tools exist to meet those goals? Specialized programming languages, smart compilers Libraries of common routines Integrated development environments (IDEs) Profiling, correctness-checking, and debugging tools
© NVIDIA 2013
HIGH-PRODUCTIVITY CUDA: Programming Languages, Compilers © NVIDIA 2013
GPU Programming Languages Numerical analytics
Fortran C
C++ Python .NET
MATLAB, Mathematica, LabVIEW
OpenACC, CUDA Fortran OpenACC, CUDA C
CUDA C++, Thrust, Hemi, ArrayFire Anaconda Accelerate, PyCUDA, Copperhead
CUDAfy.NET, Alea.cuBase developer.nvidia.com/language-solutions
© NVIDIA 2013
Opening the CUDA Platform with LLVM CUDA C, C++, Fortran
New Language Support
CUDA compiler source contributed to open source LLVM compiler project LLVM Compiler For CUDA
SDK includes specification documentation, examples, and verifier Anyone can add CUDA support to new languages and processors
NVIDIA GPUs
x86 CPUs
New Processor Support
Learn more at developer.nvidia.com/cuda-llvm-compiler © NVIDIA 2013
HIGH-PRODUCTIVITY CUDA: GPU-Accelerated Libraries © NVIDIA 2013
GPU Accelerated Libraries
“Drop-in” Acceleration for your Applications
NVIDIA cuBLAS
Matrix Algebra on GPU and Multicore
IMSL Library
NVIDIA cuSPARSE
NVIDIA NPP
NVIDIA cuFFT
GPU Accelerated Linear Algebra
Vector Signal Image Processing
NVIDIA cuRAND
CenterSpace NMath
Building-block Algorithms
C++ Templated Parallel Algorithms
© NVIDIA 2013
HIGH-PRODUCTIVITY CUDA: Integrated Development Environments © NVIDIA 2013
®
, Eclipse Edition NVIDIA Nsight™
for Linux and MacOS
CUDA-Aware Editor Automated CPU to GPU code refactoring Semantic highlighting of CUDA code Integrated code samples & docs
developer.nvidia.com/nsight
Nsight Debugger Simultaneously debug CPU and GPU Inspect variables across CUDA threads Use breakpoints & single-step debugging
Nsight Profiler Quickly identifies performance issues Integrated expert system Source line correlation
© NVIDIA 2013
NVIDIA® Nsight™ , Visual Studio Edition
CUDA Debugger Debug CUDA kernels directly on GPU hardware Examine thousands of threads executing in parallel Use on-target conditional breakpoints to locate errors
CUDA Memory Checker Enables precise error detection
System Trace Review CUDA activities across CPU and GPU Perform deep kernel analysis to detect factors limiting maximum performance
CUDA Profiler Advanced experiments to measure memory utilization, instruction throughput and stalls © NVIDIA 2013
HIGH-PRODUCTIVITY CUDA: Profiling and Debugging Tools © NVIDIA 2013
Debugging Solutions Command Line to Cluster-Wide
NVIDIA Nsight Eclipse & Visual Studio Editions
NVIDIA CUDA-GDB for Linux & Mac
Allinea DDT with CUDA Distributed Debugging Tool
developer.nvidia.com/debugging-solutions
NVIDIA CUDA-MEMCHECK for Linux & Mac
TotalView for CUDA for Linux Clusters
© NVIDIA 2013
Performance Analysis Tools Single Node to Hybrid Cluster Solutions
NVIDIA Nsight Eclipse & Visual Studio Editions
NVIDIA Visual Profiler
Vampir Trace Collector
TAU Performance System
PAPI CUDA Component
Under Development
developer.nvidia.com/performance-analysis-tools
© NVIDIA 2013
Want to know more? Visit DeveloperZone
developer.nvidia.com/cuda-tools-ecosystem © NVIDIA 2013
High-Productivity CUDA Programming Know the tools at our disposal Use them wisely Develop systematically
© NVIDIA 2013
SYSTEMATIC CUDA DEVELOPMENT
© NVIDIA 2013
APOD: A Systematic Path to Performance Assess
Deploy
Parallelize
Optimize © NVIDIA 2013
Assess
HOTSPOTS
Profile the code, find the hotspot(s) Focus your attention where it will give the most benefit © NVIDIA 2013
Parallelize
Applications
Libraries
OpenACC Directives
Programming Languages
© NVIDIA 2013
Optimize Profile-driven optimization Tools: nsight NVIDIA Nsight IDE nvvp NVIDIA Visual Profiler nvprof Command-line profiling
© NVIDIA 2013
Deploy
Productize
Check API return values Run cuda-memcheck tools
Library distribution Cluster management
Early gains Subsequent changes are evolutionary © NVIDIA 2013
Assess
Deploy
Parallelize
Optimize
SYSTEMATIC CUDA DEVELOPMENT APOD Case Study © NVIDIA 2013
Assess
Deploy
1
Parallelize
Optimize
APOD CASE STUDY Round 1: Assess © NVIDIA 2013
Assess
Assess
Deploy
1
Parallelize
Optimize
Profile the code, find the hotspot(s) Focus your attention where it will give the most benefit © NVIDIA 2013
Assess
Assess
Deploy
1
Parallelize
Optimize
We’ve found a hotspot to work on! What percent of our total time does this represent? How much can we improve it? What is the “speed of light”?
© NVIDIA 2013
Assess
Assess
Deploy
1
Parallelize
Optimize
~36%?
~93%
What percent of total time does our hotspot represent? © NVIDIA 2013
Assess
Assess
1
Deploy
Parallelize
Optimize
We’ve found a hotspot to work on! It’s 93% of GPU compute time, but only 36% of total time
What’s going on during that other ~60% of time? Maybe it’s one-time startup overhead not worth looking at Or maybe it’s significant – we should check
© NVIDIA 2013
Assess
Assess: Asynchronicity
Deploy
1
Parallelize
Optimize
This is the kind of case we would be concerned about Found the top kernel, but the GPU is mostly idle – that is our bottleneck Need to overlap CPU/GPU computation and PCIe transfers
© NVIDIA 2013
Asynchronicity = Overlap = Parallelism DMA
DMA
Heterogeneous system: overlap work and data movement Kepler/CUDA 5: Hyper-Q and CPU Callbacks make this fairly easy © NVIDIA 2013
Assess
Deploy
1
Parallelize
Optimize
APOD CASE STUDY Round 1: Parallelize © NVIDIA 2013
Assess
Parallelize: Achieve Asynchronicity
Deploy
1
Parallelize
Optimize
What we want to see is maximum overlap of all engines How to achieve it? Use the CUDA APIs for asynchronous copies, stream callbacks Or use CUDA Proxy and multiple tasks/node to approximate this © NVIDIA 2013
Assess
Parallelize Further or Move On?
Deploy
1
Parallelize
Optimize
Even after we fixed overlap, we still have some pipeline bubbles CPU time per iteration is the limiting factor here So our next step should be to parallelize more
© NVIDIA 2013
Assess
Parallelize Further or Move On?
Deploy
1
Parallelize
Optimize
Here’s what we know so far: We found the (by far) top kernel But we also found that GPU was idle most of the time We fixed this by making CPU/GPU/memcpy work asynchronous We’ll need to parallelize more (CPU work is the new bottleneck) …And that’s before we even think about optimizing the top kernel
But we’ve already sped up the app by a significant margin! Skip ahead to Deploy. © NVIDIA 2013
Assess
Deploy
1
Parallelize
Optimize
APOD CASE STUDY Round 1: Deploy © NVIDIA 2013
Assess
Deploy
Deploy
1
Parallelize
Optimize
We’ve already sped up our app by a large margin Functionality remains the same as before We’re just keeping as many units busy at once as we can
Let’s reap the benefits of this sooner rather than later! Subsequent changes will continue to be evolutionary rather than revolutionary
© NVIDIA 2013
Assess
Deploy
2
Parallelize
Optimize
APOD CASE STUDY Round 2: Assess © NVIDIA 2013
Assess
Assess
Deploy
2
Parallelize
Optimize
Our first round already gave us a glimpse at what’s next: CPU compute time is now dominating No matter how well we tune our kernels or reduce our PCIe traffic at this point, it won’t reduce total time even a little © NVIDIA 2013
Assess
Assess
Deploy
2
Parallelize
Optimize
We need to tune our CPU code somehow Maybe that part was never the bottleneck before and just needs to be cleaned up Or maybe it could benefit by further improving asynchronicity (use idle CPU cores, if any; or if it’s MPI traffic, focus on that) We could attempt to vectorize this code if it’s not already This may come down to offloading more work to the GPU If so, which approach will work best?
Notice that these basically say “parallelize” © NVIDIA 2013
Assess
Assess: Offloading Work to GPU
Deploy
2
Parallelize
Optimize
Applications
Libraries
OpenACC Directives
Programming Languages
Pick the best tool for the job © NVIDIA 2013
Assess
Deploy
2
Parallelize
Optimize
APOD CASE STUDY Round 2: Parallelize © NVIDIA 2013
Assess
Parallelize: e.g., with OpenACC CPU
2
Deploy
Parallelize
Optimize
GPU
Simple Compiler hints Program myscience ... serial code ... !$acc kernels do k = 1,n1 do i = 1,n2 ... parallel code ... enddo enddo !$acc end kernels ... End Program myscience
Your original Fortran or C code
Compiler Parallelizes code OpenACC Compiler Hint
Works on many-core GPUs & multicore CPUs
www.nvidia.com/gpudirectives
© NVIDIA 2013
Assess
Parallelize: e.g., with Thrust
Deploy
2
Parallelize
Optimize
Similar to C++ STL High-level interface Enhances developer productivity Enables performance portability between GPUs and multicore CPUs Flexible Backends for CUDA, OpenMP, TBB Extensible and customizable Integrates with existing software Open source
// generate 32M random numbers on host thrust::host_vector h_vec(32