Mar 3, 2006 - We discuss offline and online fiducialization issues in Sec. ... (iii) Convert the measured beam size as the alignment accuracy of ..... The resolution of the PSD is often a small fraction of the ...... pubs/slacreports/slac-r-593.html.
PHYSICAL REVIEW SPECIAL TOPICS - ACCELERATORS AND BEAMS 9, 030701 (2006)
High-resolution accelerator alignment using x-ray optics Bingxin Yang and Horst Friedsam Advanced Photon Source, Argonne National Laboratory, Argonne, Illinois 60439, USA (Received 21 December 2005; published 3 March 2006) We propose a novel alignment technique utilizing the x-ray beam of an undulator in conjunction with pinholes and position-sensitive detectors for positioning components of the accelerator, undulator, and beam line in an x-ray free-electron laser. Two retractable pinholes at each end of the undulator define a stable and reproducible x-ray beam axis (XBA). Targets are precisely positioned on the XBA using a pinhole camera technique. Position-sensitive detectors responding to both x-ray and electron beams enable direct transfer of the position setting from the XBA to the electron beam. This system has the potential to deliver superior alignment accuracy (1–3 �m) for target pinholes in the transverse directions over a long distance (200 m or longer). It can be used to define the beam axis of the electron-beam –based alignment, enabling high reproducibility of the latter. This x-ray–based concept should complement the electron-beam –based alignment and the existing survey methods to raise the alignment accuracy of long accelerators to an unprecedented level. Further improvement of the transverse accuracy using x-ray zone plates will be discussed. We also propose a concurrent measurement scheme during accelerator operation to allow real-time feedback for transverse position correction. DOI: 10.1103/PhysRevSTAB.9.030701
PACS numbers: 41.60.Cr, 29.17.+w, 41.50.+h, 41.75.Lx
I. INTRODUCTION Several large-scale linear accelerator projects are under construction or have been proposed. The Linear Coherent Light Source (LCLS) utilizes parts of the existing linear accelerator at SLAC followed by a 130-m-long undulator section with a 6.8-mm fixed gap [1]. DESY is planning to build an x-ray free-electron laser (XFEL) with a total length on the order of 3.3 km for multiple undulator sections of which the longest is about 300 m [2]. The gap in this device varies from 6 to 20 mm depending on the undulator type utilized in each of the beam lines. A proposal by SPring-8 to establish the SCSS will use a 1-GeV, 55-m-long accelerator followed by a 22.5-m-long invacuum undulator section with a 3.7-mm gap [3]. Last, but not least, PAL at POSTECH in South Korea is proposing the PAL/XFEL with a 60-m in-vacuum variable-gap undulator with a minimum gap of 3 mm [4]. Finally, the International Linear Collider (ILC) project now being developed in a global design effort will need highprecision alignment of accelerating and diagnostics components over distances of 10 –20 km [5,6]. All of these projects require precision alignment of beam line components at unprecedented accuracy, including the vacuum chambers. In the LCLS, for example, many undulator components need to be aligned to better than 20 �m from a straight line designated to be the beam axis. Using modern survey technology one can establish a control reference system with point accuracies of �150 to �300 �m depending on the size of the object. In long stretched objects such as linear accelerators or freeelectron lasers (FELs), large-scale deviations due to the accumulation of small remaining systematic instrument errors and environmental effects can even exceed these tolerances and directly affect the positioning of the 1098-4402=06=9(3)=030701(17)
XFEL components. State-of-the art hydrostatic level sensors deliver an accuracy of �5 �m in the vertical direction and wire position sensors (WPSs) are under development providing an accuracy of �1:5 �m only in the horizontal plane due to uncertainties in the wire sag. With these instruments it is possible to achieve relative alignment tolerances on the order of �25 �m or better when considering transfer errors from the monitors to the beam components [7]. However, the accuracy of these devices is limited by the length of the object to be measured and on-axis alignment is not possible. Minimizing the transfer error becomes even more difficult since two separate systems are required to position and monitor vertical and horizontal deviations. In 1968 Herrmannsfeldt and others proposed and implemented a precision straight-line alignment system utilizing Fresnel lenses for the 3-km-long Stanford linear accelerator [8]. The system uses a HeNe laser light source, a detector, and rectangular Fresnel lenses with distancedependent focal lengths to project the source onto the detector. The accelerator is supported by 12-m-long linked girders with an integrated strongback for the accelerating structures and a 60 cm –diameter light pipe for the alignment system. At each girder link a Fresnel lens can be inserted into the light beam creating a diffraction pattern at the detector. Deviations relative to an initial straight-line setup using a well-defined Fresnel target and the detector zero position can be measured. Moving the strongback support with the Fresnel lens to the zero position, any link can be placed on axis and with that the accelerating structure. The estimated transverse accuracy of this system is on the order of �25 �m over the length of the accelerator, without considering the transfer error from the alignment system to the actual beam axes.
030701-1
© 2006 The American Physical Society
BINGXIN YANG AND HORST FRIEDSAM
Phys. Rev. ST Accel. Beams 9, 030701 (2006)
A similar system was proposed in 1990 by Griffith and his colleagues for the construction of an FEL at Lawrence Livermore Laboratory [9,10]. This concept uses the Poisson spot created as a diffraction pattern by an opaque sphere substituting for a Fresnel lens to align the accelerator. It includes an elaborate feedback system to maintain the pointing direction of an expanded light beam and eliminates the need for inserting and removing reference targets as required in the SLAC design, as many spheres can occupy the cross section of the light beam. This system was designed to provide transverse positioning on the order of �25 �m over a 300-m-long FEL. In order to overcome these limits in survey accuracy, the electron-beam –based alignment (EBBA) technique was developed in the last decade to align magnetic quadrupoles and sextupoles. When an electron-beam trajectory deviates from the centers of these magnets, it experiences a transverse kick. Since the strength of the kick depends on the strength of the magnets and the beam energy, the trajectory deviations in the magnets can be detected by monitoring the downstream beam position monitors (BPMs) while varying the strength of the magnet or electron energy. Through an iterative procedure of correcting magnet positioning errors and measuring the BPM signal, the EBBA technique can now attain micron-level accuracy under ideal conditions [11,12]. However, this technique is sensitive to the presence of a dipole field that cannot be turned off during the alignment process. Even the Earth’s field can adversely affect the outcome. Finally, since no fixed monument is used to define the electron-beam axis (EBA), it is not predetermined to what line the final convergence will lead. Hence the EBA cannot be accurately reproduced after magnets are moved. Similar to many previous authors, we also prefer the optical technique since photons travel in straight lines invacuum and in the magnetic field, with their trajectory curving less than 1 prad=km as a result of Earth’s gravity. However the previous techniques have two major drawbacks. First, the diffraction p������ of a visible light beam requires large apertures R � �- S over a long working distance S [13], where �- � �=2� is given by the wavelength � of the light beam. This makes them incompatible with the small bore of modern accelerator chambers. Second, these techniques establish straight lines nearly a meter away from the main electron-beam axes, and the transfer error is not negligible. Recently, Shintake et al. made a step towards overcoming these difficulties by proposing an on-axis alignment procedure using a laser beam and an Airy diffraction pattern for the SCSS x-ray FEL project [14]. They plan to enlarge the optical aperture by opening the gap of invacuum undulators during the alignment. An iris is attached to the geometric center of each cavity BPM. A laser beam is used to image the iris on to a CCD camera downstream to detect the transverse misalignment. The esti-
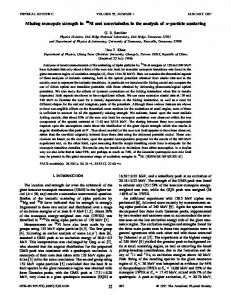
mated transverse accuracy of positioning the geometric centers of the BPMs is on the order of several micrometers over the distance of 25 meters. Since most FELs do not have variable vacuum chambers, it will be difficult to apply this technique to other accelerators. Furthermore, it is not clear how much error will be induced during the crucial step of fiducializing the BPM and electronics when the difference between the geometric and electric centers of the BPM is measured, and when the fiducialization drifts due to temperature variations during the field installation. In this work, we propose to use an x-ray beam, with a wavelength of � � 0:02–2 nm, for on-axis alignment of pinhole apertures. We also propose to establish the x-ray beam axis coincident with the main electron-beam axis by performing in situ fiducialization, which transfers the x-ray beam position to the electron beam using devices that interact with both x-ray and electron beams, such as wire scanners or fluorescent screens. Since the diffraction effect is proportional to the square root of the wavelength, the alignment beam diameter can be kept small for x-ray photons, on the order of 1 mm over long distances ( > 200 m), and hence can be contained in an ordinary accelerator chamber. Another benefit is the vastly reduced scattering by gas molecules in the beam path since the scattering cross section is reduced by several orders of magnitude in the x-ray region. In order to reap these obvious benefits of using an x-ray beam for precision alignment, a proper procedure needs to be established. In Sec. II, we start by describing a procedure utilizing a dedicated alignment undulator as an x-ray source and pinholes as alignment targets. We estimate the alignment accuracies using geometric and wave optics. In Sec. III, we discuss how to choose suitable x-ray optical components, from the source to the detector for an x-ray alignment system. We discuss offline and online fiducialization issues in Sec. IV, improvements and other related issues in Sec. V, and summarize the paper in Sec. VI. Most of our discussion will be based on the geometry and parameters of the LCLS, but it can be easily extended to other large-scale accelerator projects. We envision that this technology could be beneficial for the ILC project with its component alignment tolerances even more challenging than what is currently required for the XFEL projects. II. X-RAY OPTICS ALIGNMENT PROCEDURE AND ACCURACY Figure 1 shows the schematics of the x-ray instrument. An alignment undulator is located 20 m or more upstream of the accelerator beam line to be positioned with a retractable x-ray pinhole (source pinhole) located midway between the two. The pinhole is used to define a fixed source point for the alignment. An x-ray imaging detector is located 10 m or more downstream of the main beam line. A second retractable x-ray pinhole (detector pinhole) is located immediately upstream of the detector, used to
030701-2
HIGH-RESOLUTION ACCELERATOR ALIGNMENT USING . . .
Phys. Rev. ST Accel. Beams 9, 030701 (2006)
FIG. 1. (Color) Schematics showing the alignment procedure: (a) Definition of the XBA coordinate system, (b) setup of the XBA, and (c) alignment of target pinholes.
define the center of the detector plane. When both of the two x-ray pinholes are inserted they define a straight line, which will be referred to as the x-ray beam axis (XBA). In addition, every component to be aligned with the x-ray beam will need a retractable pinhole (target pinhole) as an alignment target. A. Setup of the x-ray beam axis and primary coordinate system The reference XBA is established by conventional survey method, using common survey tools to set up the source and detector pinholes, both at inserted positions, onto the design electron-beam axis at the best achievable accuracy [Fig. 1(a)]. Once the two pinholes are set, the conventional survey monument network becomes secondary. The primary coordinates are now uniquely defined by the following rules: The z axis or the XBA is the straight line linking the centers of the two pinholes, from the source to the detector. The Oyz plane is defined by the triangle formed by the center of the Earth and the two pinholes, with the y axis perpendicular to the z axis and pointing away from the center of the Earth. The x axis is defined by the right-hand rule, and is the only horizontal line perpendicular to the z axis. B. Align the undulator source to the XBA and fiducialize the detector By putting an x-ray beam through the detector pinhole, we can define the zero (x � 0, y � 0) of the detector to be the center of the observed x-ray peak. By iteratively adjusting the electron-beam position and slope in the alignment
undulator to maximize the x-ray flux through the source pinhole and minimize the beam center deviation from the detector zero, we can bring the undulator x-ray beam centroid to coincide with the XBA [Fig. 1(b)]. C. Target alignment To align a target pinhole to the XBA [Fig. 1(c)], we insert the source pinhole in the undulator x-ray beam to produce a fixed x-ray source, and insert the target pinhole in the beam. We then move the target pinhole with the attached beam line component to center the x-ray beam spot on the detector plane. While the size and transverse stability of the electron beam affects the intensity at the detector plane, the resolution and accuracy of the alignment is determined only by the stability of the optics due to the use of a pinhole as x-ray source. D. Alignment accuracy and instrument resolution We estimate the alignment accuracy of the target pinholes in three steps: (i) Calculate the beam spot size and profile at the detector plane produced by a point source. (ii) Calculate the beam spot size and profile at the detector plane produced by an extended source. (iii) Convert the measured beam size as the alignment accuracy of the pinhole using the optical geometry. 1. Pinhole camera resolution at the detector plane X-ray pinholes have been used for measuring electronbeam sizes for some years. Their performance is best
030701-3
BINGXIN YANG AND HORST FRIEDSAM
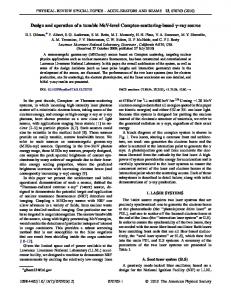
FIG. 2.
Phys. Rev. ST Accel. Beams 9, 030701 (2006)
Schematic of a pinhole camera with a point source. Projection of the pinhole on the image plane shows a magnified area.
modeled by Fresnel diffraction [15–17]. Figure 2 shows a typical geometry of a pinhole camera, with a pinhole located at a distance S1 from the source, and an x-ray imaging camera at a distance S2 from the pinhole. The Fresnel number, defined as the number of Fresnel zones and given by F � a21 =�f; is a key parameter in the model, where a1 is the radius of the circular pinhole, � is the wavelength of the light, and the distance f is given by 1 1 1 f � S1 � S2 . In this coordinate system, we label all transverse coordinates on the source plane with subscript 0, those coordinates on the pinhole plane with subscript 1, and those coordinates on the image plane with subscript 2, as shown in Fig. 2. For large Fresnel numbers (F � 1) the behavior of the optical system can be approximated by geometric optics. For a point source, the beam spot generated, also known as the point spread function (PSF), on the detector plane is a disc with a radius of a2 � �M � 1�a1 , where M � S2 =S1 is the magnification of the optical system. The annular pattern I�r2 � can be used to derive the integrated x profile: P�x2 � �
Z1 �1
I�r2 �dy2 � 2
Z1
I�r2 �r2 q�������������������� dr2 jx2 j r2 2 � x2 2
(1)
lated using the Huygens Principle, � � � 2 � � x � y21 � C Z jE�x2 ; y2 �j2 � � exp ik 1 � � �S S 2S 1 2
1
�x � x2 �2 � �y1 � y2 �2 � 1 2S2
�2 �� � � � dx1 dy1 � � � : � (3)
Its Gaussian profile width can be derived similar to Eqs. (1) and (2). Figure 3 shows the width of the Gaussian profile as a function of F. We can see that the Gaussian width approaches the geometric limit for F � 1 and the Fraunhofer limit for F 1. The following expression can be used to approximate the Gaussian width of the Fresnel PSF profiles: � � �22;reso F 1:5 �1 � 1� F �M � 1�2 �f 3 � � 1 � 0:044 0:3 � ; �0:1 < F < 10�: (4) F From Fig. 3, we can also see that for large apertures (F > 0:38), the Fresnel diffraction PSF profile is always narrower than that of the geometric projection
q�������������������� where r2 � x2 2 � y2 2 is the radial distance from the axis. The profile is a half-circle and can be fitted to a Gaussian function 2
2
Pfit �x2 � � P0 e�x2 =2�2;geo ;
(2)
with a Gaussian width of �2;geo � 0:59a2 � 0:59�M � 1�a1 . For small Fresnel numbers (F 1) the behavior of the optical system can be approximated by the Fraunhofer diffraction, and the PSF is given by the Airy disk, I��� � I0 J1 �ka1 sin��=ka1 sin��2 , where the wave vector is given by k � 2�=�. At a distance S2 from the pinhole, the intensity distribution is I�r2 � � I0 f J1 �ka1 r2 =S2 ��=�ka1 r2 =S2 �g2 . Using the same procedure shown in Eqs. (1) and (2), one can derive the Gaussian width for the Fraunhofer diffraction �2;diff � 1:31�- S2 =a1 . The more accurate Fresnel diffraction PSF can be calcu-
FIG. 3. (Color) Calculated Gaussian width of PSF profiles of a pinhole camera with different models: (a) geometric projection, (b) Fraunhofer diffraction, (c) hybrid model (quadrature sum of the previous two) [18,19], (d) Fresnel diffraction, and (e) fit to (d), as shown in Eq. (4).
030701-4
HIGH-RESOLUTION ACCELERATOR ALIGNMENT USING . . . �2;reso �2;geo � 0:59�M � 1�a1 ;
�F 0:38�: (5)
In this regime, we can use the geometric projection for our semiquantitative discussion, with the comforting thought that Fresnel diffraction will only make the beam size smaller.
Phys. Rev. ST Accel. Beams 9, 030701 (2006)
Hence the rms alignment accuracy at the pinhole location is given by � q������������������������������� �2q2 � 0:35aD 2 ; M�1 �� �0:03 � 0:2� and �q � x; y�: �align �
(8)
2. Beam profile size for an extended source When we have an extended source with finite source sizes �x0 and �y0 , the beam spot on the detector plane is larger than that of a point source. In this case let us consider the extended source as a collection of point sources in a 2 2 2 2 Gaussian distribution ��x0 ;y0 � � �0 e��1=2� �x0 =�x0 ���y0 =�y0 �� . For each point source located off axis by (x0 ; y0 ) its beam spot on the detector plane will be centered on �x2 ; y2 � � �Mx0 ; My0 �, respectively. Summing the contributions of all point sources amounts to calculating the convolution of the Gaussian profile with the pinhole camera PSF profile. The total beam profile sizes at the detector plane are thus �2q2 � �22;reso � M2 �2q0 ;
with �q � x; y�:
(6)
Next we introduce a few new variables, the total beam line length S � S1 � S2 , the relative target position s � S1 =S, the minimum target Fresnel number Fm � 4a21 =�S, the scaled source size FS � 4aS 2 =�S, and the scaled detector size FD � 4aD 2 =�S. We then rewrite Eq. (8) as �align
�x2 � �M � 1��x1 :
g�s� � 1:18 �
(7)
�� � 0:03 � 0:2�;
(9)
where
3. Alignment accuracy of the pinhole position We now use the centroid of the beam spot at the detector plane as an indication of whether the pinhole is centered on the optical axis. The error of positioning the centroid of a Gaussian peak is normally a fraction of the peak width, i.e. ��q2 , where � varies between 0.03 and 0.2, depending on the quality of the photon measurements. Adding the fiducialization error ��0:59aD � from a detector pinhole of q���������������������������������� radius aD , the total uncertainty is � �2q2 � �0:59aD �2 . For a pinhole displacement of �x1 , the center of the beam spot on the detector plane moves by
p������ �S g�s�; �� 4
�
2 0:95Fm � 0:15s�1 � s� Fm � 6s�1 � s�
2 2 s �1 � s�2 � �1 � s�2 FS � s2 FD Fm
�1=2
:
(10)
The left graph of Fig. 4 shows the function g�s� for a near-zero source with size FS � FD � 0:01. It can be seen that when Fm is in the range of 0.3– 0.45, the Fresnel diffraction pattern is at its minimum width for most of the beam line, and a good resolution is obtained over the entire beam line. The Fig. 4 right graph shows the dependence of the function g�s� on the source size for a fixed, near-ideal target size (Fm � 0:35). It can be seen that when FS and FD are in the range of 0.3– 0.5, the function g�s� is fairly flat and less than one. In short, the ideal operating condition can be represented as
FIG. 4. (Color) Function g�s� for different aperture sizes with near-zero source size (FS � FD � 0:01, left graph). Function g�s� for different source sizes with near-ideal target size (Fm � 0:35, right graph).
030701-5
BINGXIN YANG AND HORST FRIEDSAM 9 FS � 0:50 � 0:10 > = Fm � 0:36 � 0:05 ; > FD � 0:50 � 0:10 ;
or
Phys. Rev. ST Accel. Beams 9, 030701 (2006)
p������ 9 > aS � �0:35 � 0:04�p������ �S = a1 � �0:30 � 0:02� p�S ������ > aD � �0:35 � 0:04� �S ; (11)
with the resulting alignment accuracy of p������ �� � 0:03 � 0:2�: �align � �� �S=4�;
(12)
In the case of the LCLS undulator, for example, we use � S � 200 m, and the following parameters [20]: � � 0:5 A, � � 0:1. The ideal target pinhole radius is 30 � 2��m�, while the radii for the source and detector pinholes are 35 � 4 ��m�. The estimated positioning accuracy according to Eq. (12) is �align 0:1 � 25��m� � 2:5 ��m�:
(13)
III. X-RAY OPTICS ISSUES In this section, we will discuss how to choose specific pinhole materials, tailor the detector system response, and specify the undulator source for precision alignment.
�1 t tmin �r�min� lnr�min� S=B � � ��M �M � S=B ;
(14)
where tmin is the minimum thickness for the pinhole foil. Table I shows the minimum foil thickness for several desirable signal-to-background ratios. From the same table we can see that if we accept a background level of 10%, then a 0.5-mm-thick foil (Ta, W, or Au) would be sufficient for applications using photon energy up to 110 keV. Similarly, a 0.25-mm-thick foil would be sufficient for applications using photon energy up to 50 keV. These requirements can be further relaxed for polychromatic sources. For example, for an x-ray source with a nearly uniform spectrum in the region of 10 to 100 keV, a 0.25mm-thick foil would likely be sufficient since most lowenergy photons will be blocked by the foil. Finally, we see from the example in the previous section that suitable pinholes for target and source apertures have diameters of 50 �m or larger. Hence the pinhole aspect ratio is less than ten. The fabrication of these pinholes is well within today’s technological capabilities. B. Detector system
A. Pinhole The intensity of a monochromatic x-ray beam attenuates exponentially into a uniform medium [21]. The fraction of flux transmitted through a foil of thickness t is given by t � e��M �M t , where �M is the mass attenuation coefficient and �M is the density of the metal. We note that a pinhole made with a semitransparent foil will have a peakto-background ratio of �1= t immediately downstream of the pinhole. In the last section, we noted that if we are using the optimum aperture size, the x-ray beam spot on the detector plane is usually narrower than that of the geometric projection of the pinhole aperture, and the profile peak is higher than that of the geometric projection. Hence for estimating the signal-to-background ratios, we can safely use the approximation of the geometric projection, where the ratio is preserved downstream of the aperture. A simple �min� rule of thumb can be given as t �1=rS=B �, where r�min� S=B is the minimum signal-to-background ratio the experiment needs. The above two expressions can be combined to give
For x-ray alignment we can use imaging and nonimaging detectors. Imaging detectors use two-dimensional arrays to acquire a map of the photon flux. Since most types of pixilated x-ray detectors are susceptible to radiation damage at high flux, the popular approach is to use an xray scintillator (YAG, for example) to convert the x rays to visible light and then utilize optical lenses and cameras to acquire the image. The nonimaging detectors are commonly referred to as position-sensitive detectors (PSDs). While many designs exist, the majority of them operate on the principle of dividing the signal of the detector into several parts or quadrants, with their fractions of the signal dependent on the position of the beam centroid, such that the beam position is proportional to the ratio of the difference between the two opposing parts over their sum signal. The resolution of the PSD is often a small fraction of the beam size, usually on the order of 1 to several per cent. Unlike imaging detectors, a PSD cannot pick out a narrow peak from a wide background, and hence is more susceptible to background noise.
TABLE I. Required thickness of selected metal foils for minimum signal-to-background ratio (x-ray photon energy 100 N) need to be employed [29]. In addition, the repeatability of the retractable pinholes is a major source of error for transferring the position information to an outside fiducial. When such fiducials are needed, ultrahigh-precision machining and motion systems will be required. (ii) To use fiducialized screens and wire scanners as beam position monitors, not only should their motion resolution be finer than the required accuracy, but their motion reproducibility should also be comparable. Nanopositioning systems are now commercially available and should be utilized. (iii) To maintain micrometer positioning accuracy for accelerator components, the support and mover system of the component(s) needs to be stable, and loads need to be carefully distributed. For example, it is highly desirable to separate supports
Phys. Rev. ST Accel. Beams 9, 030701 (2006)
F. Real-time component position monitor Even when the mechanical design meets all the challenges, environmental changes may still be beyond human control. A temperature change of 1 � C can easily move the target on a 1-m-high support stand by 10 �m or more. The temperature variation of the floor, the wall, and the support stand will easily move accelerator components on a micrometer scale. Even if we have the enclosure temperature under rigorous control, the daily tidal motion of the Earth’s surface will move the ground up and down by up to �30 cm in a 12-hour period, resulting in some twisting and bending of the floor. While the magnitude of the twisting and bending depends on local geological conditions, a reproducible alignment literally depends on the phase of the moon. In addition to these periodic movements, the Earth’s inelastic crust releases its internal stress by a natural diffuse settlement process. There are many sources of the stress that range from local temperature effects to large-scale continental motions. Therefore, any well-aligned configuration will drift out of alignment slowly, as described by the ‘‘ATL law.’’ In accelerators where component movements are not acceptable after applying all available passive mitigation
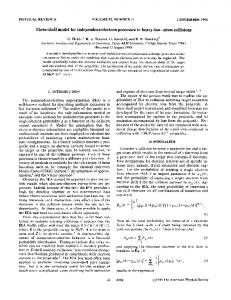
FIG. 11. (Color) Real-time position monitoring system: (a) Alignment with on-axis trajectory and targets. (b) Observe position changes with off-axis monitoring x-ray beam line. The inset shows two independently retractable pinhole targets, one used for XBA and the other for monitoring position changes. In an x-ray FEL, the monitoring beam line has its own vacuum chamber to reduce the radiation background.
030701-15
BINGXIN YANG AND HORST FRIEDSAM
Phys. Rev. ST Accel. Beams 9, 030701 (2006)
approaches, a regular observe-and-correct procedure must be implemented. The target pinholes attached to critical components can be inserted and their positions measured at regular time intervals. In the case of LCLS, a period of several hours or days may suffice. Over time this approach will provide valuable information about long-term ground settlement. In case higher frequency observations and corrections are required, a real-time position monitoring and feedback system must be considered. Figure 11 shows a possible implementation using an off-axis x-ray alignment beam line. The electron beam is steered through a chicane or a two-stage trajectory offset before entering the main undulator hall. The offset of the two beams are adjustable from zero to a maximum of several millimeters. Each critical component will have two independently retractable pinhole targets, one on axis and the other off axis, in the monitor beam line. The monitor beam line is parallel to the EBA and has its own independently operated source and detector pinholes, as well as its own detector system. During the on-axis alignment procedure [Fig. 11(a)], the trajectory offset is set to zero and the on-axis target is used to position the critical component(s) as described in the previous sections. After the alignment is completed, we set the offset electron trajectory to be collinear with the monitor beam line [Fig. 11(b)]. The same undulator now produces x-ray beam along the parallel monitor beam axis, which can be used to fiducialize the off-axis monitor pinhole target without moving the component. From now on, any change in the position of the off-axis target pinhole will shift the pinhole camera image on the detector, providing real-time information on the component position change at a resolution of micrometers. The information will allow position adjustments to be made while the accelerator is running. Since only one target is inserted at any given time, the wakefield effect of the target may be negligible. However, in order to use such a monitorfeedback system for position control of an x-ray FEL, a larger separation of the two beam lines, even separate beam pipes, may be required to avoid contamination of the position monitor signal by the FEL beam. X-ray Fresnel lenses are ideally suited for real-time component position monitoring in long accelerators. Their small x-ray spots allow micron-level resolution in component position. Their high acceptance angles make good use of the x-ray flux and allows faster measurement. Finally, since the monitoring beam line measures only relative changes of a component position, the difficulty associated with fiducializing large zone plates becomes unimportant for the application. VI. SUMMARY AND CONCLUSION We proposed a new alignment technique using an undulator x-ray beam produced by high-energy electrons. The proposal contains two major technical components:
First, two solidly built x-ray pinholes, source and detector, are used to define a highly stable and reproducible x-ray beam axis (XBA). Second, the XBA is chosen to be collinear with the electron-beam axis in order to minimize the transfer errors to accelerator components and maximize the coincidence between x-ray beam and e-beam. We showed that a measurement accuracy of 1–3 �m can be achieved for target pinholes in the 200-m-long LCLS undulator hall. The accuracy can be further enhanced with x-ray zone plates, if necessary. We described procedures to transfer this position information in situ to quadrupoles, diagnostic components, undulators, and user beam lines, at an overall accuracy of better than 10 �m in the case of the LCLS undulator. This x-ray alignment technique also enhances the electron-beam-based alignment (EBBA) process in three aspects: First, it provides a good starting configuration for the EBBA. Second, it provides fixed anchors for the electron-beam axis (EBA) for reproducible trajectories from run to run. Last but not least, it facilitates the extension of the coordinate axes into the user area at high accuracy, enabling far-field x-ray diagnostics to perform angular distribution measurements with absolute angle reference. Finally, we addressed the possibility to utilize this technique for a real-time position monitor system of critical beam components of an FEL or a long accelerator. It will enable active position control to micrometer levels. Although we used the LCLS parameters for this paper, other FELs currently in the design stage could benefit by integrating such a system from the beginning. The proposed alignment system promises superior alignment accuracy over long distances and may therefore be a viable approach for aligning beam components of the International Linear Collider (ILC) currently under consideration. ACKNOWLEDGMENTS We would like to thank Paul Emma and Heinz-Dieter Nuhn for stimulating discussions on electron-beam-based alignment techniques, and Steve Milton for his encouragement for this work. This work is supported by the U.S. Department of Energy, Office of Basic Energy Sciences, Office of Science, under Contracts No. W-31-109-ENG-38 and No. DE-AC03-76SF00515.
[1] J. Arthur, P. Anfinrud, P. Audebert, K. Bane, I. Ben-Zvi, V. Bharadwaj, R. Bionta, P. Bolton, M. Borland, P. H. Bucksbaum, R. C. Cauble, J. Clendenin, M. Cornacchia, G. Decker, P. Den Hartog, S. Dierker, D. Dowell, D. Dungan, P. Emma, I. Evans, G. Faigel, R. Falcone, W. M. Fawley, M. Ferrario, A. S. Fisher, R. R. Freeman, J. Frisch, J. Galayda, J.-C. Gauthier, S. Gierman, E. Gluskin, W. Graves, J. Hajdu, J. Hastings, K. Hodgson,
030701-16
HIGH-RESOLUTION ACCELERATOR ALIGNMENT USING . . .
[2]
[3]
[4]
[5]
[6]
[7] [8] [9] [10]
[11] [12]
Z. Huang, R. Humphry, P. Ilinski, D. Imre, C. Jacobsen, C.-C. Kao, K. R. Kase, K.-J. Kim, R. Kirby, J. Kirz, L. Klaisner, P. Krejcik, K. Kulander, O. L. Landen, R. W. Lee, C. Lewis, C. Limborg, E. I. Lindau, A. Lumpkin, G. Materlik, S. Mao, J. Miao, S. Mochrie, E. Moog, S. Milton, G. Mulhollan, K. Nelson, W. R. Nelson, R. Neutze, A. Ng, D. Nguyen, H.-D. Nuhn, D. T. Palmer, J. M. Paterson, C. Pellegrini, S. Reiche, M. Renner, D. Riley, C. V. Robinson, S. H. Rokni, S. J. Rose, J. Rosenzweig, R. Ruland, G. Ruocco, D. Saenz, S. Sasaki, D. Sayre, J. Schmerge, D. Schneider, C. Schroeder, L. Serafini, F. Sette, S. Sinha, D. van der Spoel, B. Stephenson, G. Stupakov, M. Sutton, A. Szo¨ke, R. Tatchyn, A. Toor, E. Trakhtenberg, I. Vasserman, N. Vinokurov, X. J. Wang, D. Waltz, J. S. Wark, E. Weckert, H. Winick, M. Woodley, A. Wootton, M. Wulff, M. Xie, R. Yotam, L. Young, and A. Zewail, Report No. SLAC-R-593, http://www.slac.stanford.edu/ pubs/slacreports/slac-r-593.html J. Pflu¨ger, in Proceedings of the Workshop on Undulator Systems for X-FELs, WUS2005, DESY Hamburg, Germany, 2005, http://adweb.desy.de/~faatz/wus2005/ program.html T. Shintake, in Proceedings of the Third Asia Particle Accelerator Conference, Gyeongju, Korea, March 2004 (to be published at http://www.jacow.org). Y. Kim, J. S. Oh, M. H. Cho, I. S. Ko, W. Namkung, D. Son, and Y. Kim, in Proceedings of the Third Asia Particle Accelerator Conference, Gyeongju, Korea, March 2004 (Ref. [3]). J. Prenting, M. Schlo¨sser, A. Herty, J. Green, G. Grzelak, A. Mitra, and A. Reichold, in Proceedings of the XXII International Linear Accelerator Conference, Lu¨beck, Germany, 2004, pp. 690–692, http://www.jacow.org P. Tenenbaum, in Proceedings of the ILC Meeting at KEK, Tsukuba, Japan, 2004, http://lcdev.kek.jp/ILCWS/Talks/ 13wg1-4-linacemit_KEK_PT.pdf W. Schwarz, Vermessungsverfahren im Maschinen- und Anlagenbau (Konrad Wittwer, Stuttgart, Germany, 1995). W. B. Herrmannsfeldt, M. J. Lee, J. J. Spranza, and K. R. Trigger, Appl. Opt. 7, 995 (1968). L. V. Griffith, R. F. Schenz, and G. E. Sommergren, Rev. Sci. Instrum. 61, 2138 (1990). I. Feier, H. Friedsam, and M. Penicka, in Proceedings of the International Workshop on Accelerator Alignment, Argonne National Laboratory, 1997, http://wwwgroup.slac.stanford.edu/met/IWAA/IWAAHome.html P. Tenenbaum and T. O. Raubenheimer, Phys. Rev. ST Accel. Beams 3, 052801 (2000). C. Adolphsen, T. L. Lavine, W. B. Atwood, T. M. Himel, M. J. Lee, T. S. Mattison, R. Pittman, J. T. Seeman, S. H.
[13] [14]
[15] [16]
[17]
[18] [19] [20] [21] [22] [23]
[24]
[25]
[26]
[27]
[28] [29]
030701-17
Phys. Rev. ST Accel. Beams 9, 030701 (2006)
Williams, and G. H. Trilling, in Proceedings of the Particle Accelerator Conference, Chicago, IL, 1989 (IEEE, Piscataway, NJ, 1989), pp. 977–9979, http:// www.jacow.org. A. E. Siegman, Lasers (University Science Books, Mill Valley, CA, 1986). T. Shintake, H. Kitamura, and T. Ishikawa, in Synchrotron radiation instrumentation: Eighth International Conference on Synchrotron Radiation Instrumentation, AIP Conf. Proc. No. 705 (AIP, New York, 2004), p. 117. M. Borland, ‘‘A Method for Calculating Emittance from Undulator Images,’’ SSRL ACD-NOTES 60, 1989. B. X. Yang and A. Lumpkin, in Proceedings of the 1999 Particle Accelerator Conference, New York, 1999 (IEEE, Piscataway, NJ, 1995), pp. 2161–2163, http://www. jacow.org. B. X. Yang, in Proceedings of BIW’02, Upton, New York, 2002, AIP Conf. Proc. No. 648 (AIP, New York, 2002), pp. 59–78. P. Elleaume, C. Fortgang, C. Penel, and E. Tarazona, J. Synchrotron Radiat. 2, 209 (1995). Z. Cai, B. Lai, W. Yun, E. Gluskin, D. Legnini, P. Illinski, and G. Srajer, Rev. Sci. Instrum. 67, 3368 (1996). H. Nuhn, ‘‘LCLS Undulator Requirements,’’ LCLS Specification 1.4-001. J. Kirz et al., X-ray Data Booklet (Lawrence Berkeley Lab, Berkeley, CA, 1986), and references cited therein. M. Sanchez del Rio and R. J. Dejus, in Proc. SPIE Int. Soc. Opt. Eng. 3448, 340 (1998). K. J. Kim, in Physics of Particle Accelerators: Fermilab Summer School 1987, Cornell Summer School 1988, edited by Melvin Month and Margaret Dienes, AIP Conf. Proc. No. 184 (AIP, New York, 1989), p. 565. B. Yang and H. Friedsam, ANL Report No. ANL/ APS/LS-310, 2005, http://www.aps.anl.gov/Facility/ Technical_Publications/lsnotes/. T. O. Raubenheimer and D. Schulte, in Proceedings of the 1999 Particle Accelerator Conference, New York, edited by A. Luccio and W. MacKay (IEEE, Piscataway, NJ, 1999), pp. 3441–3443, http://www.jacow.org. B. X. Yang, in Proceedings of the 2005 Particle Accelerator Conference, Knoxville, TN, 2005 (IEEE, Piscataway, NJ, 2005), pp. 2342 –2344, http://www. jacow.org. M. Born and E. Wolf, Principles of Optics: Electromagnetic Theory of Propagation, Interference and Diffraction of Light (Cambridge University Press, Cambridge, UK, 1997). V. Shiltsev, Report No. FERMILAB-FN-0717, 2002. A. Slocum, Precision Engineering 14, 67 (1992).