photogrammetry software. ... flexible manner, albeit over small areas (
The International Archives of the Photogrammetry, Remote Sensing and Spatial Information Sciences, Volume XLI-B1, 2016 XXIII ISPRS Congress, 12–19 July 2016, Prague, Czech Republic
HIGH-RESOLUTION DEBRIS FLOW VOLUME MAPPING WITH UNMANNED AERIAL SYSTEMS (UAS) AND PHOTOGRAMMETRIC TECHNIQUES M.S. Adams a*, R. Fromm a, V. Lechner a a
Dept. of Natural Hazards, Austrian Forest Research Centre (BFW), Rennweg 1, 6020 Innsbruck, Austria – (marc.adams, reinhard.fromm, veronika.lechner)@bfw.gv.at
KEY WORDS: Unmanned Aerial Vehicle, Structure-from-motion, Natural Hazards, Volumetric Sediment Budget, Digital Terrain Models, Event Documentation
ABSTRACT: Debris flows cause an average € 30 million damages and 1-2 fatalities every year in Austria. Detailed documentation of their extent and magnitude is essential for understanding, preventing and mitigating these natural hazard events. The recent development of unmanned aerial systems (UAS) has provided a new possibility for on-demand high-resolution monitoring and mapping. Here, we present a study, where the spatial extent and volume of a large debris flow event were mapped with different UAS, fitted with commercial off-the-shelf sensors. Orthophotos and digital terrain models (DTM) were calculated using structure-from-motion photogrammetry software. Terrain height differences caused by the debris flow in the catchment and valley floor were derived by subtracting the pre-event airborne laser scanning (ALS) DTM from a post-event UAS-DTM. The analysis of the volumetric sediment budget showed, that approximately 265,000 m³ material was mobilised in the catchment, of which 45,000 m³ settled there; of the material, which reached the valley floor, 120,000 m³ was deposited, while another 10,000 m³ was eroded from there. The UASresults were validated against ALS data and imagery from a traditional manned-aircraft photogrammetry campaign. In conclusion, the UAS-data can reach an accuracy and precision comparable to manned aircraft data, but with the added benefits of higher flexibility, easier repeatability, less operational constraints and higher spatial resolution.
1. INTRODUCTION Debris flows are described as ‘rapid, gravity-induced mass movements consisting of a mixture of water, sediment, wood and anthropogenic debris that propagate along channels incised on mountain slopes and onto debris fans’ (Gregoretti et al., 2016). These natural hazard events have a substantial impact on the quality of life in mountainous regions: In Austria, the examination of 5,000 debris flows, recorded between 1972 and 2004, resulted in a total estimated damage of € 965 million and 49 fatalities (Oberndorfer et al., 2007). Promptly mapping the consequences of these events by determining the spatial extent and volume of eroded and deposited material, is highly relevant to scientists and practitioners, e.g. for numerical simulation modelling (Rickenmann et al., 2006; Han et al., 2015), process understanding (Theule et al., 2015; Pellegrino et al., 2015), and natural hazard management (Ballesteros Cánovas et al., 2016; Aronica et al., 2012). Conventional mapping techniques mostly require personnel to directly access the process area (catchment and valley floor), which is a hazardous or even impossible task. Additional data acquisition from terrestrial (e.g. terrestrial laser scanning), airborne (e.g. traditional photogrammetry from manned aircraft) or spaceborne sources (e.g. high-resolution satellite imagery) is typically only commissioned in case of large-scale events (Linder et al., 2015). In recent years, the development of unmanned aerial systems (UAS) (Colomina & Molina, 2014) has provided a wide range of new possibilities for high resolution monitoring and mapping (Lucieer et al., 2014). UAS are able to bridge the gap between full-scale, manned aerial, and terrestrial observations (Briese et al., 2013; Rosnell & Honkavaara, 2012). They are credited as being able to supply on-demand imagery at an unprecedented
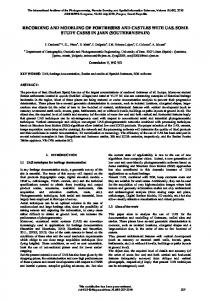
level of detail (ground resolution of few centimetres or millimetres) (Lucieer et al., 2014), in a cost-efficient and flexible manner, albeit over small areas (4 m) are reached on the left bank of the Seigesbach torrent, which enters the figure from the bottom left. The results from the valley floor (Figure 5, bottom) highlight the extent of erosion of material from the catchment. Large sections of this part of the catchment
lie in forested areas, therefore the mass balance calculation was limited to the gully (red outline in figure) to avoid errors introduced by vegetation height differences between ALS and UAS data. The cross-section (Figure 5, centre right) reveals erosion values of 3-4 m in the lower part of the gully, while values in the central and upper sections reach 8 m. Isolated patches of deposited material were also detected. The total debris flow mass balance calculation showed that 265,000 m³ (±42,000 m³) material was mobilised in the catchment, of which 45,000 m³ (±13,000 m³) settled there; of the material, which reached the valley floor, 120,000 m³ (±5,000 m³) was deposited there, while another 10,000 m³ (±2,000 m³) was eroded. 3.3 Validation of Results Accuracy and precision of the UAS-results was calculated by comparison with manned aircraft imagery, ALS data, extensive fieldwork and a second UAS-flight in the valley floor. The accuracy of the UAS-data lies within 0.05-0.15 m (root mean square error – RMSE) and 0.3-0.5 m in xyz-directions, for the valley floor and catchment, respectively. The uncertainty range of the mass balance calculation above corresponds to this RMSE. The precision in the valley floor was derived from the second UAS-flight – it lies at 0.05 m. A more advanced analysis of accuracy and precision is currently in preparation.
This contribution has been peer-reviewed. doi:10.5194/isprsarchives-XLI-B1-749-2016
752
The International Archives of the Photogrammetry, Remote Sensing and Spatial Information Sciences, Volume XLI-B1, 2016 XXIII ISPRS Congress, 12–19 July 2016, Prague, Czech Republic
Figure 5. Results of the volumetric sediment budget calculation in the valley floor (top) and catchment (bottom); two cross-sections through the pre- (ALS) and post-event (UAS) DTM (centre left – deposition; centre right – catchment), the location of the crosssections are indicated by the white lines in both figures – A & B / C & D marking the starting and end points, respectively
This contribution has been peer-reviewed. doi:10.5194/isprsarchives-XLI-B1-749-2016
753
The International Archives of the Photogrammetry, Remote Sensing and Spatial Information Sciences, Volume XLI-B1, 2016 XXIII ISPRS Congress, 12–19 July 2016, Prague, Czech Republic
4. CONCLUSIONS In this study, aerial imagery from a fixed-wing and a multicopter UAS were used to map an area of 2.8 km² with the aim of determining the volumetric sediment budget of a debris flow event in the Austrian Alps in summer 2015. Using structure-from-motion photogrammetry and indirect georeferencing, high-resolution post-event orthophotos (