Local structures of nickel silicide formed by heat treatment of a nickel layer sputtered on silicon (100) substrate were observed by high-resolution transmission ...
HIGH-RESOLUTION TRANSMISSION ELECTRON MICROSCOPY OF INTERFACES BETWEEN THIN NICKEL LAYERS ON Si(001) AFTER NICKEL SILICIDE FORMATION UNDER VARIOUS ANNEALING CONDITIONS Toshiyuki Isshiki1, Koji Nishio1 , Takashi Sasaki1, Hiroshi Harima1 , Masahiro Yoshimoto2, Takashi Fukada3, and Woo Sik Yoo3 1 Department of Comprehensive Sciences, and 2Cooperative Research Center, Kyoto Institute of Technology, Sakyo, Kyoto 606-8585, Japan 3 WaferMasters, Inc., 246 East Gish Road, San Jose, CA 95112, U.S.A.
Local structures of nickel silicide formed by heat treatment of a nickel layer sputtered on silicon (100) substrate were observed by high-resolution transmission electron microscopy. In the specimen as-sputtered and after heat treatment at 498K, a thin layer was found at the interface between Ni (Ni2Si) and the Si substrate. The layer was an initial phase of silicidation and seems to be non-fluorite type NiSi2. When annealed around 600K, the NiSi2 phase disappeared and a NiSi phase grew dominantly. At the interface of NiSi/Si, the crystal lattices appeared smooth, because the lattice mismatch between NiSi and Si was absorbed by lattice distortion within a few atomic layers of the interface. The Ni3Si2 and Ni2Si phases remaining in the grown NiSi layer were also identified by Fourier analysis of the lattice fringe.
INTRODUCTION Today, silicides are key materials in semiconductor engineering. Nickel (Ni) silicide has favorable properties for highly shrunk LSI devices, such as low electrical resistivity and low consumption of the Si layer during silicide formation. Nickel monosilicide (NiSi) is the most suitable, among various nickel silicides, because NiSi shows the lowest resistivity and less consumption of the Si layer than disilicide. However, the fact that the various phases of nickel silicide can coexist makes single phase NiSi formation problematic. In addition to NiSi, several phases of nickel silicide are well-known [1-4]. The typical silicides can be listed with their crystallographic structures in order of higher Ni concentration; Ni3Si (cubic, Pm3m; a=0.3505nm), Ni2Si (ortho., Pbnm; a=0.7066nm, b=0.5008nm, c=0.3732nm), Ni3Si2 (ortho., Cmcm; a=0.6605nm, b=0.7627nm, c=0.9574nm), NiSi (ortho., Pnma; a=0.5233nm, b=0.3258nm, c=0.5659nm), and NiSi2 (cubic, Fm3m; a=0.5395nm). A sequential formation of these silicides form a thin Ni film on a Si substrate, by heattreatment, has been well-known [5]. At first
Ni2Si appears around 470K. Then migration of Ni atoms, through the silicide layer and toward the Si substrate, forms the NiSi phase around 670K, followed by NiSi2 formation around 970K. The sequence has been widely accepted, but there is some possibility that non-equilibrium phases, of nanoscopic size, may appear during the silicidation process. In the field of LSI engineering, nano-technologies that configure materials with nanometer scale are very important. Therefore, it is proper to clearly describe such phenomena as it is related to LSI fabrication. In this study, local structures formed during silicidation processes of Ni film on Si(001) were observed directly by highresolution transmission electron microscopy (HRTEM). EXPERIMENTAL A p--Si(001) wafer, sputtered with a 10nm thick Ni layer, was heat-treated in an annealing oven at various temperatures between 473-723K for 300-1800 sec. After thermal processing, the specimen was prepared for cross-sectional HRTEM observation by mechanical polishing and Ar+ ion milling. The ion milling was
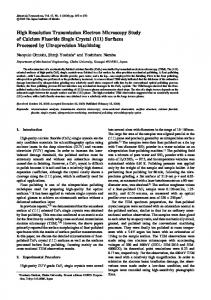
accomplished with an incident beam angle of 4o and an ion acceleration voltage of 4kV, for rough thinning, and 2kV for finishing by using a Gatan model 691 PIPS system. The processed wafer was observed with a JEOL JEM-2010SP TEM with an accelerating voltage of 200kV. RESULTS and DISCUSSION Prior to TEM observation, Raman scattering spectroscopy was carried out to identify the phase grown in specimens heat-treated at various temperatures. The Raman spectra presented in Fig. 1 revealed a relationship between the annealing temperature and the composition of the silicide, as follows. Ni2Si appears at 493K and is stable below 583K. Heat treatment above 563K gives the NiSi phase and it grows as a single phase at 673K and higher. This result agrees with the sequential formation of nickel silicide mentioned in the introduction.
723K
Ni(111) plane, almost parallel to the Si substrate. Between the Ni layer and the Si substrate, a silicide layer of a few nm in thickness was observed. After heat-treatment at 498K, as presented Fig. 2b, the Si substrate was covered with silicide layer of Ni2Si, about 10nm in thickness. Although the thickness of the silicide layer was uniform, the contrast in the silicide
a
b
c
673K
Ni2Si Intensity[a.u.]
598K 583K
d
563K 498K 473K
NiSi 100
150
200
250
300
350
400
-1
Raman Shift[cm ]
e
Figure 1. Raman scattering spectra obtained from the silicided Si wafer by heart treatment at various temperatures.
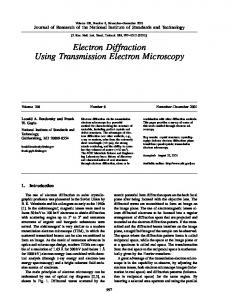
Figures 2a-e show a series of cross-sectional TEM observation of specimens as-sputtered and after heat treatment at 498K, 583K, 598K and 723K, respectively. The Ni layer in the assputtered specimen (Fig. 2a) was composed of grains as small as 10nm in size, oriented in the
Figure 2. A series of cross-sectional TEM observations of Si substrate on which nickel silicides was formed by heat-treatment at various temperatures. (a) as sputtered, (b) 498K, (c) 583K, (d) 598K and (e) 723K.
layer TEM indicated that the Ni2Si phase did not grow as single crystals. The Ni layer on the silicide layer separated, as islands, due to migration of Ni atoms toward the silicide layer. Images for specimens heat treatment at 583K and 598K are presented in Fig. 2c and 2d. At this temperature NiSi grew dominantly and other Nirich silicides were scattered at the surface of the NiSi layer. The interface between the NiSi layer and the Si substrate was gently roughened. When the specimen was heated to 725K, only the NiSi phase grew uniformly, with dimensions of a few hundred nm in width and 20 nm in thickness, as seen in Fig. 2e.
a Ni Si b
Ni
NiSi2
0.192nm ||
Si Figure 3. (a) A high magnification image of interface region in as-sputtered specimen. (b) Enlarged image of (a).
Figure 3a shows a high magnification image of an interface region between the Ni layer and the Si substrate in the as-sputtered specimen. A thin silicide layer, of a few nm in thickness, was clearly seen at the Ni/Si interface. Fig. 3b shows an enlarged image of Fig 3a. Lattice fringes of 0.192nm, perpendicular to the Si(001) substrate, can be seen in the silicide layer. Lattice fringes at the upper side of the silicide layer were assigned Ni{111} and the lower side fringes
were due to Si{111} and Si(002). At this temperature (before annealing) growth of Ni2Si can’t be considered and spacing of the lattice fringe in the silicide layer didn’t agree with that belonging to Ni2Si. This silicide is considered to be a NiSi2 phase with crystal structure consisting of Ni atoms at tetrahedral vacant sites in the Si lattice [6]. Since the structure can only form from diffusion of Ni atoms into the Si lattice without rearrangement of Si-Si bonds, the NiSi2 phase seems to be formed immediately without heat treatment. It should be noted that this NiSi2 phase has a different structure from fluorite type NiSi2, considered the most stable phase in nickel silicide. Although the thickness of the NiSi2 layer slightly decreased, as seen in Fig. 4, the layer still remained at the interface between the Ni2Si layer and the Si substrate, even after forming a Ni2Si phase by being heat treated at 498K. This means that formation of Ni2Si proceeds at almost the same speed as the migration of Ni atoms into the Si substrate to form the NiSi2. Then, a reaction with Si transforms it to Ni2Si, not directly, but via the NiSi2 phase. Consequently, an interface contacting Ni2Si and Si directly doesn’t exist. In contrast, the lattice fringe in Fig. 4 shows Ni2Si contact with metallic Ni, at the opposite side of the Ni2Si layer, without any intermediate phases. The Ni2Si layer transformed to a NiSi phase by heat-treatment above 583K, with some Nirich phases remaining on the surface of the NiSi layer. At this stage, the interface phase of the NiSi2 disappeared and the NiSi layer contacted with the Si substrate directly. Figs. 5a and 5b show an overview of the NiSi layer and lattice relationship at the NiSi/Si interface. Lattice fringes of NiSi and Si look to join smoothly at the interface in Fig 5b. However, it can be seen that at the interface, the mismatch of the lattice is absorbed locally, by lattice distortion, within a few atomic layers spacing.
Ni
a
b
c
Ni2Si b d
Ni2Si
NiSi2 Si Figure 4. A lattice image of two interfaces between Ni and Ni2Si (the upper), and Ni2Si and Si substrate (the lower) in the specimen heat treated at 493K.
a
b NiSi
Si Figure 5. An overview of NiSi layer contains Ni-rich phases (a) and a lattice image near the interface between NiSi layer and Si substrate (b).
Ni3Si2 b Lattice images of Ni-rich phases at
Figure 6. the area labeled by A (a) and B (c) in Fig 5a and their Fourier spectra (b), (d).
Ni-rich phases left at the surface region of the NiSi layer, analyzed using the Fourier spectrum of the lattice image, appeared in the particle. Figs. 6a-d show enlarged images of the area labeled by A and B in Fig. 5a and their Fourier spectra. Fourier transformation of the lattice images gave clear spots for both areas A and B. Spots obtained from particles in area A and B corresponded to a lattice spacing belonging to Ni2Si and Ni3Si2 , respectively. Thus the particles A and B can be identified as Ni2Si and Ni3Si2, respectively. It is considered that the difference of composition between the particles originates in the lack of uniformity of Ni consumption, as seen in Fig. 2b and Fig. 4. From the combination of TEM analysis for physical characterization, and Fourier spectrum analysis of the lattice images for structure information, we can determine the multiple phases of Ni and Si that form and are stable in the different temperature regimes studied. Figure 7 summarizes the evolution of Ni-Si phases that were found to co-exist in the three temperature regions. Small islands of Ni2Si and Ni3Si2 observed at intermediate temperatures were not included in the schematic illustration of nickel silicide formation process for simplicity.
a) At the lower temperature region studied, approximately 493K, besides un-reacted Ni, Ni2Si is abundant, as expected. Surprisingly, evidence of NiSi2, a silicide normally found at higher temperatures was also observed. From Fourier spectrum analysis it is concluded that this is non-fluorite NiSi2 (as differentiated from the higher temperature fluorite type structure). More analysis is warranted to understand the conditions for existence of this phase. b) At the medium temperature region, approximately 670K, all the Ni is reacted to form stable, low resistivity NiSi. c) At the higher temperature region of approximately 970K, NiSi begins to convert to the highly stable, fluorite structure NiSi2. This phase is not usually used for semiconductor interconnects due to its higher resistivity characteristics, as well as its higher formation temperature.
a
b
SUMMARY Local structures appearing in a sequential formation of nickel silicide has been observed by HRTEM. An initial phase, to form silicide, was found at the interface between Ni(Ni2Si) and the Si substrate in specimens as-sputtered and after heat treatment at 498K. The phase can be considered as the non-fluorite type, NiSi2. After annealing at higher temperature, the thin NiSi2 layer disappeared and the NiSi phase grew dominantly. At the interface of NiSi/Si, the crystal lattices belonging to NiSi and Si joined smoothly, because the lattice mismatch between NiSi and Si was absorbed by lattice distortion within a few atomic layers. Ni-rich phases left in the NiSi phase that was formed, were identified by using the Fourier spectrum of their lattice fringe. As a result of the analyses, a Ni3Si2 phase was found in addition to the Ni2Si phase. The findings in this study are useful not only in the field of LSI technology, but also in further investigations about metal silicides.
c
Ni
Ni2Si
NiSi
Ni2Si
NiSi
NiSi 2
REFERENCES
*NiSi2 Si
Si
Si
~470K
~670K
~970K
Figure 7. Summary of Ni-Si phases studied as a function of temperature. (* denotes nonfluorite NiSi2 structure.)
[1] R.W.G. Wyckoff, Crystal Structure, 2nd ed. vol. 1 p. 242, (Interscience, New York, 1965) [2] F. Bosselet, J. Viala, C,Colin B. Mentzen, J. Bouix, Mater. Sci. Eng., 167 (1993) 147 [3] M. Hansen, Constitution of Binary Alloys, 2nd ed. (Metallurgy and Metallurgical Engineering Series) p. 1039, (McGraw-Hill, USA, 1958) [4] F. d’Heurle, J. Appl. Phys. 55 (1984) 4218 [5] K. N. Tu, G. Ottaviani, U. Gösele, and H. Föll, J. Appl. Phys., 54 (1983) 758 [6] Y. J. Chang and J. L. Erskine, Phys. Rev., B28 (1983) 5766