High-throughput Computing to Enhance Intervisibility Analysis M.J. Mineter1, S. Dowers1, D.R. Caldwell2, and B.M. Gittings1 1
Institute of Geography, School of GeoSciences University of Edinburgh, Drummond Street, Edinburgh EH8 9XP, Scotland Tel +44 131 650 2662 Fax +44 131 650 2524 Email {mjm, sd, bruce}@geo.ed.ac.uk 2
U.S. Army Engineer Research and Development Center, Topographic Engineering Center 7701 Telegraph Road, Alexandria, VA, 22315-3864, USA Tel +1 703-428-6802 X2236 Fax +1 703-428-6425 Email:
[email protected]
Abstract In seeking new approaches to intervisibility analyses a Complete Intervisibility Database is generated: visible regions of the DEM, for each post of a Digital Elevation Model, are derived and held. Issues of computation time, data volume and methods for building applications to exploit the CID are addressed in this paper. High-throughput computing makes tractable the computation times, by allowing many related tasks to be invoked and run without synchronisation on multiple networked processors. The Condor middleware was used to harvest otherwise wasted processing time on machines in a computing laboratory, so enabling concurrent use of up to 37 processors running Windows. In an initial run these methods reduced the elapsed time for the CID generation, processing that requires 60 CPU hours for a trial DEM dataset of 336 columns and 466 rows, to 3hours 26minutes. By holding 16 visibility analyses in one Band Interleaved by Line file, compressed using zip, the resulting database was ~3% of the uncompressed size (2.9Gb). Java applications were developed to interrogate and process the CID. These generate descriptive surface metrics and interactive tactical decision aids. Results were visualized by extending the ESRI ArcMap application. These approaches illustrate the general point that the increasing availability of high performance computation opens opportunities for new analyses, including some that were previously considered impractical.
1. Introduction The viability and accessibility of high performance computation is increasing as never before, as networked processors are used as a meta-computing platform and emerging Grid technologies facilitate access to remote computational resources. Yet, the application of these technologies in GIS remains rare. The expectations of those developing GIS applications are still largely determined by the capabilities of commercial software running analyses on single processors, albeit with benefits from continuing advances in processor power, powerful servers and web services offering both data and computation. As argued elsewhere (Dowers et al, 2000) components implemented on high performance architectures could now be routinely integrated with GISystems, enabled by the emerging standards from the OGC and also the Web service and Grid computing communities. Within high-performance computation, a classification can be made into parallel processing (in which a single task is shared by multiple co-operating processors) and high-throughput computing (in which many related tasks are each run without synchronisation, each on its own processor.) Prominent amongst the latter is the Search for Extraterrestrial Intelligence (SETI@home, 2002). As Kidner (2001) has written in the context of interpolation algorithms, the availability of high performance computing reopens scope for approaches that had previously been discarded as impractical. Intervisibility is such an example, for in analyses based on visibility it is routine to seek relatively complex algorithms to reduce computation times. We explore the alternative route, in applying highthroughput computing to intervisibility analyses, so achieving relative algorithmic simplicity and opening possibilities for new applications using intervisibility data. In the current implementations, the computational architecture comprises networked processors inside an Internet firewall. The emphases of this paper are on 1. The use of high-throughput computing to create a “Complete Intervisibility Database” (CID) comprising a bitmap termed a Masked Area Plot, for each post of a Digital Elevation Model, the bitmap identifying the visible regions of the DEM. (Uncompressed, the CID would be (nRows*nCols)2 bits.) 2. The CID structure. 3. Integration of applications that access the CID with a GISystem. The integration in the current implementation is on the user’s desktop processor.
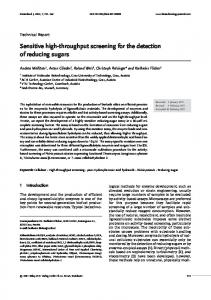
2. High-throughput computing platform for Intervisibility An initial demonstrator (Mineter et al., 2002) was built upon an in-house system, GANNET (Geographical ANalyses on NETworked computers), that distributes ArcInfo tasks to multiple UNIX processors. As shown in Figure 1, a ‘task farm’ approach was taken: one processor acts as coordinator of the task farm, and each of the remaining processors, termed “workers”, requests a new task when it is ready to process it, so ensuring the necessary flexibility in response to changing loads on different processors. The coordination was achieved using Perl, remote shells, and shared directories. The tasks were run at low priority to use spare processing capacity, and held all data on local disk space and then copied results to a final directory on a shared disk. A single task comprised the visibility analysis for 16 posts in a DEM, invoked in ArcInfo (installed on each processor) by use of AML scripts. These 16 Masked Area Plots were held in one BIL file, termed a MAP16. For analysis of a DEM of size 336 columns by 466 rows, a single task had a typical run time of between 2 and 5 minutes, depending on which processor was used: of the 13 available, 5 were 300MHz Sparcs, the remainder were older, slower processors. Over holiday periods, these were used with efficiencies between 93% and 98% so reducing the elapsed time to 43 hours 26 minutes for the total of 9828 tasks.
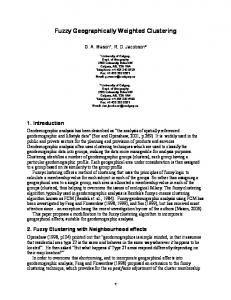
GANNET was redeveloped in a second phase, building on the Condor (2002) middleware (Figure 2). The primary reason for this development was to allow use of processors running Windows; 37 of these are available in a computing laboratory, and in general are idle overnight. Recent releases of Condor have enhanced its support for Windows, offering solutions to the issues concerning the invocation and management of remote processes on Windows, and file transfer to and from Worker processes. Using Condor also gives longer-term strategic possibilities of a) wide-area distributed processing, with Condor itself integrated with Grid middleware allowing sharing of resources beyond firewalls, and b) of parallel processing, in which case processes would inter-communicate. In high-throughput computing, as in the analyses described in this paper, the middleware (Condor, here) manages all data exchange: Figure 1 Coordinated use of multiple UNIX processors Workers
Initialises system
DEM
Receives requests
ARC/INFO Zip
Sends Tasks
Coordinator CID each worker communicates neither with each other nor with the coordinator. Jobs are submitted to Condor, and these are matched to processors according to the
characteristics chosen for the processor and the job – so, for example, Condor can be constrained to allocate a job to a processor only when that processor is otherwise lightly loaded; if an interactive user logs on, the Condor job can be terminated. On UNIX, but not Windows, Condor can checkpoint processes and migrate them to less loaded processors.
Coordinator Starts and monitors Condor jobs. Builds CID.
DEM Zip ARC/INFO
Condor
Condor
Worker processors running Windows CID intermediate files Coordinating processor Figure 2 Second phase: Using Condor with Windows processors The second phase GANNET system submits many similar tasks to Condor, and manages the recognition of failure of these tasks, resubmitting tasks if any fail. Resubmission is typically only needed after a Condor job failed to complete, because the owner of the processor logged on and was given priority. Further processing collates the results of the Condor jobs to build the desired datasets, in the present case the CID. Tasks differ from each other only in aspects that can be derived from the task identifier: in the case of intervisibility, the task identifier is used to obtain the location of the 16 observers for which visibility is derived in the task; in the case of an environmental model, it might be a random variation of a parameter that is required. Tasks are submitted to Condor in clusters: a cluster can comprise 1 or more jobs, and each job comprises one or more tasks. Each job is allocated to a different processor. The number of jobs per cluster is specified in a Condor “submit file”, a text file that also specifies the type of processor to be used, the software to be executed, and files to be copied to the target processor before a job is run, and from it to retrieve results. The cluster number is determined by Condor, and is incremented at each submission from the same user. It can subsequently be used to monitor the status of jobs, and to retrieve the history of executed jobs. There is no inter-process communication, so the task farm of the UNIX implementation in GANNET is replaced by one coordinating Perl script that monitors the number of jobs already queued or active in Condor, and
submits new clusters to Condor as jobs are completed, so ensuring that all processors can be occupied. Condor manages the queue of requested jobs – there is no direct communication between the coordinating Perl and any worker processor. Certain constraints apply to current (v. 6.4.7) release on Windows, notably that networked drives cannot be used by Condor. In general, a CID will be required to reside on a shared disk. The data derived by Condor are therefore written into intermediate files in subdirectories on the coordinating machine. On completion of the multiprocessing phase, these intermediate files are zipped and copied to the CID directory, a task requiring a few minutes. The format of the CID is discussed in the next section. In the first phase system, the overhead of starting a new task was negligible in comparison to run times, even when a task comprised only 16 visibility analyses (for observers in a 4x4 sub-grid) creating one MAP16 BIL file. In the second phase with Condor, the overhead was reduced by configuring Condor jobs to comprise multiple tasks. For an initial run with the trial dataset, 21 tasks were executed per Condor job so that 4 Condor jobs execute the analyses associated with each row of sub-grids. The full CID analysis for the trial dataset was accomplished in about 3 hours 26 minutes: times will vary according to the availability of the 37 processors. The visibility analyses in Arc/Info used a total of 60 hours of CPU time.
3. Complete Intervisibility Database The Complete Intervisibility Database (CID) comprises data showing which posts are visible from each post of a DEM. A Masked Area Plot for the post at column i and row j, MAP(i,j) contains a binary value for each post, set to 1 if that post is visible from the originally selected post at (i,j). The MAP therefore contains nCols x nRows binary values. A CID is a collection of MAP(i,j) for each post in the original grid. There are therefore nCols x nRows MAPs in the CID. In the first phase, the Complete Intervisibility Database was a collection of directories, containing files where each holds 16 MAPs. Each file held a 16-bit integer grid, the k’th bit being part of the k’th MAP. The grid was converted to a Band Interleaved by Line (BIL) format, compressed using zip and copied to the appropriate directory in the CID. The folder and file name was determined from the location of the 16 observers. By selecting the 16 observers in a 4x4 sub-grid of the original grid, there was significant correlation between the bits in a 16-bit word, and so improved compression. This database structure had the advantage of simple random access to any BIL file and expansion could be achieved using standard tools available on almost all computing platforms. In a trial for an input DEM of 336 columns by 466 rows, the compression reduced the dataset size to 86.5Mbytes, ~3% of the uncompressed size (2.9Gb). In this case the CID comprised 9828 files, with 84 files in each of 117 directories (one directory per sub-grid row). While this structure had the advantage of simplicity, it had the disadvantage of having a large number of relatively small files. The number of files grew with order O(n2) so this number would increase substantially with large DEMs. On file systems where the allocation unit or cluster size is significant, there may be a substantial amount of wasted space. In addition, there may be limits on the number of files that may stored
on a file system. To avoid this problem, a second version of the database was developed where the BIL files for a complete row are collected into a single zip file rather than (NCols/4) separate files. The names of the entries within the zip file are generated from the column of the top left post in the BIL (0_im.bil, 4_im.bil ...). The file system therefore sees (NRows/4) zip files rather than (NRows/4)*(NCols/4) files and (NRows/4) directories. For the CDROM media where the allocation unit is 2Kbytes, the trial DEM of 336 columns by 466 rows occupies 76.7 Mbytes in version 2 format as opposed to 86.5 Mbytes in version 1 format. The Java code used to read the CID was modified to recognise the version 2 format database in addition to the version 1 format and slightly optimised processing of a complete row zip coded to minimise repeated opening of the zip file. This resulted in a slight improvement in the underlying time to read a complete CID.
4. Applications built on the CID Java applications were developed to interrogate and process the CID. These generate descriptive surface metrics and interactive tactical decision aids. Visualisation of the results is within the ESRI ArcMap application, the Java running on the same processor. Extensions to ArcMap have been written using Visual Basic with ArcObjects. The VB code runs a shell script that invokes the Java, and then uses a named pipe to signal completion of the Java program to the VB. The VB and Java exchange data in temporary files, the results being displayed in ArcMap. The metrics are derived once, and held as part of the CID and are as follows: 1. Cumulative visibility (The number of posts observable from a post, derived by counting the bits in the observer’s MAP, for all posts) 2. Core Area (Contiguous area around observer location) nposts (4 and 8 connectivity) 3. Fragmentation (Number of groups of contiguous areas making up MAP) (Both 4 and 8 connectivity) The fragmentation and core area metrics are derived together, separate runs determining the metrics for 4 and 8 connectivity. The algorithm was follows: Copy a MAP into an integer raster, setting cells to -1 if the corresponding MAP cell is 1. Seed fill from the observer location for polygon identifier (id) 1 For each row For each col If pixel = -1 Allocate a new id Seedfill from this location End if End for End for The seedfill uses a recursive algorithm to fill the complete span of contiguous cells either side of the seed point, and then, based on connectivity (4 or 8) to set the size of
span to be tested on both adjoining lines. If any adjoining cell is -1, then seedfill is called again. By summing the number of pixels in each polygon (or fragment) the core area can also be derived: it always has a polygon id of 1. The interactive tactical decision aids allow: 1. the user to define a subset of posts, from a graphic, a raster, or from a feature. The Java code determines the number of posts in the subset that are visible from each post in the DEM; these are returned to ArcMap in a raster. 2. a table to be derived to hold for each post in the DEM, the location of the masked area plot or plots that covers the post and has the maximum number of visible posts. The table is accessed from the user interface in ArcMap. The use of the metrics and TDA’s is discussed elsewhere (Caldwell et al., 2003).
5. Summary The use of high-throughput computing makes tractable the run-times inherent in generating a “Complete Intervisibility Database” by enabling the concurrent execution of multiple ArcInfo commands on multiple processors. The multiprocessing was initially implemented for UNIX processors, with Perl, remote shell invocation and shared disks. A second phase system used processors running Windows, and was based on the Condor middleware. Readily available methods of compression have been demonstrated in reducing data volumes to easily manageable levels: for a test dataset of 336 columns by 466 rows both the Java applications and the CID can be held on one CD. Integration of the resulting CID with the ArcGis desktop was accomplished by coupling ArcMap to applications written in Java.
6. Acknowledgements The University of Edinburgh acknowledges support from the US Army European Research Office. This research was sponsored by and in collaboration with the US Army Engineer Research and Development Center.
7. References CALDWELL, D.R., MINETER, M.J., DOWERS, S., AND GITTINGS, B.M., 2003, Analysis and Visualization of Visibility Surfaces, Submitted to GeoComputation CONDOR, 2002, The Condor Project Homepage http://www.cs.wisc.edu/condor/ accessed 28 Feb 2003 DOWERS S., B.M.GITTINGS, M.J.MINETER, 2000, Towards a framework for high-performance geocomputation: handling vector-topology within a distributed service environment, Computers, Environment and Urban Systems, 24, 471-486
KIDNER, D. (2001) DEM Interpolation – why settle for less? Geocomputation 2001, http://www.geocomputation.org/2001/papers/kidner.pdf accessed 28 Feb 2003 MINETER, M., DOWERS, S., AND GITTINGS, B., 2002, Software Infrastructure to Enable Parallel Spatial Data Handling: Final Technical Report. R&D 8707-EN-01 Contract N68171 00 M 5807. London: U.S. Army Research Office. SETI, 2002, Search for Extraterrestrial Intelligence http://setiathome.ssl.berkeley.edu/ accessed 7 Dec 2002