Lie Lu. 2. , Hong-Jiang Zhang. 2 and Lian-Hong Cai. 1. 1Department of ... wonderful presentations. .... It's a gradually warped linear spectrum, with coarser.
HIGHLIGHT SOUND EFFECTS DETECTION IN AUDIO STREAM噛 Rui Cai1, Lie Lu2, Hong-Jiang Zhang2 and Lian-Hong Cai1 1
2
Department of Computer Science and Technology Tsinghua University Beijing, 100084, China
Microsoft Research Asia 3/F, Beijing Sigma Center, 49 Zhichun Road, Beijing, 100080, China
This paper addresses the problem of highlight sound effects detection in audio stream, which is very useful in fields of video summarization and highlight extraction. Unlike researches on audio segmentation and classification, in this domain, it just locates those highlight sound effects in audio stream. An extensible framework is proposed and in current system three sound effects are considered: laughter, applause and cheer, which are tied up with highlight events in entertainments, sports, meetings and home videos. HMMs are used to model these sound effects and a log-likelihood scores based method is used to make final decision. A sound effect attention model is also proposed to extend general audio attention model for highlight extraction and video summarization. Evaluations on a 2-hours audio database showed very encouraging results.
An ideal framework of sound effects detection should possess following characters: (i) high recall and precision: it should exactly locate the interested sound effects and ignore others; (ii) extensibility: it should be easy to add or remove sound effect models for new requirements. In this paper, an extensible framework and an efficient algorithm for highlight sound effects detection in audio stream is presented. HMM is used to model these sound effects, as suggested in Casey’s sound recognition tools [7]. Based on the log-likelihood scores got from each model, the final judgment is made. The rest of this paper is organized as follows. Audio features are discussed in Section 2. The highlight sound effects modeling and detection scheme is presented in detail in Section 3. The highlight effect attention model is illustrated in Section 4. In Section 5, experiments and evaluations of the proposed framework and algorithm are given.
1. INTRODUCTION
2. AUDIO FEATURE SELECTION
Audio content analysis plays an important role in video content parsing. Besides visual features, audio features are widely considered in many works, such as highlights extraction [1] and video summarization [2]. In order to extract the highlight shot more accurately, Rui [1] utilized announcer’s excited speech and baseball hit for TV baseball programs; Ma and Lu [2] proposed an audio attention model to measure the importance curve of an audio track. However, these works did not consider some general highlight sound effects, such as laughter, applause and cheer. These sounds are usually semantically related with highlight events in general video, such as entertainments, sports, meeting, and home videos. The audience’s laughter often means a humor scene in TV shows and applause in meeting often imply wonderful presentations. Detection of these highlight sound effects in audio stream is very helpful for highlight extraction and video summarization. Most of previous works on audio content analysis focused on general audio segmentation and classification [3][4][5], where an audio track is segmented and then each segment is classified into one of predefined classes. In comparison with these previous works, sound effects detection in audio stream must handle the following cases: (i) model more particular sound classes and (ii) recall the expected sound effects only and ignore audio segments not belonging to any predefined effect.
In our experiment, all audio streams are 16-bit, mono-channel, and down-sampled to 8 KHz. Each frame is of 200 samples (25ms), with 50% overlaps. Grounded on previous work in [3][4][5], two types of features are computed for each frame: (i) perceptual features and (ii) Mel-frequency Cepstral Coefficients (MFCCs). The perceptual features are composed of short time energy, zero crossing rate, sub-band energies, brightness and bandwidth.
ABSTRACT
A. Short-Time Energy Short-Time Energy (STE) provides a convenient representation of the amplitude variation over time. The STE is normalized as follow: (1) E k = E k / max (E i ) 1 ≤ i ≤ N Here Ek is the kth frame’s STE and N is the frame amount of the input audio data.
B. Average Zero-Crossing Rate Average Zero-Crossing Rate (ZCR) gives a rough estimate of frequency content, which is one of the most important features of audio signal.
C. Sub-band Energies In order to model the characteristics of spectral distribution more accurately, sub-band energies are used in our method. The entire
†
This work is performed when the first author is a visiting student at Microsoft Research Asia
0-7803-7965-9/03/$17.00 ©2003 IEEE
III - 37
ICME 2003
frequency spectrum is divided into four sub-bands at the same interval of 1 KHz. The Sub-band energy is defined as ωiH
E i = ∑ F (ω )
¹
¹
2
(1 ≤ i ≤ 4)
ω =ωiL
(2)
3.2. Sound Effect Detection 3.2.1. Framework Overview The system framework of sound effect detection is illustrated in Figure 1.
Here iL and iH are lower and upper bound of sub-band i, and then Ei is normalized as E i = E i / ∑ Ei (1 ≤ i ≤ 4)
(3)
i
D. Brightness and Bandwidth Brightness is defined as the frequency centroid. 2
Br = ∑ ω F (ω ) / ∑ F (ω ) ω
2
(4)
ω
Bandwidth is the square root of the power-weighted average of the squared difference between the spectral components and the brightness. Bw =
2 ∑ [(ω − Br ) F (ω ) ] / ∑ F (ω ) 2
ω
ω
2
(5)
E. 8 order Mel-frequency Cepstral Coefficients (MFCCs). Mel-scale gives a more accurate simulation of human auditory system. It’s a gradually warped linear spectrum, with coarser resolution at high frequencies. MFCC is one of the Melfrequency sub-band energy features. As suggested in [5], 8 order MFCCs are used in our experiment. These features are then combined as a 16-dimensional feature vector for a frame. In order to describe the variance between frames, the gradient feature of adjacent frames is also considered, and is concatenated to the original vector. Thus, we get a 32-dimensional feature vector for each frame.
3. SOUND EFFECTS MODELING AND DETECTION 3.1. Sound Effect Modeling Most sound effects can be partitioned into several statistically significant patterns. More importantly, the time evolution of these patterns is critical for sound effect modeling. While both GMM and HMM possess states which can represent such patterns, HMM also describes the time evolution between states using the transition probabilities matrix. Thus, HMM is selected to model sound effects. A complete connected HMM is used for each sound effect, with the continuous Gaussian mixture modeling each state. The component number of Gaussian mixture for each state is selected as four, since the sound effects are relatively simple and with little variation. Using more components need more training data, but give slightly improvement to the accuracy in experiments. The training data for each sound effect includes 100 pieces of samples segmented from audio-track. Each piece is about 310s long and totally about 10min training data for each class. The basic sound effect modeling process is as follows. At first, a clustering algorithm proposed in [6] is used to find a reasonable state numbers of HMM for each sound effect. In our experiment, the HMM state numbers for applause, cheer and laughter are 2, 4 and 4 respectively. And then, frame-based feature vectors are extracted for estimating the HMM parameters using the BaumWelch method, which is widely used in the field of Automatic Speech Recognition (ASR).
Figure 1. System Framework of sound effect detection
As the Figure 1 shows, a sliding window of t seconds moves through the input audio stream with t overlapping. In our experiment we choose t=1 and t=0.5 for the tradeoff of the algorithm’s efficiency and accuracy. Each data window is further divided into 25ms frames with 12.5ms overlapping, from which feature is extracted. The extracted feature vectors form an input of HMM. In order to reduce the process time, silence window is skimmed before testing on HMMs. A silence window is detected base on average short time energy and average zerocrossing rate:
¥
Average STE < δ E & Average ZCR < δ Z
¥
(6)
Here E and Z are thresholds of average STE and ZCR respectively. Non-silence window is compared against each sound effect model and then k log-likelihood scores are obtained, given that there are k sound effect models. A judgment is made using decision algorithm based on these scores. In this framework, it’s easy to add or remove sound effect model to adapt for new requirements. The recent three decisions are preserved in the Recent History Records database for a post-processing. The decision given by the algorithm is first send to the Records database and the final result is obtained after post-processing. Some simple rules are used in this post-processing. For example, considered the continuity between adjacent windows, if the consecutive three decisions are “A-B-A”, they are modified to “A-A-A”.
3.2.2. Log-likelihood Scores Based Decision Method The most important issue is how to do decision based on the loglikelihood scores. Unlike audio classification, we can’t simply classify the sliding window into the class which has the maximum log-likelihood score. Sliding window not belonging to any predefined sound effect should be ignored.
III - 38
Figure 2 illustrates the flowchart of the proposed loglikelihood based decision method. From Figure 2, each loglikelihood score is examined to see if the window data is “accepted” by the corresponding sound effect. To implement this task, an optimal decision is made by minimizing the following cost function [8], based on Bayesian decision theory,
³
and are mean and standard deviation of logwhere likelihood scores. In order to get an accurate estimation of all these parameters, it’s necessary to prune abnormal scores first. In our experiment, the abnormal score is defined as those whose are larger than 2 . In each iteration and distance with are calculated firstly, and then those abnormal ones are pruned. The iteration is stopped until there is no abnormal data in score set any more. Based on Eq. (8), each input window is examined if it is “accepted” by a sound effect. If it is accepted by a sound effect, the corresponding likelihood score, which is also considered as confidence, is added to the candidate stack, as the Figure 2 shows. After going through all the log-likelihood scores, the final decision is made as following. If the stack is empty, the input window does not belong to any registered model; otherwise, it is classified into the ith sound effect with the maximum confidence, (12) i = arg max ( p ( s | C ))
³
j
³
j
j
Figure 2. The flowchart of log-likelihood based decision
C = P (C j ) P (C j | C j )C C j |C j + P (C j ) P (C j | C j )C C j |C j (7) where CC
j |C j
and CC
j |C j
(a)
denote the costs of false rejection (FR)
and false acceptance (FA) respectively. The minimization of Eq. (7) leads to the Bayesian optimal decision rule [9]: p( s j | C j ) p( s j | C j )
≥ Rj
(8)
where sj is the log-likelihood score under HMM of sound effect Cj; p ( s j | C j ) and p( s j | C j ) are probability distributions of loglikelihood scores of the samples within and outside Cj respectively; Rj is the Bayesian threshold:
Rj =
CC j |C j CC j |C j
×
P (C j )
(9)
P (C j )
The priori probabilities are estimated based on our database. The cost of FR is set larger than that of FA, given that a high
recall ratio is more important for summarization and highlight extraction.
4. SOUND EFFECT ATTENTION MODEL Based on the location of these highlight sound effects, an extended audio attention model can be established, which describe the saliency of each sound effect. It’s very helpful for further highlight extraction and video summarization. In this paper, two characters are used to represent sound effect attention model. One is loudness, which can be represented by its energy; the other is the confidence in some sound effect class, which is represented by the log-likelihood score under corresponding HMM. These two characters are normalized as:
E = E avr / Max _ E avr Pj = exp( s j − Max _ s j )
To implement Eq. (8), p ( s j | C j ) and p( s j | C j ) are both
estimated from our database. Figure 3 (a) illustrates the scores distributions of samples within and outside the sound effect applause. These distributions are asymmetric since the loglikelihood scores are less or equal to zero. Considered that Gaussian distribution is symmetric, it’s more reasonable to approximate these distributions’ probability density function with negative Gamma distribution, as illustrated in Figure 3 (b). 1 p( s | C j ) = − α s α −1e s / b (10) β Γ(α ) where parameters and are estimated as: (11) α = µ2 /σ 2 , β = σ 2 / µ
¢ £
(b)
Figure 3. (a) log-likelihood scores distributions; (b) Approximate (a) with Gamma distribution
(13)
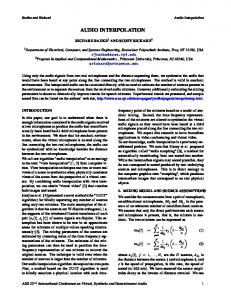
where Eavr and sj denote the average energy and log-likelihood score under model j of an audio segment respectively. Max_Eavr and Max_sj are the maximum average energy and log-likelihood score under model j in an entire audio stream. Then the attention model for class j is defined as: (14) M j = E ⋅ Pj Figure 4 illustrates the sound effect attention curves of three effects, which include laughter, applause and cheer, for 1 minute clip of the NBC’s TV show “Hollywood Square”.
III - 39
judgment, that’s why the recall of TV shows are somewhat lower than that of the table tennis match, which has a relative quiet environment. Table 2. Performance of the algorithm Sound Effect Recall Precision laughter 0.927 0.879 Hollywood applause 0.910 0.850 Square cheer 0.907 0.916 laughter 0.956 0.813 Lucky 52 applause 0.894 0.826 cheer 0.910 0.917 laughter 0.977 0.778 Table Tennis applause 0.956 0.945 Championship cheer 0.957 0.946
Video
Figure 4. Sound effect attention model curves
5. EXPERIMENTS The evaluations of the proposed algorithm are performed on our database. Three sound effects, including laughter, applause and cheer, are modeled. The training data for each sound effect includes 100 pieces of samples. Each piece is about 3-10s long and totally about 10min training data for each class. The testing database is about 2 hours videos, with different programs and different language, including NBC’s TV show “Hollywood Square” (30 min), CCTV’s TV show “Lucky 52” (60 min) and a live program record of table tennis championship (30 min). All the audio-tracks are first manually labeled. And then, the audio streams are segmented into 1-second windows with 0.5-second overlap, each window get a ground truth according to the labels. In order to estimate the log-likelihood distributions in Figure 3 more accurately, two kind distribution curves, Gaussian and Gamma distribution, are compared. Recall and precision, which is always used in retrieval system evaluation, are used to measure the performance of our system. With all other parameters kept the same, the comparison results on the 30min “Hollywood Square” are showed in Table 1. From the Table, it can be seen that Gamma distribution performs much better than Gaussian distribution. Compared with Gaussian distribution, Gamma distribution increases the precision remarkably (about 9.3%) while just affects the recall ratio lightly (about 1.8%). Table 1. Performance on different p.d.f. distribution Sound Effect Recall Precision p.d.f. laughter 0.959 0.791 Gaussian applause 0.933 0.668 cheer 0.907 0.906 laughter 0.927 0.879 Gamma applause 0.910 0.850 cheer 0.907 0.916
Results of general tests on all the 2-hours data are listed in Table 2. From Table 2, it can be seen that the performance is encouraging. The average recall is about 92.95% and precision is about 86.88% respectively. The high recall can meet the requirements well for highlights extraction and summarization. However, there still exist some mis-detections. In the table tennis championship, sometimes the reporter uses brief and exciting voice for a wonderful play, which is often detected as laughter, thus makes the laughter’s precision is a little low. Moreover, when sound effects are mixed with music, speech and other complicated environment sounds, it’s also hard to make a
6. CONCLUSION In this paper, we have presented in detail our framework and algorithm for highlight sound effects detection in audio stream. Three highlight sound effects are considered in current system: laughter, applause and cheer, which are mostly semantically related with interesting events in TV shows, sports, meeting and home videos. HMMs are used to model sound effects and a loglikelihood based method is proposed to make decision. A sound effect attention model is also proposed for further highlight extraction and summarization. Experimental evaluations have shown that the algorithm can obtain very satisfying results.
7. REFERENCES [1] Y. Rui, A. Gupta and A. Acero, "Automatically Extracting Highlights for TV Baseball Programs", Proc. of 8th ACM International Conference on Multimedia, 2000. [2] Y.-F. Ma, L. Lu, H.-J. Zhang and M.J. Li, “An Attention Model for Video Summarization”, Proc. of 10th ACM International Conference on Multimedia, 2002. [3] L. Lu, H. Jiang, and H.-J. Zhang, “A Robust Audio Classification and Segmentation Method”, Proc. of 9th ACM International Conference on Multimedia, 2001. [4] L. Lu, S. Z. Li and H.-J. Zhang, “Content-Based Audio Segmentation Using Support Vector Machines”, Proc. of IEEE International Conference on Multimedia and Expo, pp.956-959, Tokyo, Japan, 2001. [5] S. Z. Li. “Content-based classification and retrieval of audio using the nearest feature line method”, IEEE Transactions on Speech and Audio Processing, Vol.8, No.5, pp. 619-625, September, 2000. [6] T. Zhang and C.-C. Jay Kuo, “Hierarchical System for Content-based Audio Classification and Retrieval”, SPIE’s Conference on Multimedia Storage and Archiving Systems III, Boston, Nov., 1998. [7] M. Casey, “MPEG-7 Sound-Recognition Tools”, IEEE Transactions on Circuits and Systems for Video Technology, Vol.11, No.6, pp. 737-747, June. 2001. [8] R. O. Duda, P. E. Hart, D. G. Stork, Pattern Classification, John Wiley & Sons, 2001. [9] L. L. Scharf, Statistical Signal Processing: Detection, Estimation, and Time Analysis, Addison-Wesley Inc., 1991.
III - 40