Article
Highly Sensitive Colorimetric Detection of Ochratoxin A by a Label-Free Aptamer and Gold Nanoparticles Yunxia Luan 1,2 , Jiayi Chen 1,2 , Cheng Li 1,2 , Gang Xie 3 , Hailong Fu 1,2 , Zhihong Ma 1,2 and Anxiang Lu 1,2, * Received: 16 October 2015; Accepted: 1 December 2015; Published: 10 December 2015 Academic Editors: Michelangelo Pascale and Maria C. DeRosa 1
2 3
*
Agriculture Environment, Beijing Research Center for Agricultural Standards and Testing, Beijing Academy of Agriculture and Forestry Sciences, Beijing 100097, China;
[email protected] (Y.L.);
[email protected] (J.C.);
[email protected] (C.L.);
[email protected] (H.F.);
[email protected] (Z.M.) Risk Assessment Lab for Agro-products (Beijing), Ministry of Agriculture, Beijing 100097, China Grain Safety, Academy of State Administration of Grain, Beijing 100037, China;
[email protected] Correspondance:
[email protected]; Tel.: +86-10-5150-3057; Fax: +86-10-5150-3793
Abstract: A label-free aptamer-based assay for the highly sensitive and specific detection of Ochratoxin A (OTA) was developed using a cationic polymer and gold nanoparticles (AuNPs). The OTA aptamer was used as a recognition element for the colorimetric detection of OTA based on the aggregation of AuNPs by the cationic polymer. By spectroscopic quantitative analysis, the colorimetric assay could detect OTA down to 0.009 ng/mL with high selectivity in the presence of other interfering toxins. This study offers a new alternative in visual detection methods that is rapid and sensitive for OTA detection. Keywords: aptamer; Ochratoxin A (OTA); gold nanoparticles; cationic polymer; colorimetric assay
1. Introduction Ochratoxin A (OTA), a polyketide-derived secondary metabolite of Aspergillus and Penicillium strains, is a type of mycotoxin presents in grains, nuts, cottonseed and other commodities associated with agricultural products and animal feeds [1–4]. OTA is a small molecule which can cause immunosuppression and is weakly mutagenic as well as immunotoxic [5]. OTA is regarded as a potential carcinogen by the International Agency for Research on Cancer (IARC) [6]. As far as protection of consumers’ health is concerned, maximum residue limits (MRL) for OTA in foods and raw products have been established by the governments of many countries. The Codex Alimentarius Commission (CAC) has adopted an MRL of 5.0 µg/kg for OTA in food while the MRLs for different foods are in the range of 0.5–20.0 µg/kg in China [7,8]. For accurate and sensitive detection of OTA residues in food, thin layer chromatography (TLC) [9], high-performance liquid chromatography (HPLC) [10], gas chromatography (GC) [11], ultraviolet-visible, fluorescence and mass spectrometry (MS) [10,12], and enzyme-linked immunosorbent assay (ELISA) have been used [13]. Although these methods are the most commonly used, their high sensitivity and selectivity are coupled with the high costs of sophisticated equipment. Highly trained personnel are also required and the methods are not cost-effective, requiring a relatively long analysis time, so they are neither readily available in developing countries nor capable of on-site detection. Recently, some rapid detection methods based on immunoassays, such as ELISA, have been applied in mycotoxin residue detection. However, because of the difficulties in preparation of monoclonal antibodies and the limitations of proteins, these methods may be susceptible to the surrounding conditions. Therefore, it is still highly desirable to develop simpler and more sensitive methods to detect trace OTA in different samples. Toxins 2015, 7, 5377–5385; doi:10.3390/toxins7124883
www.mdpi.com/journal/toxins
Toxins 2015, 7, 5377–5385
Aptamers are single-stranded DNA or RNA that can recognize small molecules, proteins, and multiple metal ions [14–18]. Target-specific aptamers are engineered by the systematic evolution of ligands by exponential enrichment (SELEX) [19]. The technique of selecting aptamers was reported by Ellington and Gold in 1990 [20]. Aptamers not only show a high affinity and specificity for their target ligands but also exhibit excellent stability and wide applicability [21]. These properties make aptamers suitable for use in medical diagnosis, environmental monitoring and biological analysis [22,23]. Recently, there has been a tremendous increase in reports on aptamer-based biosensors (aptasensors) for OTA detection. A variety of analytical techniques based on aptamers have been developed, including colorimetric assay, fluorescence assay, and electrochemical aptasensor [24–26]. Among these methods, the analysis based upon colorimetric assay has the advantages of simplicity, rapidity, lower cost and more suitability for on-site detection. Besides, many assays require the aptamer to be labeled, which would not only make experiments relatively more expensive and complex, but may also affect the binding affinity between the OTA and aptamer and influence the sensitivity for detection [27–29]. Therefore, new analyses, especially those rapid, simple, sensitive and cost-effective methods, are highly desired for quantitative OTA detection. Herein, we develop an aptamer-based label-free approach to detect OTA using the cationic polymer poly diallyldimethylammonium chloride (PDDA) in the polymer-mediated aggregation of gold nanoparticles (AuNPs) [30]. PDDA is a cost-effective polymer with high sensitivity, better than salt with high concentration and other polymers. OTA was detected by monitoring the chromatic change of the AuNPs with the naked eye. This method is simple, rapid, and highly sensitive and extends the available detection methods for OTA. 2. Experimental 2.1. Reagents and Apparatus OTA aptamer (51 -CTGGGAGGGAGGGAGGGATCGGGTGTGGGTGGCGTAAAGGGAGCATCG GACACCCGATCCC-31 ) oligonucleotide was synthesized and then purified by HPLC (Sangon Biotechnology Co. Ltd., Shanghai, China) according to Cruz-Aguado and Penner [31]. HAuCl4 , sodium citrate and Tris-HCl were purchased from Sigma-Aldrich (St. Louis, MO, USA). Poly (diallyldimethylammonium chloride) (PDDA) was obtained from Sigma-Aldrich. All reagents were of analytical grade and the solutions were prepared with Tris-HCl buffer solution (pH 7.4). Ultraviolet-visible (UV-vis) absorbance spectra were recorded by a TU-1901/TU-1900 UV-vis spectrometer (Purkinje General, Beijing, China). Ultrapure water (Milli-Q plus, Millipore Inc., Billerica, MA, USA) was used throughout all experiments. 2.2. Preparation of AuNPs All glassware were soaked in 1:3 (v/v) HNO3 –HCl, followed by rinsing with ultrapure water and drying in an oven. AuNPs solutions were then synthesized by sodium citrate reduction of HAuCl4 [32]. In brief, 2 mL of sodium citrate was added to a boiling solution of 1 mM HAuCl4 with magnetic stirring [33]. The solution was heated for a further 20 min after changing color from grey to wine red. The solution was stirred until the temperature had dropped to room temperature. The resulting AuNPs solutions were stored in dark bottles at 4 ˝ C. 2.3. Colorimetric Detection of Ochratoxin A First, 500 µL of 5 nM PDDA (dissolved in OTA binding buffer consisting of 50 mM Tris-HCl, 120 mM NaCl, 5 mM KCl and 20 mM CaCl2 ) was mixed with 1 µL of 50 µM OTA aptamer in a 1.5 mL plastic tube. After incubation for 5 min, 500 µL of AuNPs solution was added. After a further 5 min, an appropriate volume and concentration of OTA was added into the solution and incubated for 20 min. Finally, the resulting solution was transferred into a 1 cm micro-quartz cuvette for spectral recording. The developed label-free aptamer-based assay was used for the determination of OTA
5378
Toxins 2015, 7, 5377–5385
Toxins 2015, 7, page–page
in Mao-tai liquor, a famous distilled Chinese liquor made from wheat and sorghum. Aliquots were 100‐fold diluted with OTA binding buffer. Different amounts of OTA standard solution in methanol 100-fold diluted with OTA binding buffer. Different amounts of OTA standard solution in methanol were added into 1% liquor to obtain diluted liquor samples contaminated with OTA at 0.05, 0.1, 0.5, were added into 1% liquor to obtain diluted liquor samples contaminated with OTA at 0.05, 0.1, 0.5, 1, 1, 5, 10, 50 ng/mL. The absorbance value was recorded at 520 nm. 5, 10, 50 ng/mL. The absorbance value was recorded at 520 nm.
3. Results and Discussion 3. Results and Discussion 3.1. Principles of the Colorimetric Method for Ochratoxin A Detection 3.1. Principles of the Colorimetric Method for Ochratoxin A Detection PDDA is a water-soluble cationic polymer, and serves a dual function including aggregation PDDA is a water‐soluble cationic polymer, and serves a dual function including aggregation of of AuNPs and non-specificbinding bindingto tothe theaptamer aptamer through through electrostatic electrostatic interaction. The sensing AuNPs and non‐specific interaction. The sensing mechanism approach proposed for the detection of OTA is illustrated in Scheme 1. In the absence of mechanism approach proposed for the detection of OTA is illustrated in Scheme 1. In the absence of OTA, the OTA aptamer is free and can combine with PDDA to form a “duplex” structure. AuNPs OTA, the OTA aptamer is free and can combine with PDDA to form a “duplex” structure. AuNPs could not be aggregated and the mixture maintained a red wine color. However, in the presence of could not be aggregated and the mixture maintained a red wine color. However, in the presence of OTA, the state of OTA aptamers changed from a random coil structure to a “G-quadruplex” structure. OTA, the state of OTA aptamers changed from a random coil structure to a “G‐quadruplex” structure. Subsequently, PDDA induced the aggregation of AuNPs, leading to a change in the mixture color from Subsequently, PDDA induced the aggregation of AuNPs, leading to a change in the mixture color wine red to blue. from wine red to blue.
Scheme 1. Mechanism for the poly diallyldimethylammonium chloride (PDDA)‐induced aggregation Scheme 1. Mechanism for the poly diallyldimethylammonium chloride (PDDA)-induced aggregation of AuNPs in Ochratoxin A (OTA)detection. of AuNPs in Ochratoxin A (OTA) detection.
3.2. Optimization of Experimental Conditions 3.2. Optimization of Experimental Conditions To optimize the sensing conditions, varying concentrations of PDDA (0.1, 0.5, 1, 5, 10, and 50 nM) To optimize the sensing conditions, varying concentrations of PDDA (0.1, 0.5, 1, 5, 10, and 50 nM) were added to AuNPs solutions of fixed concentration. The UV‐vis absorbance values are shown in were added to AuNPs solutions of fixed concentration. The UV-vis absorbance values are shown Figure 1. The UV intensity of AuNPs at 520 nm decreased with the addition of PDDA and the in Figure 1. The UV intensity of AuNPs at 520 nm decreased with the addition of PDDA and the absorption peak was red‐shifted to 650 nm. The relationships of the OTA concentration and the absorption peak was red-shifted to 650 nm. The relationships of the OTA concentration and the absorbance ratio (A650/A520) are shown in Figure 2. The results confirmed that 5 nM PDDA was absorbance ratio (A650/A520) are shown in Figure 2. The results confirmed that 5 nM PDDA was suitable for aggregating all AuNPs. Thus, 5 nM PDDA was used in subsequent experiments. Various suitable for aggregating all AuNPs. Thus, 5 nM PDDA was used in subsequent experiments. Various concentrations of the OTA aptamer (1, 5, 10, 25, 50, and 100 μM) were added to 1.5 mL plastic tubes concentrations of the OTA aptamer (1, 5, 10, 25, 50, and 100 µM) were added to 1.5 mL plastic tubes containing 500 μL of 5 nM PDDA and 500 μL of AuNPs solution at a fixed concentration was added containing 500 µL of 5 nM PDDA and 500 µL of AuNPs solution at a fixed concentration was added to to each solution. As the aptamer concentration increased, the amount of PDDA bound to the aptamer each solution. As the aptamer concentration increased, the amount of PDDA bound to the aptamer also increased. AuNPs were aggregated by the remaining PDDA, causing the mixture to turn blue. also increased. AuNPs were aggregated by the remaining PDDA, causing the mixture to turn blue. As shown in Figure 3, 50 μM aptamer concentrations were suitable for the reaction and the As shown in Figure 3, 50 µM aptamer concentrations were suitable for the reaction and the subsequent subsequent detection of OTA. detection of OTA.
5379
3
Toxins 2015, 7, 5377–5385 Toxins 2015, 7, page–page Toxins 2015, 7, page–page Toxins 2015, 7, page–page
Figure 1. UV‐vis absorbance spectra of AuNPs solutions in OTA binding buffer solution containing
Figure 1. UV-vis absorbance spectra of AuNPs solutions in OTA binding buffer solution containing Figure 1. UV‐vis absorbance spectra of AuNPs solutions in OTA binding buffer solution containing different concentrations of PDDA (0.1–50 nM). different concentrations of PDDA (0.1–50 nM). different concentrations of PDDA (0.1–50 nM). Figure 1. UV‐vis absorbance spectra of AuNPs solutions in OTA binding buffer solution containing different concentrations of PDDA (0.1–50 nM).
Figure 2. The variation in A650/A520 of AuNPs solutions treated with increasing concentrations of PDDA. Figure 2. The variation in A650/A520 of AuNPs solutions treated with increasing concentrations of PDDA. Figure 2. The variation in A650/A520 of AuNPs solutions treated with increasing concentrations of PDDA. Figure 2. The variation in A650/A520 of AuNPs solutions treated with increasing concentrations of PDDA.
Figure 3. UV‐vis absorbance spectra of AuNPs solutions in the presence of 5 nM PDDA treated with Figure 3. UV‐vis absorbance spectra of AuNPs solutions in the presence of 5 nM PDDA treated with increasing concentrations of OTA aptamer. increasing concentrations of OTA aptamer. 4 Figure 3. UV‐vis absorbance spectra of AuNPs solutions in the presence of 5 nM PDDA treated with Figure 3. UV-vis absorbance spectra of AuNPs solutions in the presence of 5 nM PDDA treated with 4 increasing concentrations of OTA aptamer.
increasing concentrations of OTA aptamer.
4
5380
Toxins 2015, 7, 5377–5385
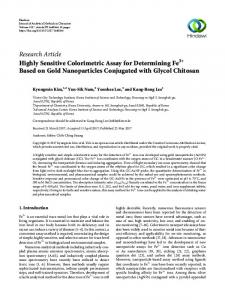
3.3. Detection of Ochratoxin A with the Label-Free Aptamer-Based Assay Toxins 2015, 7, page–page The optimized assay was applied for the detection of OTA in solutions of increasing OTA 3.3. Detection of Ochratoxin A with the Label‐Free Aptamer‐Based Assay Toxins 2015, 7, page–page concentration from 0.05 to 50 ng/mL (Figure 4A). The increase of concentrations of OTA led to The optimized assay was applied for the detection of OTA in solutions of increasing OTA a decrease in the absorbance peak at 520 nm. As can be seen in Figure 4B, the ∆A520 (decrease in 3.3. Detection of Ochratoxin A with the Label‐Free Aptamer‐Based Assay concentration from 0.05 to 50 ng/mL (Figure 4A). The increase of concentrations of OTA led to a absorbance at 520 nm compared to the solution with the 0 ng/mL OTA) was proportional to the log decrease in the absorbance peak applied at 520 nm. As detection can be seen in Figure 4B, the of ΔA520 (decrease in optimized assay was for the of OTA increasing OTA valueabsorbance at 520 nm compared to the solution with the 0 ng/mL OTA) was proportional to the log of theThe OTA concentration over the range of 0, 0.05, 0.1, 0.5, 1,in 5,solutions 10 and 50 ng/mL. The color of concentration from 0.05 to 50 ng/mL (Figure 4A). The increase of concentrations of OTA led to a the reaction system changed from red to blue (Figure 4B). Figure 4B indicated that the ratio varied value of the OTA concentration over the range of 0, 0.05, 0.1, 0.5, 1, 5, 10 and 50 ng/mL. The color of decrease in the absorbance peak at 520 nm. As can be seen in Figure 4B, the ΔA520 (decrease in linearly with the concentration of OTA. Thus, the values of ∆A520 and the concentrations of OTA the reaction system changed from red to blue (Figure 4B). Figure 4B indicated that the ratio varied absorbance at 520 nm compared to the solution with the 0 ng/mL OTA) was proportional to the log were linearly with the concentration of OTA. Thus, the values of ΔA fitted with the equation ∆A520 = 0.532 + 0.001 lgC, and 520 the detection limit was estimated to be and the concentrations of OTA were value of the OTA concentration over the range of 0, 0.05, 0.1, 0.5, 1, 5, 10 and 50 ng/mL. The color of with equation ΔA520the = 0.532 + 0.001 lgC, and and the Slope detection limit was to be other 0.009fitted ng/mL as the calculated using Standard Deviation approach. To estimated compare with the reaction system changed from red to blue (Figure 4B). Figure 4B indicated that the ratio varied 0.009 ng/mL as calculated using the Standard Deviation and Slope approach. To compare with other linearly with the concentration of OTA. Thus, the values of ΔA 520 and the concentrations of OTA were methods, Table 1 summarizes the performance of the analytical methods for OTA determination. methods, Table 1 summarizes the performance of the analytical methods for OTA determination. fitted results with the indicated equation ΔA 520 = 0.532 + 0.001 property lgC, and the detection limit depends was estimated to be PDDA These that the optical of the solution on the These results indicated that the optical property of the solution depends on the PDDA 0.009 ng/mL as calculated using the Standard Deviation and Slope approach. To compare with other concentration, which is in turn conditioned directly by the amount of OTA, which makes it possible to concentration, which is in turn conditioned directly by the amount of OTA, which makes it possible methods, Table 1 summarizes the performance of the analytical methods for OTA determination. detect OTA by a colorimetric assay. To confirm the supposed principle of such a strategy, SEM analyses to detect OTA by a colorimetric assay. To confirm the supposed principle of such a strategy, SEM These results indicated that the optical property of the solution depends on the PDDA were analyses were employed to characterize the aggregation of AuNPs. Figure 5 showed the morphology employed to characterize the aggregation of AuNPs. Figure 5 showed the morphology change of concentration, which is in turn conditioned directly by the amount of OTA, which makes it possible AuNPs through SEM. All these results were in good agreement with our assumption. to detect OTA by a colorimetric assay. To confirm the supposed principle of such a strategy, SEM change of AuNPs through SEM. All these results were in good agreement with our assumption. analyses were employed to characterize the aggregation of AuNPs. Figure 5 showed the morphology change of AuNPs through SEM. All these results were in good agreement with our assumption.
Figure 4. (A) Sensitivity of aptamer‐based assay for OTA detection. The absorbance spectra of sensing Figure 4. (A) Sensitivity of aptamer-based assay for OTA detection. The absorbance spectra of sensing solutions treated with 0, 0.05, 0.1, 0.5, 1, 5, 10 and 50 ng/mL OTA; (B) Calibration curve for the assay. solutions treated with 0, 0.05, 0.1, 0.5, 1, 5, 10 and 50 ng/mL OTA; (B) Calibration curve for the Figure 4. (A) Sensitivity of aptamer‐based assay for OTA detection. The absorbance spectra of sensing Absorbance values were recorded at 520 nm as a function of the logarithm to base 10 of OTA solutions treated with 0, 0.05, 0.1, 0.5, 1, 5, 10 and 50 ng/mL OTA; (B) Calibration curve for the assay. assay. Absorbance values were recorded at 520 nm as a function of the logarithm to base 10 of OTA concentration. The curve was fitted to a Hill plot with a correlation coefficient of 0.987. Visible colors Absorbance values were recorded 520 plot nm with as a afunction of the logarithm of to 0.987. base 10 of OTA concentration. The curve was fitted to aat Hill correlation coefficient Visible colors of of the reaction system with various concentrations of OTA (0, 0.05, 0.1, 0.5, 1, 5, 10, 50 ng/mL). concentration. The curve was fitted to a Hill plot with a correlation coefficient of 0.987. Visible colors the reaction system with various concentrations of OTA (0, 0.05, 0.1, 0.5, 1, 5, 10, 50 ng/mL). of the reaction system with various concentrations of OTA (0, 0.05, 0.1, 0.5, 1, 5, 10, 50 ng/mL).
Figure 5. The variation in morphology of AuNPs through SEM. Images of AuNPs in solution containing Figure 5. The variation in morphology of AuNPs through SEM. Images of AuNPs in solution containing PDDA and OTA‐aptamer under the different concentrations of OTA of 0 ng/mL (A) and 1 ng/mL (B). Figure 5. The variation in morphology of AuNPs through SEM. Images of AuNPs in solution containing PDDA and OTA‐aptamer under the different concentrations of OTA of 0 ng/mL (A) and 1 ng/mL (B).
5 PDDA and OTA-aptamer under the different concentrations of OTA of 0 ng/mL (A) and 1 ng/mL (B). 5
5381
Toxins 2015, 7, page–page Toxins 2015, 7, 5377–5385 Table 1. Performance of analytical methods for Ochratoxin A (OTA) determination.
Method Recognition Part Limits of detection Time References a f −1 TLC >2 h [6] ND methods for0.05–0.93 ng∙mL Table 1. Performance of analytical Ochratoxin A (OTA) determination. HPLC‐FLD b 0.05–0.41 ng∙mL−1 >2 h [7,34] ND f LC‐MS/MS Method c Recognition Limits of detection −1 Time References 0.01–0.18 ng∙mL >2 h [35] ND fPart d −1 a ELISA 110 min [10] Antibody 0.2–5.0 ng∙mL ´1 f >2 h [6] TLC 0.05–0.93 ng¨ mL ND −1 10 min [36,37] Antibody 0.7 ng∙mL >2 h [7,34] 0.05–0.41 ng¨ mL´1 HPLC-FLD b ND f FPIA e c Antibody 0.8 μg/kg 20 min [36] >2 h [35] LC-MS/MS 0.01–0.18 ng¨ mL´1 ND f Antibody 11045 min min [10] 0.2–5.0 ng¨ mL´1−1 ELISA d [38] Aptamer 2–5 ng∙mL Antibody 10 min [36,37] 0.7 ng¨ mL´1 Aptasensor based on −1–0.07 ng∙mL−1 Aptamer 0.02 pg∙mL 30 min–1 h [39,40] Antibody 0.8 µg/kg 20 min [36] FPIA e electrochemical assay Aptamer 45 min [38] 2–5 ng¨ mL´1 Aptasensor based on Aptasensor based on Aptamer 3.6 ng∙mL−1 30 min–1 h [41] Aptamer 30 min–1 h [39,40] 0.02 pg¨ mL´1 –0.07 ng¨ mL´1 fluorescence assay electrochemical assay Aptamer‐based assay Aptasensor based on Aptamer 30 min–1 h [41] 3.6 ng¨ mL´1 fluorescence assay based on AuNPs and poly 15 min This work Aptamer 0.009 ng∙mL−1 Aptamer-based assay diallyldimethylammonium based on chloride AuNPs and poly Aptamer 15 min This work 0.009 ng¨ mL´1 diallyldimethylammonium a TLC: Thin‐layer chromatography; b HPLC‐FLD: high‐performance liquid chromatography: chloride c LC‐MS/MS: Liquid chromatography–mass spectrometry/mass spectrometry; fluorescence detection; a TLC: Thin-layer chromatography; b HPLC-FLD: high-performance liquid chromatography: fluorescence d ELISA: Enzyme‐Linked c d ELISA: Immunosorbent Assay; e FPIA: Fluorescence polarization immunoassay; detection; LC-MS/MS: Liquid chromatography–mass spectrometry/mass spectrometry; e f ND: Not detected. Enzyme-Linked Immunosorbent Assay; FPIA: Fluorescence polarization immunoassay; f ND: Not detected.
3.4. Detection Specificity 3.4. Detection Specificity The selectivity selectivity of of the the method method for for OTA OTA detection detection was was also also examined examined in in order order to to evaluate evaluate the the The feasibility and and reliability of sensing the sensing system. Small‐molecule toxins could which could potentially feasibility reliability of the system. Small-molecule toxins which potentially compete compete with OTA were added at the same concentration as OTA to the sensing solution. The signals with OTA were added at the same concentration as OTA to the sensing solution. The signals at 520 nm at 520 nm of Aflatoxin B1, B2 (AFB1, AFB2), Ochratoxin B (OTB) and OTA were calculated. As shown of Aflatoxin B1, B2 (AFB1, AFB2), Ochratoxin B (OTB) and OTA were calculated. As shown in Figure 6, in Figure 6, the presence of AFB1 and AFB2 had a negligible effect on the detection and there was the presence of AFB1 and AFB2 had a negligible effect on the detection and there was only about only about a 9.7% and 0.9% decrease of absorbance while the OTB resulted in about a 13.8% decrease a 9.7% and 0.9% decrease of absorbance while the OTB resulted in about a 13.8% decrease compared compared to the blank sample. The OTB molecular structure represents as much a part of the OTA to the blank sample. The OTB molecular structure represents as much a part of the OTA as it does as it does the chlorine derivatives of OTA, which, to some extent, still possesses the binding ability the chlorine derivatives of OTA, which, to some extent, still possesses the binding ability with the with the OTA Although aptamer. the Although the of the reaction systems similar, OTA‐induced OTA aptamer. colors of thecolors reaction systems were similar,were OTA-induced aggregation aggregation was stronger than the according interferences according to test. the specificity test. AFB2 and was stronger than the interferences to the specificity AFB1, AFB2 andAFB1, OTB displayed aOTB displayed a slight interference in the OTA detection. slight interference in the OTA detection.
Figure 6. Selectivity of the aptamer‐based assay for OTA detection. The concentrations of Aflatoxin Figure 6. Selectivity of the aptamer-based assay for OTA detection. The concentrations of Aflatoxin B1, B1, B2 and Ochratoxin B were both 0.5 ng/mL. B2 and Ochratoxin B were both 0.5 ng/mL.
6 5382
Toxins 2015, 7, 5377–5385
Toxins 2015, 7, page–page
3.5. Practicality of Ochratoxin A Detection in Liquor Samples 3.5. Practicality of Ochratoxin A Detection in Liquor Samples In In order order to to evaluate evaluate the the potential potential applicability applicability in in practical practical samples, samples, detection detection of of OTA OTA in in the the Chinese liquor sample was challenged by our aptamer-based assay. Different concentrations Chinese liquor sample was challenged by our aptamer‐based assay. Different concentrations of of standard solutions of OTA (0.05, 0.1, 0.5, 1, 5, 10, 50 ng/mL) were added into the 1% liquor. As shown standard solutions of OTA (0.05, 0.1, 0.5, 1, 5, 10, 50 ng/mL) were added into the 1% liquor. As shown in Figure 7, OTA in 100-fold diluted liquor was successfully detected with a wide linear concentration in Figure 7, OTA in 100‐fold diluted liquor was successfully detected with a wide linear concentration range and the the absorbance absorbance was was similar similar to to that that in in the the OTA OTA buffer buffer solution. solution. range from from 0.05 0.05 to to 50 50 ng/mL, ng/mL, and These results indicate that the detection method can be applied to detect OTA in real samples with These results indicate that the detection method can be applied to detect OTA in real samples with sufficient sensitivity. sufficient sensitivity.
Figure 7. Determination of OTA spiked into distilled spirit samples. Figure 7. Determination of OTA spiked into distilled spirit samples.
4. Conclusions 4. Conclusions In this this work, work, a label‐free aptamer‐based assay for rapid detection of was OTA was developed. In a label-free aptamer-based assay for rapid detection of OTA developed. PDDA PDDA was used to AuNPs mediate AuNPs aggregation instead of sodium chloride, showing a higher was used to mediate aggregation instead of sodium chloride, showing a higher sensitivity and sensitivity and preventing the interference of other cations which may be present in the solution of preventing the interference of other cations which may be present in the solution of sodium chloride. sodium chloride. The analytical approach presents several advantages compared to current OTA detection methods. analytical approach advantages compared to current OTA which detection First,The the reaction solution colorpresents changesseveral from wine red to blue in the presence of OTA, can methods. First, the reaction solution color changes from wine red to blue in the presence of OTA, be seen by the naked eye, so that test results can be acquired conveniently. Second, the limit of which can be seen by the naked eye, so that test results can be acquired conveniently. Second, the detection is as low as 0.009 ng/mL and the entire assay can be completed in less than 30 min, thereby limit of detection is as low as 0.009 ng/mL and the entire assay can be completed in less than 30 min, achieving higher sensitivity and rapid screening of OTA with respect to other analytical methods for thereby achieving sensitivity screening of are OTA with respect and to other analytical OTA determinationhigher (Table 1). Third, alland the rapid involved reagents easy to prepare reduce the cost methods for OTA determination (Table 1). Third, all the involved reagents are easy to prepare and of OTA detection compared with conventional analytical assays. As OTA has been detected in wine, reduce the cost of OTA detection compared with conventional analytical assays. As OTA has been liquor and beer, the aptamer-based assay was successfully applied to real samples of a Chinese liquor detected in wine, liquor and beer, the aptamer‐based assay was successfully applied to real samples (Mao-tai) made from wheat and sorghum, without any pretreatment. Further research should be of a Chinese liquor (Mao‐tai) made wheat and sorghum, without performed to show the applicability offrom this method for the detection of OTAany in apretreatment. large variety ofFurther foods. research should be performed to show the applicability of this method for the detection of OTA in a large Acknowledgments: variety of foods. The authors would like to express heartfelt thanks to the Ai-Liang Chen from the Chinese Academy of Agricultural Sciences. This research was supported by the National Science Foundation of China (Grant No. 41301350), the Innovation and Capacity-building Projects by Beijing Academy of Agriculture and Acknowledgments: The authors would like to express heartfelt thanks to the Ai‐Liang Chen from the Chinese Forestry Sciences (project KJCX20140302), the National Key Technology R&D Program of the Ministry of Science Academy of Agricultural Sciences. This research was supported by the National Science Foundation of China and Technology(2014BAD04B05-2). The authors express their gratitude for the support. (Grant No. 41301350), the Innovation and Capacity‐building Projects by Beijing Academy of Agriculture and Author Contributions: Anxiang Lu and Yunxia Luan conceived and designed the experiments; Yunxia Luan, Forestry Sciences (project KJCX20140302), the National Key Technology R&D Program of the Ministry of Science Jiayi Chen and Cheng Li performed the experiments; Gang Xie and Hailong Fu analyzed the data; Zhihong Ma and Technology(2014BAD04B05‐2). The authors express their gratitude for the support. contributed reagents/materials/analysis tools; Yunxia Luan and Jiayi Chen wrote the paper. Author Contributions: Anxiang Lu and Yunxia Luan conceived and designed the experiments; Yunxia Luan, Conflicts of Interest: The authors declare no conflict of interest. Jiayi Chen and Cheng Li performed the experiments; Gang Xie and Hailong Fu analyzed the data; Zhihong Ma contributed reagents/materials/analysis tools; Yunxia Luan and Jiayi Chen wrote the paper.
Conflicts of Interest: The authors declare no conflict of interest.
5383 7
Toxins 2015, 7, 5377–5385
References 1. 2.
3.
4. 5. 6. 7. 8.
9. 10.
11.
12. 13. 14.
15. 16. 17. 18. 19. 20. 21. 22.
Turcotte, A.M.; Scott, P.M.; Tague, B. Analysis of cocoa products for ochratoxin A and aflatoxins. Mycotoxin Res. 2013, 29, 193–201. [CrossRef] [PubMed] Lv, X.C.; Huang, Z.Q.; Zhang, W.; Rao, P.F.; Ni, L. Identification and characterization of filamentous fungi isolated from fermentation starters for Hong Qu glutinous rice wine brewing. J. Gen. Appl. Microbiol. 2012, 58, 33–42. [CrossRef] [PubMed] Coronel, M.B.; Marin, S.; Cano-Sancho, G.; Ramos, A.J.; Sanchis, V. Exposure assessment to ochratoxin A in Catalonia (Spain) based on the consumption of cereals, nuts, coffee, wine, and beer. Food Addit. Contam. Part A 2012, 29, 979–993. [CrossRef] [PubMed] Kuiper-Goodman, T.; Scott, P. Risk assessment of the mycotoxin ochratoxin A. Biomed. Environ. Sci. 1989, 2, 179–248. [PubMed] Al-Anati, L.; Petzinger, E. Immunotoxic activity of ochratoxin A. J. Vet. Pharmacol. Ther. 2006, 29, 79–90. [CrossRef] [PubMed] Belli, N.; Marin, S.; Sanchis, V.; Ramos, A. Review: Ochratoxin A (OTA) in wines, musts and grape juices: Occurrence, regulations and methods of analysis. Food Sci. Technol. Int. 2002, 8, 325–335. [CrossRef] Otteneder, H.; Majerus, P. Occurrence of ochratoxin A (OTA) in wines: Influence of the type of wine and its geographical origin. Food Addit. Contam. 2000, 17, 793–798. [CrossRef] [PubMed] Walker, R. Risk assessment of ochratoxin: Current views of the European Scientific Committee on Food, the JECFA and the Codex Committee on Food Additives and Contaminants. In Mycotoxins and Food Safety; Springer: Heidelberg, Germany, 2002; pp. 249–255. Santos, E.; Vargas, E. Immunoaffinity column clean-up and thin layer chromatography for determination of ochratoxin A in green coffee. Food Addit. Contam. 2002, 19, 447–458. [CrossRef] [PubMed] Tessini, C.; Mardones, C.; von Baer, D.; Vega, M.; Herlitz, E.; Saelzer, R.; Silva, J.; Torres, O. Alternatives for sample pre-treatment and HPLC determination of ochratoxin A in red wine using fluorescence detection. Anal. Chim. Acta 2010, 660, 119–126. [CrossRef] [PubMed] Olsson, J.; Börjesson, T.; Lundstedt, T.; Schnürer, J. Detection and quantification of ochratoxin A and deoxynivalenol in barley grains by GC-MS and electronic nose. Int. J. Food Microbiol. 2002, 72, 203–214. [CrossRef] Reinsch, M.; Töpfer, A.; Lehmann, A.; Nehls, I.; Panne, U. Determination of ochratoxin A in beer by LC-MS/MS ion trap detection. Food Chem. 2007, 100, 312–317. [CrossRef] Flajs, D.; Domijan, A.-M.; Ivi´c, D.; Cvjetkovi´c, B.; Peraica, M. ELISA and HPLC analysis of ochratoxin A in red wines of Croatia. Food Control 2009, 20, 590–592. [CrossRef] Chen, Z.; Tan, Y.; Zhang, C.; Yin, L.; Ma, H.; Ye, N.; Qiang, H.; Lin, Y. A colorimetric aptamer biosensor based on cationic polymer and gold nanoparticles for the ultrasensitive detection of thrombin. Biosens. Bioelectron. 2014, 56, 46–50. [CrossRef] [PubMed] O’Sullivan, C.K. Aptasensors—The future of biosensing? Anal. Bioanal. Chem. 2002, 372, 44–48. [CrossRef] [PubMed] Yang, C.; Wang, Y.; Marty, J.-L.; Yang, X. Aptamer-based colorimetric biosensing of Ochratoxin A using unmodified gold nanoparticles indicator. Biosens. Bioelectron. 2011, 26, 2724–2727. [CrossRef] [PubMed] Chen, J.; Fang, Z.; Liu, J.; Zeng, L. A simple and rapid biosensor for ochratoxin A based on a structure-switching signaling aptamer. Food Control 2012, 25, 555–560. [CrossRef] Wei, Y.; Zhang, J.; Wang, X.; Duan, Y.X. Amplified fluorescent aptasensor through catalytic recycling for highly sensitive detection of ochratoxin A. Biosens. Bioelectron. 2015, 65, 16–22. [CrossRef] [PubMed] Tombelli, S.; Minunni, M.; Mascini, M. Analytical applications of aptamers. Biosens. Bioelectron. 2005, 20, 2424–2434. [CrossRef] [PubMed] Jhaveri, S.; Rajendran, M.; Ellington, A.D. In vitro selection of signaling aptamers. Nat. Biotechnol. 2000, 18, 1293–1297. [PubMed] Han, S.R.; Yu, J.; Lee, S.-W. In vitro selection of RNA aptamers that selectively bind danofloxacin. Biochem. Biophys. Res. Commun. 2014, 448, 397–402. [CrossRef] [PubMed] Jeon, W.; Lee, S.; Ban, C. A colorimetric aptasensor for the diagnosis of malaria based on cationic polymers and gold nanoparticles. Anal. Biochem. 2013, 439, 11–16. [CrossRef] [PubMed]
5384
Toxins 2015, 7, 5377–5385
23. 24. 25.
26. 27.
28. 29.
30.
31. 32. 33. 34.
35. 36. 37.
38. 39.
40.
41.
Song, S.; Wang, L.; Li, J.; Fan, C.; Zhao, J. Aptamer-based biosensors. TrAC Trends Anal. Chem. 2008, 27, 108–117. [CrossRef] Baggiani, C.; Giovannoli, C.; Anfossi, L. Man-Made Synthetic Receptors for Capture and Analysis of Ochratoxin A. Toxins 2015, 7, 4083–4098. [CrossRef] [PubMed] McKeague, M.; Velu, R.; Hill, K.; Bardoczy, V.; Meszaros, T.; DeRosa, M.C. Selection and characterization of a novel DNA aptamer for label-free fluorescence biosensing of ochratoxin A. Toxins 2014, 6, 2435–2452. [CrossRef] [PubMed] Rhouati, A.; Yang, C.; Hayat, A.; Marty, J.L. Aptamers: A promosing tool for ochratoxin A detection in food analysis. Toxins 2013, 5, 1988–2008. [CrossRef] [PubMed] Mishra, R.K.; Hayat, A.; Catanante, G.; Ocana, C.; Marty, J.L. A label free aptasensor for Ochratoxin A detection in cocoa beans: An application to chocolate industries. Anal. Chim. Acta 2015, 889, 106–112. [CrossRef] [PubMed] Wang, C.; Dong, X.; Liu, Q.; Wang, K. Label-free colorimetric aptasensor for sensitive detection of ochratoxin A utilizing hybridization chain reaction. Anal. Chim. Acta 2015, 860, 83–88. [CrossRef] [PubMed] Park, J.H.; Byun, J.Y.; Mun, H.; Shim, W.B.; Shin, Y.B.; Li, T.; Kim, M.G. A regeneratable, label-free, localized surface plasmon resonance (LSPR) aptasensor for the detection of ochratoxin A. Biosens. Bioelectron. 2014, 59, 321–327. [PubMed] Wu, Y.; Zhan, S.; Wang, F.; He, L.; Zhi, W.; Zhou, P. Cationic polymers and aptamers mediated aggregation of gold nanoparticles for the colorimetric detection of arsenic (III) in aqueous solution. Chem. Commun. 2012, 48, 4459–4461. [CrossRef] [PubMed] Cruz-Aguado, J.A.; Penner, G. Determination of ochratoxin a with a DNA aptamer. J. Agric. Food Chem. 2008, 56, 10456–10461. [CrossRef] [PubMed] Zhang, Y.; Peng, H.; Huang, W.; Zhou, Y.; Yan, D. Facile preparation and characterization of highly antimicrobial colloid Ag or Au nanoparticles. J. Colloid Interface Sci. 2008, 325, 371–376. [CrossRef] [PubMed] Chen, H.; Wang, Y.; Wang, Y.; Dong, S.; Wang, E. One-step preparation and characterization of PDDA-protected gold nanoparticles. Polymer 2006, 47, 763–766. [CrossRef] Marino-Repizo, L.; Kero, F.; Vandell, V.; Senior, A.; Isabel Sanz-Ferramola, M.; Cerutti, S.; Raba, J. A novel solid phase extraction-ultra high performance liquid chromatography-tandem mass spectrometry method for the quantification of ochratoxin A in red wines. Food Chem. 2015, 172, 663–668. [CrossRef] [PubMed] Zhang, X.; Ou, X.; Zhou, Z.; Ma, L. Ochratoxin A in Chinese dried jujube: Method development and survey. Food Addit. Contam. Part A 2015, 32, 512–517. Zezza, F.; Longobardi, F.; Pascale, M.; Eremin, S.A.; Visconti, A. Fluorescence polarization immunoassay for rapid screening of ochratoxin A in red wine. Anal. Bioanal. Chem. 2009, 395, 1317–1323. [CrossRef] [PubMed] Lippolis, V.; Pascale, M.; Valenzano, S.; Porricelli, A.C.R.; Suman, M.; Visconti, A. Fluorescence Polarization Immunoassay for Rapid, Accurate and Sensitive Determination of Ochratoxin A in Wheat. Food Anal. Methods 2014, 7, 298–307. [CrossRef] Cruz-Aguado, J.A.; Penner, G. Fluorescence Polarization Based Displacement Assay for the Determination of Small Molecules with Aptamers. Anal. Chem. 2008, 80, 8853–8855. [CrossRef] [PubMed] Yang, L.; Zhang, Y.; Li, R.; Lin, C.; Guo, L.; Qiu, B.; Lin, Z.; Chen, G. Electrochemiluminescence biosensor for ultrasensitive determination of ochratoxin A in corn samples based on aptamer and hyperbranched rolling circle amplification. Biosens. Bioelectron. 2015, 70, 268–274. [CrossRef] [PubMed] Mishra, R.K.; Hayat, A.; Catanante, G.; Istamboulie, G.; Marty, J.L. Sensitive quantitation of Ochratoxin A in cocoa beans using differential pulse voltammetry based aptasensor. Food Chem. 2016, 192, 799–804. [CrossRef] [PubMed] Yao, L.; Chen, Y.; Teng, J.; Zheng, W.; Wu, J.; Adeloju, S.B.; Pan, D.; Chen, W. Integrated platform with magnetic purification and rolling circular amplification for sensitive fluorescent detection of ochratoxin A. Biosens. Bioelectron. 2015, 74, 534–538. [CrossRef] [PubMed] © 2015 by the authors; licensee MDPI, Basel, Switzerland. This article is an open access article distributed under the terms and conditions of the Creative Commons by Attribution (CC-BY) license (http://creativecommons.org/licenses/by/4.0/).
5385