As demonstrated in recent disasters such as the 1994 Northridge and 1995 Hyogoken-Nanbu (Kobe) earthquakes, urban areas can suffer potentially large ...
Proc. of the 7th U.S.-Japan Workshop on Earthquake Disaster Prevention for Lifeline Systems, Seattle, Washington, USA, Nov. 4-7, 1997.
HIGHWAY SYSTEM PERFORMANCE MEASURES AND ECONOMIC IMPACT
Stephanie E. Chang(1) and Nobuoto Nojima (2)
(1)
Project Engineering Economist EQE International, Inc. (2)
Assistant Professor Department of Civil Engineering Hiroshima Institute of Technology
ABSTRACT
As demonstrated in recent disasters such as the 1994 Northridge and 1995 Hyogoken-Nanbu (Kobe) earthquakes, urban areas can suffer potentially large economic losses when highway transportation systems are damaged in seismic events. This paper addresses the development of performance measures for highway systems that are suitable for estimating the economic impact of earthquake damage. Economic impact is here defined as the loss of economic production or output levels (e.g., gross regional product) in the area affected by the disaster which may be caused either directly or indirectly by highway service disruption. It does not refer to the cost to repair physical damage. In this paper, summary measures of system performance are proposed and evaluated using data from Northridge and Kobe. Particular attention is paid to the improvement in system performance as damaged portions of the network are restored in the weeks and months following the earthquake. Using actual traffic volumes as an indicator of economic activity in the restoration period, an explanatory model is developed for the Kobe case using multiple regression analysis. Highway system performance is found to be the most important factor influencing traffic recovery, but its influence varies with the phase of restoration. A framework is then proposed by which this model can be used to estimate the reduction in economic losses associated with alternative repair strategies and pre-earthquake mitigation measures.
INTRODUCTION Recent earthquake disasters such as the 1989 Loma Prieta, 1994 Northridge, and 1995 HyogokenNanbu (Kobe) events have demonstrated the seismic vulnerability of highway systems and the significance of the ensuing economic impact. In addition to engineering studies of highway bridge damage, several studies have investigated the consequences of the damage in terms of travel behavior and regional economic impacts (e.g., Giuliano et al. 1996, Gordon et al. 1996). However, few studies have utilized a systems perspective to analyze the link between structural damage and economic impact. While existing earthquake loss estimation models can indicate the likely pattern of damage to highway bridges, an evaluation of the entire system’s performance is needed to estimate the economic consequences. Wakabayashi and Kameda (1992) perform network reliability analysis to explain traffic conditions in Loma Prieta but do not consider overall performance measures. Basoz and Kiremidjian (1995) utilize a bridge importance measure based on network connectivity analysis in their methodology for bridge retrofit prioritization but also do not measure system performance. Chang (1996) models the economic impact of transportation and other lifeline disruption in the Hyogoken-Nanbu earthquake but employs a simplified transportation measure that does not consider systems aspects. This paper develops and applies performance measures for highway systems damaged by earthquakes. It focuses on developing summary measures that can be readily used for economic impact modeling, as well as for identifying effective mitigation and reconstruction prioritization strategies. Economic impact in this case refers to the loss of economic production or output levels (e.g., gross regional product or GRP) due directly and indirectly to highway system damage, rather than the actual cost to repair damage. Figure 1 provides a conceptual framework for this analysis: earthquake damage to highway structures such as bridges provide the input to assessing system performance through summary measures, which in turn provide inputs to models of the ensuing economic loss. These disaster outcomes can be influenced by two types of policy options -- pre-earthquake seismic retrofit, which affects initial damage states, and restoration speed and prioritization strategies, which affect the system performance measures during the restoration period. This paper focuses on quantifying Links 1 and 2 in the figure, that is relating damage to system performance measures and relating performance measures to economic loss. Once these links are developed, the model can be used to evaluate the loss reduction impact of various risk reduction policy options. To establish Link 1, we use data from the Northridge and Hyogoken-Nanbu earthquakes in a comparative analysis. To investigate Link 2, we focus on the latter disaster only. Summary highway system performance measures can potentially be advantageous for making comparisons across disaster events, thus leading toward generalized rather than case study evaluations of highway damage impact. They can also be useful for rapid, real-time earthquake loss estimation in a disaster. Such measures should therefore be simple to implement and require only data that will be readily available after a disaster. For utility lifelines such as water, electric power, natural gas and
telecommunications, some researchers have measured system restoration in terms of the percentage of households with service restored (e.g., Takada and Ueno 1995). This measure cannot, however, be directly applied to transportation systems. The paper first provides a brief overview of highway damage and restoration in the Northridge and Hyogoken-Nanbu earthquakes. It then proposes measures of highway system performance and implements the measures for the two disasters. Further analysis develops a model for relating economic impact to highway system performance. The paper concludes with a discussion of potential applications and areas for future research.
HIGHWAY DAMAGE AND RESTORATION IN NORTHRIDGE AND KOBE
The January 17, 1994 Northridge earthquake (Mw=6.7) caused damage to 286 state highway bridges, of which seven major ones collapsed (Caltrans 1994). This caused severe disruption to four critical highway routes in the northwestern Los Angeles metropolitan area -- Interstate 5 (I-5), State Route 14 at the interchange with I-5, State Route 118, and Interstate 10. On I-5 at the Gavin Canyon crossing, a detour was opened on January 29 and I-5 was reopened on May 18, four months after the earthquake. At the I-5/SR-14 interchange, limited detours were implemented using undamaged connectors and truck bypasses. Contractors completed reconstruction of two of the four ramps in July and the remaining two in November. On SR-118, damage caused closure of over 9 miles of the highway west of the junction with I-210, and detours were implemented on local streets. In mid-February, partial restoration reopened about 5 miles of highway and allowed reduced-lane highway usage to replace detours on local streets. Reconstruction was completed in September. On I-10, bridge collapses occurred at La Cienaga/Venice Boulevards and at Washington Boulevard/Fairfax Avenue. Detours on local arterial streets were implemented during reconstruction. The mainline was reopened on April 12, less than 3 months after the earthquake. (Caltrans, private communication, March 1997) The January 17, 1995 Hyogoken-Nanbu earthquake (M=7.2 on the Japan Meteorological Agency (JMA) scale) caused severe damage to highway structures and disruption to the highway network in the Hanshin area including the Hanshin Expressway, Meishin National Expressway and Chugoku National Expressway. The most significant damage occurred to Hanshin Expressway Route 3. Before the earthquake, Route 3 shared approximately 40 percent of east-west corridor traffic at the Ashiya River screen line at the boundary between Kobe and Ashiya cities (average daily traffic (ADT)=252,800), providing an important connection between the Osaka and Kobe metropolitan areas. Approximately half of the 1,175 piers in Hyogo Prefecture suffered major to minor damage. Major damage included turnover of 18 spans at Higashinada-ward in Kobe city and collapse of 10 spans at disparate locations in Nishinomiya and Kobe cities, leaving 13 sections (approximately 28km) closed to traffic. Reopening of small isolated portions began in February 1996, but functional
performance in terms of traffic volumes on Route 3 was not much improved because the east-west traffic connection was not yet reestablished. Finally on September 30, 1996, more than 20 months after the earthquake, the entire route was reopened, completing restoration of damage to the entire regional highway system. National Route 43, a surface artery parallel to Route 3, was unfortunately degraded due to reconstruction work on Route 3. On Hanshin Expressway Route 5 (pre-quake ADT=28,300 at Ashiya River screen line), collapse of the Nishinomiya-ko Bridge and major damage to three bridges occurred. After partial reopening, Route 5 began to serve as a main alternative to Route 3, together with Routes 7 and 16, which did not experience physical damage. During the daytime, access was limited to emergency transportation for reconstruction work and disaster relief activities based on the Road Traffic Act. On the Meishin National Expressway, viaducts suffered severe damage between Toyonaka Interchange(IC) and Nishinomiya IC. Pre-quake traffic volumes in the affected sections were approximately 50,000 to 70,000 in ADT. While even the worst-damaged sections were opened to traffic with reduced lanes after February 25, 1995, traffic volume was reduced to 30 to 55 percent of pre-quake levels because the direct connection with Hanshin Expressway Route 3 was lost and access was allowed for emergency transportation only during the daytime. On the Chugoku National Expressway, damage to the viaduct between Toyonaka IC and Nishinomiyakita IC (pre-quake ADT=98,700) caused closure of the main connector between the Chugoku/Kyusyu and Kansai/Kanto regions. Despite relatively short-term closure, the nationwide economy had been significantly affected because of additional origin-destination (OD) distance, OD travel time, and suspension of various activities. In mid-February 1995, 4 lanes were opened to traffic (out of 6). Since then, Chugoku National Expressway served as an alternate route to Hanshin Expressway Route 3, etc., carrying approximately 10 to 20 percent additional traffic volume.
MEASURES OF POST-DISASTER NETWORK PERFORMANCE
Proposed Measures In order to effectively compare highway system performance across earthquake disasters, new measures or indices are needed. Performance measures traditionally used in transportation engineering are generally inappropriate for assessing post-disaster situations. These traditional measures typically address conditions at individual locations and focus on measuring traffic congestion. One measure of overall system performance that is sometimes used consists of total travel time on the network in vehicle-hours, that is the sum over all system links of the number of vehicles multiplied by travel time on each link. However, in a post-disaster situation, this measure is not practical because the availability of
travel time data is very limited. In a post-disaster situation, performance measures are required which emphasize physical condition and network functionality. Chang and Nojima (forthcoming) proposed and tested four measures of highway system performance. These measures were found to be promising, and two of them are utilized in the current analysis: 1. Total length of highway open (measure L); 2. Total “connected” length of highway open (measure C). Each is estimated as the ratio of post-earthquake to pre-earthquake conditions and ranges from 0 (system non-functional) to 1 (system fully functional). Measure L reflects the length of highway in the network that is open to traffic. Measure C attempts to capture the functionality of the highway system by recognizing the remaining degree of connectedness within the network. Note that in the case of a linear network, K is equal to 1. C=
1 2 lm ,k ∑ K k ∑ m
where
∑l
2 n, k
n
k = 1, 2,..., K
(1)
l = connected length in damaged network (i.e., length between terminal nodes) l = connected length in intact network m = index for connected segments of damaged network n = index for connected segments of intact network k = index for route directional group K = total number of route directional groups being considered.
These measures require only information on pre-earthquake network configuration, pre-earthquake traffic volumes, and post-earthquake physical damage and restoration patterns. As will be discussed below, adjustments can also be made to take into account the ameliorative effects of surface road detours around highway damage sites during reconstruction. Detours restore a portion of the connectedness of a damaged route. A fundamental question concerns the relevant network to be analyzed. Too spare or limited a network would not adequately capture the extent of damage or availability of alternate routes, thus overestimating the deterioration in system condition. Too extensive a network would dilute the significance of the damage and provide little useful information. One approach is to consider the area of physical damage to the highway system together with major alternate routes that are undamaged. Application to Northridge and Kobe
Analysis of damage following the Northridge earthquake focused on the four areas of major highway bridge damage on I-5 (Gavin Canyon and SR-14 interchange), I-10, and SR-118. The relevant network was defined to include routes significantly impacted by the earthquake damage, either directly or indirectly by serving as major highway detour routes. This area was delimited in part by the ten highway locations where Caltrans regularly collected post-earthquake traffic data. Routes were grouped into two categories, north-south and east-west. The former included: I-5 from Santa Clarita to downtown Los Angeles, SR-170/US-101 from the junction (Jct.) with I-5 to Jct. I-110, I-405 from Jct. I-5 (in L.A.) to Jct. I-105, and I-110 from Jct. I-5 to Jct. I-105. East-west routes included: SR118 from Simi Valley to Jct. I-210, US-101/SR-134 from Thousand Oaks to Jct. I-5, and I-10 from Santa Monica to Jct. I-110. Highway length and normal average daily traffic (ADT) data were obtained from the Caltrans website (http://www.dot.ca.gov/hq/traffops/traffsys/trafdata/trafdata.htm). The effect of detours onto arterial or local streets was taken into account through the use of a detour factor (see Chang and Nojima, forthcoming). Results immediately after the earthquake show that L=0.89 and C=0.84. The measures provide very similar estimates of system degradation due to the highly redundant nature of the highway network and the distribution of damage. Analysis of highway system performance in the Hyogoken-Nanbu earthquake focused on Hanshin Expressway Routes 3, 5, 7 and 16, Chugoku National Expressway (from Yokawa Jct. to Suita Jct.), and Meishin National Expressway (from Suita Jct. to Nishinomiya IC). Immediately after the earthquake, traffic was controlled in a wider area for damage inspection and emergency transport prioritization. However, because major interest herein is on more long-term impacts on the economy, the network under consideration was defined to include routes that suffered physical damage and/or served as major alternate highway routes, as listed above. Configuration of the relevant network can be represented as a linear system because of geographic properties in Hanshin area. Therefore, directional grouping was not applied in this case. Data on highway length, pre- and post-earthquake monthly ADT, and status of re-openings of damaged sections during the reconstruction period were obtained from the authorities concerned through private communications. Each measure was evaluated on a monthly rather than weekly basis. One of the reasons is data availability, and the other is longer period of traffic closure than the former two cases in the U.S., i.e., more than 20 months on Hanshin Expressway Route 3. Detour adjustments were not made to the measures since local arterial streets had insufficient capability to accommodate detouring vehicles due to damage, reconstruction work, and/or traffic control. Results immediately after the earthquake show the measures dropped to 0 due to full closure of highway networks. In February 1995, after non-damaged segments were made open to traffic, these measures rose to L=0.67 and C=0.57. Correlation with Actual Traffic Volumes
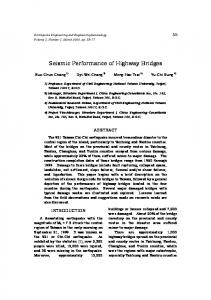
These measures were also estimated at regular time intervals as restoration of highway damage progressed. Northridge estimates were made on a weekly basis, and Kobe estimates on a monthly basis. The deterioration and restoration of system performance measures were then compared to changes in actual traffic volumes observed after the respective earthquakes. Caltrans collected areal traffic count data at 10 locations for somewhat over 5 months following the Northridge earthquake using loop counters embedded in the highway pavement. These included various locations on I-5, SR-134, SR-170, I-405, I-10, I-105, US-101, and SR-118. The unpublished data were made available for this study by the Caltrans District 7 office. Except for one case where the monthly data were reported, these counts were provided on a weekly basis. Preearthquake daily traffic data at these locations were also provided for the corresponding months in 1993. Ratios of post- to pre-earthquake ADT were estimated for each count location, and assigned to segments of the study network. In some cases, averages of two nearby count locations were assigned. These ratios were applied to base-year ADT data to approximate post-disaster ADT for each section of the network, and weighted with section length data. As noted previously, base-year ADT data pertained to 1996 conditions. The resulting weighted sum (V) indicates the ratio of system vehicle-miles of travel on a weekly basis. Figure 2 shows the restoration of traffic on a weekly basis following the Northridge earthquake. The figure also plots the restoration of performance measures L and C over this period. Both measures show fairly good correlation with actual traffic restoration. However, traffic conditions are generally lower than the performance measures in the initial period and improve more rapidly than the measures would suggest. From week 19 (early June) onward, traffic actually exceeds pre-earthquake volumes. Japan Highway Public Corporation (JH) monitors traffic count data on National Expressways at every interchange toll gate nation-wide. Hanshin Expressway Public Corporation monitors traffic count data at every on- and off-ramp on its own routes using traffic counters. Those data stored as monthly average daily traffic volumes (ADT) were made available for this study. Based on the data, time series of ADT between interchanges or ramps were compiled on a monthly basis for the study network during the pre-earthquake ordinary period and post-earthquake reconstruction period from October 1994 through October 1996. The sum of section ADT multiplied by section length adds up to total vehiclekilometers of transportation volumes over the entire study network. Normalized by pre-quake (from October through December 1994) average levels, the sum was compared with the highway performance measures. Figure 3 shows the restoration of traffic on a monthly basis following the Hyogoken-Nanbu earthquake with plots of the two performance measures. Although the measures recovered to L=0.81 and C=0.69 by May 1995, progress stalled for over a year until July 1996, when reopening of Hanshin Expressway Route 3 began to accelerate until full restoration was completed at the end of September 1996. While the performance measures exceed 0.9 after one month in Northridge, long-term degradation can be
seen in the Kobe case, which clearly indicates significantly greater impact on the local and national economy. Measure L is consistently higher than measure C. As seen in Northridge, traffic is lower than the performance measures in the initial period. Once conditions become less confused, however, traffic conditions recover rapidly. While seasonal fluctuation is clearly observed on the Chugoku National Expressway in August, it can be seen that measures L and C serve as an upper bound and an approximately lower bound, respectively. In both Northridge and Kobe, the system performance measures show good overall correlation with observed traffic patterns, but other factors are clearly also at work. Figures 2 and 3 also suggest that the relationship between highway performance measures and traffic volume occurs over 3 phases in the restoration process. In the “emergency” phase, detours around highway damage are instituted and traffic may be controlled for emergency response. In this phase, traffic volume restoration is lower than the performance measures would imply. Several weeks later, a “rapid restoration” phase begins, in which lesser and/or critical repairs are made quickly to restore the network to a temporarily stable system. In this phase, measure C appears to most closely correlate with traffic restoration, indicating that the degree of connection within the network is important and highway capacity may to some extent constrain recovery. Following this, restoration reaches a lengthy plateau during which the most difficult repairs are made. Measure L appears to correlate most closely with observed traffic during this “final restoration” phase. In the next section, we investigate some likely factors such as reconstruction activity and traffic control, in order to utilize the correlation between system performance and traffic restoration to model the economic impact of system degradation.
PERFORMANCE MEASURES AND ECONOMIC IMPACT
Methodology The findings from the correlations above suggest that performance measures C and L may be useful in modeling the economic impact of highway system damage in earthquakes. To explore this further, a model of regional economic loss due to highway damage was developed for the case of the HyogokenNanbu earthquake. The model is estimated using 21 monthly datapoints from February 1995 through October 1996.
The methodological approach consisted of applying multiple regression analysis to develop an explanatory model of observed traffic volumes over the course of the restoration period. It is assumed here that post-disaster traffic volumes provide a good general indicator of economic activity levels for this purpose. The objective of the analysis is to develop a model that is capable of explaining postdisaster traffic volumes through a number of causative factors. This model can then be used to gain insights into the economic impact of reduced highway system performance. Model development begins with the assumption that post-disaster traffic volumes are influenced by four main factors: (1) highway system performance (i.e., damage and restoration levels); (2) stage of restoration/recovery; (3) non-highway reconstruction activity; and (4) seasonal factors. The performance variable consists of either measure C or L. The restoration process is here divided into three phases, as discussed previously with reference to figures 2 and 3. The first, or “emergency phase,” consists of the period of emergency response immediately after the earthquake, in which traffic control measures were imposed, and covers February 1995. The second, or “rapid restoration phase,” extends from March 1995 through August 1995. The “final restoration phase” spans from September 1995 through October 1996. It is hypothesized that the parameters of impact of highway damage on economic loss varies across these phases. Non-highway restoration is represented by two variables, new housing starts and import/export trade through the Port of Kobe. Housing reconstruction commenced at a significant level in about June 1995 and remained high throughout the rest of the study period. Reconstruction at the Port of Kobe continued throughout the study period and had not yet been completed by October 1996. From virtually no import/export activity immediately after the earthquake, trade through the Port of Kobe recovered rapidly through the summer of 1995, but then leveled off at around 70-80 percent of preearthquake volumes. Data on housing starts and trade volumes were provided by various offices of the Kobe City government. Seasonal factors were important to consider since the data on post-earthquake monthly traffic volumes was normalized against an average for the last quarter of 1994, rather than again the corresponding month in 1994. In particular, it is noted that travel behavior is anomalous in the month of August since this is the peak travel season in Japan. In view of these considerations, the following model form was estimated using monthly data. V = α + β1 H + β2 M + β3 DA + β4 DE + β5 X + β6 (DR X) + ε where V = average daily traffic volume on highway network, 0≤V≤1 H = new housing starts in Kobe City, 0≤H≤1 M = import/export trade value through the Port of Kobe, 0≤M≤1
(2)
DA = seasonal dummy variable (=1 for August, =0 otherwise) DE = emergency phase dummy variable (=1 for Feb.’95, =0 otherwise) X = highway system performance measure (=C or L), 0≤X≤1 DR = rapid restoration phase dummy variable (=1 for Feb.’95 through Aug.’95, =0 otherwise) ε = error term Note that all explanatory variables (except dummy variables) are expressed in terms of percent of the value of the corresponding month in 1994. This model was estimated using both measures C and L, respectively, as the highway transportation performance index (X). The model specification in equation (2) utilizes three dummy variables to reflect certain assumptions. The variables DA and DE serve to increase or decrease traffic volumes for the relevant months from what the model would otherwise predict due to exogenous factors of peak travel season and emergency traffic restrictions, respectively. The variable DR, on the other hand, is used to allow for the possibility that highway system performance in the rapid restoration phase has a greater or lesser impact on traffic volumes than in the final restoration phase. That is, the impact parameter of X in the final restoration phase is β5; in the rapid restoration phase, it is β5+β6. In this model, the focus is on obtaining the best estimates possible for parameters β5 and β6. These parameters will provide some insights into the impact of highway system damage on economic activity. As an alternative to equation (2), the following model was also estimated: V = α + β1 H + β2 M + β3 DA + β4 DE + β5 (DRC) + β6 (DF L) + ε
(3)
where DF = final restoration phase dummy variable (=1 from Sept. ‘95 through Oct.’96, =0 otherwise) This specification assumes that C is the best measure of highway system performance in the emergency and rapid restoration phases, while L is the best measure during final restoration. Results Initial estimation of equations (2) and (3) yielded models with high statistical fit to the data on actual traffic volumes. However, the coefficient on the import/export variable M had a counter-theoretical negative sign. This implies that an increase in import/export trade through the Port of Kobe would decrease highway traffic volumes in the Kobe region, which is not a plausible result. The models were therefore reestimated without M.
The results suggested that the best model was equation (2) using C as the highway performance measure. While the alternatives, equation (2) using L and equation (3), had similarly high fits to the data, the statistical significance levels of the estimated parameters were notably lower, indicating that a lesser degree of confidence can be placed in these estimates. The final estimated model is: V = 0.145 + 0.028 H + 0.124 DA - 0.099 DE + 0.788 C - 0.138 DRC (0.115) (0.037)
(0.000)
(0.030)
(0.001)
(R2=0.93)
(4)
(0.000)
The t-test significance levels are shown in parentheses below each estimated coefficient. They indicate that the coefficient on each of the explanatory variables is statistically significant at least at the 5 percent level of significance. The coefficients also have the expected signs (with the exception DRC, for which there was no a priori reason to expect either a negative or a positive coefficient). This model has an adjusted R-squared value of 0.93, indicating very high explanatory power. Furthermore, the DurbinWatson test did not indicate the presence of serial autocorrelation in the error terms. Thus equation (4) appears to provide a very good explanatory model of post-disaster traffic volumes in the HyogokenNanbu earthquake. It is interesting to note that the effective coefficient on the highway performance variable C in the rapid restoration period is less than it is in the final restoration period, i.e. 0.65 (=0.788-0.138) as opposed to 0.788. This suggests that, all else being the same, a 1 percent improvement in highway performance (C) during this final restoration period actually has greater economic impact than a 1 percent improvement earlier in the process. This may be because in the Hyogoken-Nanbu earthquake, the highway segments that were restored last were central and critical to the functioning of the linear network system. Note that since all of the variables in equation (4) are in percentage units, their coefficients can be compared directly. The equation suggests that highway system performance is by far the most important factor influencing post-disaster traffic volumes. The influence of the exogenous factors, that is peak travel season and emergency traffic controls, is about 15-20 percent that of system performance. Reconstruction activity has a much smaller impact, or only about 4 percent that of system performance. The following section discusses how Equation (4) can provide a means for potentially linking highway damage in earthquakes to the impact on the regional economy. Economic Impact Framework Unlike the cost to repair earthquake damage, economic losses due to impaired lifeline service occur over a length of time, that is over the duration of service disruption. If we continue to use total traffic volume as an indicator of economic activity levels, we can express total economic loss (L) as shown in the following equation. Recall that V is the ratio of post-disaster traffic volume to pre-disaster or “normal” volume.
L = k⋅ Σ t (1-Vt) ,
t=1,2,...T
(5)
where k = constant t = time index (e.g., month) T = time to complete highway restoration
This concept is illustrated in Figure 4, which plots changes in total traffic volume over time. Assuming that traffic volumes after an earthquake drop and recover as indicated by restoration path “A” (full restoration at time TA), the total traffic volume loss over the restoration period consists of the entire shaded portion in the figure. This shaded portion is equivalent to the summation quantity in equation (5). Note that if highway damage repair proceeded more rapidly to shift the restoration path to “B” (full restoration at time TB), economic loss could be reduced by an amount proportional to the area between restoration paths “A” and “B”. Similarly, if initial highway damage could be reduced by pre-earthquake seismic retrofit to bridges, restoration path “C” might occur (full restoration at time TC), in which case economic losses could be even more substantially reduced. Equations (1) and (4) provide a promising means for estimating restoration paths such as “B” or “C” that would result from alternative mitigation and restoration policies. Holding all other variables constant, changes in individual bridge damage and restoration conditions can be summarized using equation (1) and predictions as to the change in traffic volumes can be made using equation (4), with traffic volumes being used as an indicator of economic activity as noted in equation (5).
CONCLUSIONS
This paper has developed a methodology for estimating economic loss from highway damage in earthquakes based on summary measures of highway system performance. The methodological approach emphasized simple measures that could be used to trace not only the immediate deterioration in system performance after the earthquake, but also the improvement of performance over the course of the reconstruction period. Tests using data from the Northridge and Hyogoken-Nanbu (Kobe) earthquake disasters showed that these measures demonstrate good correlation with actual highway traffic volumes in those events. Using these highway performance measures together with other variables to model changes in total traffic volume, a multiple regression model was developed for the Kobe case which demonstrated very high explanatory power (R2=0.93). An approach was then suggested for relating system performance to economic loss by using traffic volume as an indicator of economic activity levels.
Several important issues remain for further research. First, while traffic volumes are expected to provide a reliable indicator in the short term of economic activity levels (e.g., in terms of GRP), the actual relationship should be quantified in further study. Second, as far as possible, the model of traffic volume developed for the Kobe case should be tested against Northridge or other earthquake data. This includes comparisons with loss results from other economic models. However, it is anticipated that developing a similarly effective model for Northridge may be difficult due to the smaller magnitude of impacts and greater degree of “noise” from exogenous factors. Results suggest that the approach developed here could be advantageously applied for earthquake loss estimation as well as loss reduction. In particular, it can be used to estimate the potential reduction in economic loss deriving from alternative policy options (“what-if” scenarios) such as pre-earthquake mitigation and post-earthquake restoration prioritization.
ACKNOWLEDGMENTS
The authors appreciate the cooperation of Caltrans, Hanshin Expressway Public Corporation, and Japan Highway Public Corporation, and the kind advice of Prof. H. Kameda, Disaster Prevention Research Institute, Kyoto University. This study was supported on the U.S. side by the National Science Foundation (grant no. CMS-9531997).
REFERENCES
Basoz, N. and A.S. Kiremidjian. 1995. “A Bridge Prioritization Method Based on Transportation System Performance Using GIS.” Proc. 6th U.S.-Japan Workshop on Earthquake Disaster Prevention for Lifeline Systems. Tsukuba Science City, Japan: Public Works Research Institute, pp.437-449. Caltrans. 1994. The Continuing Challenge: The Northridge Earthquake of January 17, 1994, Seismic Advisory Board Report. Sacramento, Calif.: California Dept. of Transportation. Chang, S.E. 1996. “Economic Impact of Lifeline Disruption in the January 17, 1995 Hanshin-Awaji Earthquake.” Proc. Eleventh World Conference on Earthquake Engineering, Acapulco, Mexico, paper no.357. Chang, S.E. and N. Nojima. “Measuring Lifeline System Performance: Highway Transportation Systems in Recent Earthquakes,” forthcoming in Proc. Sixth U.S. National Conference on Earthquake Engineering. Giuliano, G., J. Golob, D. Bahl, W.Lee and Y.C. Liao. 1996. “Impacts of the Northridge Earthquake on Transit and Highway Use,” Lusk Center Research Institute Research Report No. LCRI-9603R. Los Angeles, Calif.: University of Southern California. Gordon, P., H.W. Richardson, and B. Davis. 1996. “Transport-Related Business Interruption Impacts of the Northridge Earthquake.” Los Angeles, Calif.: Luck Center Research Institute, University of Southern California. Takada, S. and J. Ueno. 1995. “Performance of Lifeline Systems during the 1995 Great Hanshin Earthquake.” Proc. 6th U.S.-Japan Workshop on Earthquake Disaster Prevention for Lifeline Systems. Tsukuba Science City, Japan: Public Works Research Institute, pp.165-184. Wakabayashi, H. and H. Kameda. 1992. “Network Performance of Highway Systems under Earthquake Effects: A Case Study of the 1989 Loma Prieta Earthquake.” Proc. U.S.-Japan Workshop on Earthquake Disaster Prevention for Lifeline Systems. Tsukuba Science City, Japan: Public Works Research Institute, pp.215-232.
FIGURES
POLICY OPTIONS
Seismic retrofit
Restoration speed & prioritization
OUTCOMES
DAMAGE:
EQ
- bridge # 1 - bridge # 2 • • • - bridge # n
Link 1
SYSTEM PERFORMANCE MEASURES: Initial • • • Restoration
Link 2
ECONOMIC LOSS from highway damage
Figure 1. Conceptual Framework for Economic Impact of Highway Damage
1.00 0.95 0.90
Actual Traffic (V) Measure L
0.85
Measure C 13-Jun
30-May
16-May
2-May
18-Apr
4-Apr
21-Mar
7-Mar
21-Feb
7-Feb
0.80 24-Jan
Highway Performance or Traffic Measure
1.05
Week (Mondays listed) in 1994
Figure 2. System Measures and Traffic Restoration, Northridge Earthquake
Highway Performance or Traffic Measure
1.00 0.90 0.80 0.70 0.60 0.50 Actual Traffic (V)
0.40 0.30
Measure L
0.20
Measure C
0.10 09/96
07/96
05/96
03/96
01/96
11/95
09/95
07/95
05/95
03/95
01/95
0.00
Month/Year
Figure 3. System Measures and Traffic Restoration, Hyogoken-Nanbu Earthquake
Traffic Volume “Loss” Normal Restoration Path B
Restoration Path A
Restoration Path C
Immediate Post-EQ (w/ mitigation)
Immediate Post-EQ (w/o mitigation) Earthquake
TC
TB
TA
Figure 4. Schematic Illustration of Highway Restoration Impact
Time