Histogram-Based Information Extraction
Dr. Gamal Hassan Seedahmed Dept. of Surveying Eng. Faculty of Eng. University of Khartoum
[email protected]
Transforming the Histogram into Probability Distribution • This is can be done by dividing every bin in the histogram by the total number of pixels in the image. In other words, each bin will be divided by the size of the image.
nk P( Z k ) M N k 255
P( Z
k)
1
k 0
P: probability, Zk is the intensity level, nk is the number of times that intensity Zk Occurs in the image, M x N is the number of rows and columns of the image (image size).
A MATLAB Code to compute the probability from the histogram
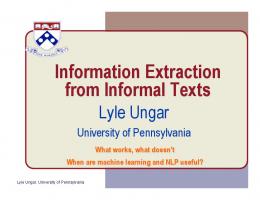
An Example of a Color Image
Histograms
Probabilities
From now on, let us call the probability density of the image: the probability density function or for short:
(pdf)
Applications of the pdf It can be use to compute: • • • • • •
The average. Variance. Normalized variance. Nth moments. Uniformity. Entropy.
These quantities can be used to characterize the image texture.
Image Average Based on the
pdf k 255
Average
k 0
Z k ( P zk )
A MATLAB Code to compute the image average
An Example
Image Variance Based on the
pdf
2
k 255
(Z k 0
k
2
Average) ( P zk )
A MATLAB Code to Compute the image variance
An Example
Normalized Image Variance Based on the
pdf 1
R 1 1
2 2
( L 1) 255 255
It is better than the variance because its value is restricted between 0 & 1.
MATLAB Code to compute the Normalized Image Variance
An Example
Nth Moments Based on the
pdf n
k 255
(Z
k
n
Average) ( P zk )
k 0
For n=0, 1, 2, 3, 4, …., ….
n
is the Nth Moments . If n=2, then this will lead to the variance.
Image Skewness Based on the
pdf 3
k 255
(Z
k
3
Average) ( P zk )
k 0
3 Skewness 3 σ
Where is the standard deviation. If skewness=0 then we have a Symmetrical pdf, if it is positive then it skewed to the right, and if it is negative then it skewed to the left.
Image Kurtosis Based on the
pdf 4
k 255
(Z
k
4
Average) ( P zk )
k 0
4 Kurtosis 4 σ
Where is the standard deviation. Kurtosis measures the peakedness of the distribution.
Image Uniformity (U) Based on the
pdf k 255
U (Z )
P( Z k 0
k)
2
MATLAB Code to Compute the Image Uniformity
An Example
Image Entropy Based on the
pdf k 255
Entropy
P( Z k ) log 2 P( Z k )
k 0
Entropy is a measure of variability. It zero for a homogenous image (all the pixels have a similar values).
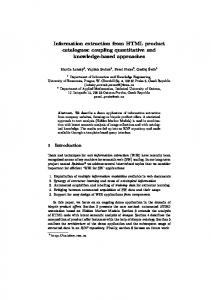
Joint Histogram • It is the frequency of occurrence of two events. • For example, we can build the joint histogram of the red and green channels of a color image. • Joint histogram can be viewed as a tool to fuse information from multiple sources. • Joint histogram is a 2D surface. • Joint histogram of the same source (e.g., red channel) with itself will produce the classical histogram along the diagonal of the 2D histogram
How to Compute the Joint Histogram
Joint Histogram for Red & Green Channels
Joint Histogram for Red & Blue Channels
Joint Histogram for Red & Blue Channels
Joint Histogram for Red & Red Channel