3722 • The Journal of Neuroscience, March 30, 2016 • 36(13):3722–3734
Development/Plasticity/Repair
Homeostatic Activity-Dependent Tuning of Recurrent Networks for Robust Propagation of Activity X Julijana Gjorgjieva,1,2 X Jan Felix Evers,3,4* and X Stephen J. Eglen2,5* 1
Volen Center for Complex Systems, Brandeis University, Waltham, Massachusetts 02454, 2Department of Applied Mathematics and Theoretical Physics, University of Cambridge, Cambridge CB3 0WA, United Kingdom, 3Heidelberg University, Centre for Organismal Studies, Heidelberg D-69120, Germany, 4Department of Zoology, University of Cambridge, Cambridge CB2 3EJ, United Kingdom, and 5Cambridge Computational Biology Institute, University of Cambridge, Cambridge CB3 0WA, United Kingdom
Developing neuronal networks display spontaneous bursts of action potentials that are necessary for circuit organization and tuning. While spontaneous activity has been shown to instruct map formation in sensory circuits, it is unknown whether it plays a role in the organization of motor networks that produce rhythmic output. Using computational modeling, we investigate how recurrent networks of excitatory and inhibitory neuronal populations assemble to produce robust patterns of unidirectional and precisely timed propagating activity during organism locomotion. One example is provided by the motor network in Drosophila larvae, which generates propagating peristaltic waves of muscle contractionsduringcrawling.Weexaminetwoactivity-dependentmodels,whichtuneweaknetworkconnectivitybasedonspontaneousactivity patterns: a Hebbian model, where coincident activity in neighboring populations strengthens connections between them; and a homeostatic model, where connections are homeostatically regulated to maintain a constant level of excitatory activity based on spontaneous input. The homeostatic model successfully tunes network connectivity to generate robust activity patterns with appropriate timing relationships between neighboring populations. These timing relationships can be modulated by the properties of spontaneous activity, suggesting its instructive role for generating functional variability in network output. In contrast, the Hebbian model fails to produce the tight timing relationships between neighboring populations required for unidirectional activity propagation, even when additional assumptions are imposed to constrain synaptic growth. These results argue that homeostatic mechanisms are more likely than Hebbian mechanisms to tune weak connectivity based on spontaneous input in a recurrent network for rhythm generation and robust activity propagation. Key words: activity-dependent; development; Drosophila; homeostasis; recurrent network; tuning
Significance Statement How are neural circuits organized and tuned to maintain stable function and produce robust output? This task is especially difficult during development, when circuit properties change in response to variable environments and internal states. Many developing circuits exhibit spontaneous activity, but its role in the synaptic organization of motor networks that produce rhythmic output is unknown. We studied a model motor network, that when appropriately tuned, generates propagating activity as during crawling in Drosophila larvae. Based on experimental evidence of activity-dependent tuning of connectivity, we examined plausible mechanisms by which appropriate connectivity emerges. Our results suggest that activity-dependent homeostatic mechanisms are better suited than Hebbian mechanisms for organizing motor network connectivity, and highlight an important difference from sensory areas.
Introduction Activity-dependent adjustment of nascent synaptic connectivity is a widespread mechanism for tuning network properties in various Received July 1, 2015; revised Jan. 31, 2016; accepted Feb. 9, 2016. Author contributions: J.G., J.F.E., and S.J.E. designed research; J.G. performed research; J.G. contributed unpublished reagents/analytic tools; J.G. analyzed data; J.G., J.F.E., and S.J.E. wrote the paper. This work was supported by Cambridge Overseas Research Fund, Trinity College, and Swartz Foundation to J.G. and Wellcome Trust VIP funding to J.F.E. through Program Grant WT075934 to Michael Bate and Matthias Landgraf. J.G. is also supported by Burroughs-Wellcome Fund Career Award at the Scientific Interface. We thank Sarah Crisp, Michael Bate, and Matthias Landgraf for useful discussions and members of the Marder Laboratory at Brandeis University.
parts of the developing brain (Kirkby et al., 2013). This activity is relayed by ordered topographic maps to higher processing centers, The authors declare no competing financial interests. *J.F.E. and S.J.E. contributed equally to this study. This article is freely available online through the J Neurosci Author Open Choice option. Correspondence should be addressed to Dr. Julijana Gjorgjieva, Volen Center for Complex Systems, Brandeis University, Waltham, MA 02454. E-mail:
[email protected]. DOI:10.1523/JNEUROSCI.2511-15.2016 Copyright © 2016 Gjorgjieva et al. This is an Open Access article distributed under the terms of the Creative Commons Attribution License Creative Commons Attribution 4.0 International, whichpermitsunrestricteduse,distributionandreproductioninany medium provided that the original work is properly attributed.
Gjorgjieva et al. • Homeostatic Tuning of Recurrent Networks
where it triggers correlated synaptic release from neighboring axonal terminals (Katz and Shatz, 1996; Tritsch et al., 2007; Huberman et al., 2008; Feller, 2009). This timing information is evaluated by postsynaptic neurons to sharpen their connectivity profile through Hebbian plasticity and thus improves network function during this early phase of circuit development. Locomotor circuits also generate spontaneous activity during embryogenesis in many organisms, including chick, mouse, fish, and fly (O’Donovan, 1999; Hanson and Landmesser, 2004; Crisp et al., 2008; Kirkby et al., 2013). These circuits are not topographically organized, yet endogenous activity patterns and synaptic release are required for coordinated motor behavior to develop (Crisp et al., 2011; Warp et al., 2012; Giachello and Baines, 2015). In Drosophila, motor neurons receive variable amounts of presynaptic input, suggesting that connectivity is plastic and acquires functional patterns in a homeostatically regulated manner (Tripodi et al., 2008; Couton et al., 2015). The underlying mechanisms that might evaluate this early spontaneous activity and establish appropriate neuronal connectivity are unclear. Computational modeling offers an efficient approach to explore the nature of the mechanisms that could underlie activitydependent tuning of connectivity in a generic motor network that achieves a particular function. Here we study the organization of one such motor network that generates rhythmic behavior, the ventral cord locomotor network of Drosophila larvae. Larvae crawl by peristaltic waves of muscle contractions, which propagate along their body axis (Berni et al., 2012; Heckscher et al., 2012). These coordinated waves travel from posterior to anterior during forward locomotion, and from anterior to posterior during backward locomotion. The locomotor behavior is produced by central pattern generators, which are segmentally repeated and modulated by sensory feedback, but can produce coordinated output even when sensory neurons are removed (Suster and Bate, 2002; Fox et al., 2006; Crisp et al., 2008). Mature crawling behavior of Drosophila larvae is preceded by uncoordinated, yet neurally controlled, muscle contractions and incomplete peristaltic waves during late embryogenesis, which gradually improve coordination before hatching (Suster and Bate, 2002; Crisp et al., 2008). Manipulating endogenous activity during this period can significantly affect the output of the circuit, suggesting that this activity helps to refine connectivity (Crisp et al., 2011; Giachello and Baines, 2015). We previously established a model for wave propagation, which produces propagating activity patterns with appropriate timing as during crawling in Drosophila larvae (Gjorgjieva et al., 2013). Although distinct connectivity parameters were shown to produce propagating waves of activity, the solution regions are complex (Gjorgjieva et al., 2013; their Fig. 5), and it is unclear how they arise during development. Here, we examine two different activity-dependent mechanisms, which can tune network connectivity during development: (1) a Hebbian plasticity model, where coincident activity between neighboring neuronal populations strengthens connections between them; and (2) a homeostatic model, where synaptic connections are modified to maintain a constant level of excitatory postsynaptic activity based on spontaneous input. We show that homeostatic mechanisms are more appropriate than Hebbian mechanisms to organize connectivity in these motor networks. We demonstrate the case by comparing peristaltic wave properties for the two models based on the final configuration of network connectivity produced by the models. We also demonstrate the robustness of activity-dependent tuning of connectivity by varying the properties of spontaneous activity to predict how manipulations of this activity during embryogenesis might impact output of the ma-
J. Neurosci., March 30, 2016 • 36(13):3722–3734 • 3723
Table 1. Network parameters for wave propagationa a
b
c
d
e
f
E
I
E
I E I
16 20 ⫺12 ⫺20 15 ⫺3 0.5 0.5 1.3 2
4
kE
kI
3.7 0.9945 0.9994
a
Default parameter values for the model simulations.
ture network. Thus, our work highlights the relative importance of homeostatic mechanisms for establishing functional connectivity in developing motor networks, in contrast to sensory networks where connectivity is more tightly constrained enabling the formation of accurate sensory maps.
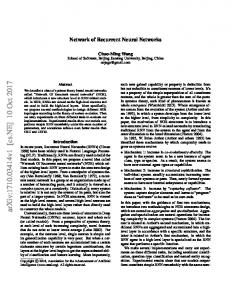
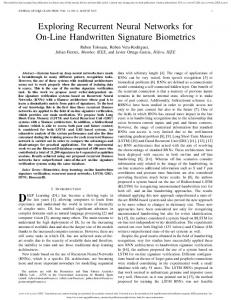
Materials and Methods Network model. The network model was based on the interaction of recurrently coupled excitatory and inhibitory populations to produce robust propagation of activity with appropriate timing relationships as observed experimentally during crawling in Drosophila larvae (Gjorgjieva et al., 2013). Such unidirectional propagation of activity is also observed in other experimental systems (see Discussion). Our model is an abstraction of neural circuits that might generate larval crawling and captures the observed coordination at the segmental level. The model contains eight coupled units of excitatory and inhibitory populations to represent the activity in the eight abdominal segments of the larva (see Fig. 1A). The activity in each segment was modeled with a Wilson-Cowan unit (Wilson and Cowan, 1972), consisting of two neuronal populations: excitatory ( E) and inhibitory ( I). These two populations represent the joint activity of all central neurons in the central pattern generator circuit for crawling but are sufficiently general to represent excitatory and inhibitory neurons in other systems. The differential equations for the timedependent variation of averaged excitatory and inhibitory neuronal activities are as follows:
E E˙ ⫽ ⫺E ⫹ 共 k E ⫺ E 兲 G E 共 aE ⫹ cI ⫹ P ext兲
(1)
I˙I ⫽ ⫺I ⫹ 共 k I ⫺ I 兲 G I 共 eE ⫹ fI 兲 ,
(2)
where the functions GE and GI represent sigmoidal response functions of the excitatory and inhibitory neuronal populations given by the following:
G共 x兲 ⫽
1 1 ⫺ , 1 ⫹ exp关⫺共 x ⫺ 兲兴 1 ⫹ exp共 兲
(3)
where represents the maximum slope of the sigmoid (or if G represents an activation function, it denotes the speed of activation) and represents the location of the maximum slope (or the threshold for activation) (Table 1). This function was chosen so that G(0) ⫽ 0 ensuring that E ⫽ 0 and I ⫽ 0 is a steady-state solution in the absence of external input (Wilson and Cowan, 1972). The terms kE and kI denote the maxima of the response functions for the excitatory and inhibitory populations (Table 1). The time constants E and I control decay of excitatory and inhibitory activities after stimulation, and determine the timescale of network activity. The connectivity coefficients a (or e) and c (or f ) represent the average number of excitatory and inhibitory synapses per cell in the excitatory (or inhibitory) population, respectively. The time-varying function Pext (t) denotes the external input applied to an excitatory population. To test whether the mature networks have sufficiently strong connections between segments to propagate a wave, waves were initiated by providing constant input Pext ⫽ 1.7 to the most posterior (anterior) segment for forward (backward) waves. During development in both Hebbian and homeostatic models, Pext (t) was a time-dependent function representing the spontaneous input into each segment (see below). To model wave propagation, we coupled eight Wilson-Cowan E-I units. Two types of connections were created between neighboring segments. First, bidirectional excitatory connections (b) between excitatory populations of neighboring segments allow activity to propagate along the segments. Second, inhibitory connections (d) from the inhibitory population in one segment to the neighboring (anterior and posterior)
Gjorgjieva et al. • Homeostatic Tuning of Recurrent Networks
3724 • J. Neurosci., March 30, 2016 • 36(13):3722–3734
excitatory populations terminate activity in each previously active segment and ensure unidirectional wave propagation (see Fig. 1). This network was equipped with symmetric bidirectional connectivity such that forward and backward propagating waves were generated with similar properties, consistent with experiments (Gjorgjieva et al., 2013). We list example parameter values that generate a functional wave in Table 1. A “contraction” in the model was defined as suprathreshold activity (activity above a threshold, 0.2 or 0.3) of the excitatory population (see Fig. 1B, inset, horizontal dashed line). Such contractions were used to implement the activity-dependent weight refinement in the Hebbian and homeostatic development models. We examined the timing relationships between neighboring segments during propagating waves of suprathreshold activity in the model by analyzing two quantities: The duty cycle was the total time that each excitatory activity is suprathreshold relative to the wave duration. The interburst interval was the time from the initiation of suprathreshold activity of one segment to the initiation of suprathreshold activity of the neighboring segment, normalized by wave duration. Weights are labeled with a superscript “f” or “b” to denote their respective role in forward or backward wave propagation, but they are both present in the network at all times (see Fig. 1). Thus, there were 28 modifiable weights: seven bif weights connecting Ei⫹1 to Ei; seven bib weights connecting Ei to Ei⫹1; seven dif weights connecting Ii to Ei⫹1; and seven dib weights connecting Ii⫹1 to Ei, where i ⫽ 兵1, … 7其. The model was initialized with weak connectivity incapable of generating waves. We considered two scenarios: (1) All the weights started identically b ⫽ ⫺d ⫽ 2; this was 10% of the values used to generate robust waves (Gjorgjieva et al., 2013). (2) The weights were independent random samples drawn from a uniform distribution in the range between 0 and 5 for excitatory weights, and ⫺5 to 0 for inhibitory weights. The final value of the weights was somewhat dependent on the initial conditions; and in general, the steady-state weights showed greater variability when starting from random initial conditions. However, the stability of the weights was unaffected. The other weights within the same segment (a, c, e, and f ) were kept fixed as in Table 1. All parameters were dimensionless, and time in the model was measured in arbitrary time units (t.u.). Developmental time. For both activity-dependent models, simulations of development were conducted for a total time of 2 ⫻ 10 5 t.u. The total simulation time depends on the time constant of weight update, the nature of spontaneous activity, and how spontaneous activity changes during development. The notion of “developmental time” in the model is useful in describing the gradual improvement of coordination in the activity patterns of the developing network. Generating spontaneous activity. As there is little quantitative characterization of spontaneous activity in the Drosophila motor network during development, here we made simple approximations to generate spontaneous activity. Inputs of strength Ri for duration Ti were applied to each excitatory population Ei (see Fig. 1). When the spontaneous input into a given population Ei was sufficiently strong, Ei became suprathreshold. At the time of threshold crossing, activity-dependent mechanisms become active to modify the weights. The duration of each spontaneous input, Ti, was a random number drawn from a uniform distribution, U(x1, x2), determining the total time for which the input of strength Ri was applied to Ei before choosing a new spontaneous input. Sampling the duration of spontaneous input from a distribution ensured that neuronal activity in different populations crossed threshold at different times as we did not want to introduce correlations in spontaneous activity. Because network connectivity is recurrent, the network itself generates a significant proportion of activity when the weights are sufficiently strong. This automatically generates correlations between the activations of neighboring segments, even though spontaneous activity itself is uncorrelated. The strength of spontaneous input, Ri, was also a random number; this input was applied to Ei for time Ti. We used a truncated Gaussian distribution with mean and variance 2 , 关N共, 兲兴⫹ , to ensure that spontaneous input remained positive. The parameters of the distribution for Ti did not greatly affect the frequency of suprathreshold events in a given excitatory population (data not shown). In contrast, Ri had a strong effect upon the frequency of threshold crossings in the model network. This was partially because
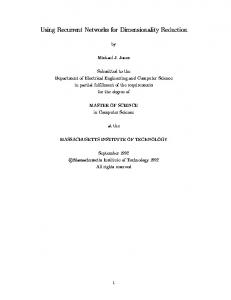
weights were modified precisely at the time when population activity crossed threshold. Therefore, we explored the effect of the distribution of Ri on the outcome of weight development in the two plasticity models. During development of Drosophila embryos, frequent random activity uncoordinated across segments gradually becomes replaced by coordinated activity ranging across several neighboring segments, with all contraction activity ceasing shortly before hatching when the larva emerges from the egg shell and starts to crawl (Crisp et al., 2008). This is consistent with a model where spontaneous activity decreases during development. To model this effect, we considered decreasing either the mean or the variance of the Gaussian distribution for Ri. In the Hebbian model, we decreased the SD in steps; however, the model was insensitive to how spontaneous activity was reduced. The homeostatic model was also robust to the decrease of spontaneous activity, although the speed of decrease of spontaneous activity affected the speed at which weights stabilized. The Hebbian bidirectional model. Weight updates followed the ratebased formulation of Hebbian plasticity: if presynaptic precedes postsynaptic activity, then the corresponding weight is potentiated or else the weight is depressed (see Fig. 2 A, B). For any two populations connected by a weight, the activity that crossed threshold first was presynaptic. For instance, if Ei⫹1 crossed threshold before Ei, then bif was potentiated, whereas bib was depressed. To implement potentiation, a small constant, ⌬⫹ ⬎ 0, was added to the weight as follows:
b fi 共t ⫹ ⌬t兲 ⫽ bif共t兲 ⫹ ⌬⫹
(4)
and similarly, if the constant for weight depression was denoted by ⌬⫺ ⬎ 0, b ib weakened:
b bi 共t ⫹ ⌬t兲 ⫽ bib共t兲 ⫺ ⌬⫺ .
(5)
Unless otherwise noted, ⌬⫹ ⫽ ⌬⫺ ⫽ 0.1. If Ei crossed threshold before Ei⫹1, then bib strengthened:
b ib共t ⫹ ⌬t兲 ⫽ bib共t兲 ⫹ ⌬⫹
(6)
b if共t ⫹ ⌬t兲 ⫽ bfi 共t兲 ⫺ ⌬⫺ .
(7)
and bif weakened:
For the inhibitory weights, if Ii crossed threshold before Ei⫹1, then dif共t兲 strengthened:
d if共t ⫹ ⌬t兲 ⫽ dif共t兲 ⫺ ⌬⫹ ,
(8)
whereas if Ei⫹1 crossed threshold before Ii, then dif共t兲 weakened:
d if共t ⫹ ⌬t兲 ⫽ dif共t兲 ⫹ ⌬⫺ .
(9)
And, similarly, if Ii⫹1 crossed threshold before Ei, then dib共t兲 strengthened:
d ib共t ⫹ ⌬t兲 ⫽ dib共t兲 ⫺ ⌬⫹ .
(10)
whereas if Ei crossed threshold before Ii⫹1, then d 共t兲 weakened: b i
d ib共t ⫹ ⌬t兲 ⫽ dib共t兲 ⫹ ⌬⫺ .
(11)
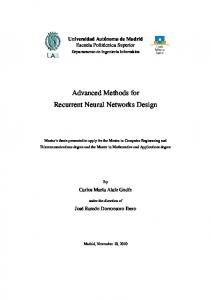
For a weight to be modified, activity of the presynaptic and postsynaptic populations connected by the weight had to be simultaneously suprathreshold. Weight changes were applied immediately after the second of the two populations connected by the weight crossed threshold. However, the model was robust to this requirement, and the weight could also be updated as the activity of each population dropped below threshold. The Hebbian efficacy model. In the Hebbian efficacy model, synchronous threshold crossing of activity in neighboring populations resulted only in weight potentiation and no depression. To ensure that weights did not grow without a bound, weight increase was limited by the frequency of contraction of the neuronal populations connected by the synaptic weight. Such activity-dependent control of the weights was motivated by the regulation of activity-dependent de-
Gjorgjieva et al. • Homeostatic Tuning of Recurrent Networks
J. Neurosci., March 30, 2016 • 36(13):3722–3734 • 3725
pression in developing motor networks (Fedirchuk et al., 1999; Crisp et al., 2008). To implement this activity-dependent synaptic depression, a “synaptic efficacy” variable was introduced in the Hebbian model (Froemke and Dan, 2002). This efficacy variable depressed to 0 at the time when the activity of a neuronal population crossed threshold (see Fig. 2C). Then, in Equations 4 and 6, when the excitatory activity in two populations crossed threshold, the excitatory weights, bif and bib, were modified by ⑀if共t兲⌬⫹ and ⑀ib共t兲⌬⫹ , respectively. Similarly, instead of Equations 8 and 10, the inhibitory weights, dif and dib, were strengthened by if共t兲⌬⫹ and ib共t兲⌬⫹ , respectively, with efficacies as follows:
再
0, ⑀ i 共 t 兲 or i 共t兲 ⫽ 1 ⫺ e⫺ 共 t⫺t ref⫺t e兲 / rec,
t ⬍ tref , t ⬎ tref .
(12)
e
Here, t denotes the time when activity of the two neuronal populations connected by the weight crossed threshold (see Fig. 2C). The efficacy was held at 0 for a refractory time period tref, after which it recovered to 1 with a time constant of rec. The refractory period was implemented to ensure that, after the weights had strengthened sufficiently to generate waves, threshold crossings of the activity in neuronal populations during propagating waves did not further modify the weights. The value of rec was chosen such that the period between two consecutive waves was larger than the refractory period tref. To equalize the frequency of threshold crossing among the different excitatory populations, an additional “end drive” was applied to the end excitatory populations, E8 and E1 (see Fig. 5). This drive was applied to one of E8 or E1 chosen randomly for a duration Ti ⫽ 3 t.u. instead of the spontaneous input Ri. We assumed that the strength of this end drive increased as spontaneous activity decreased during development, reaching a final value of 1.7. The homeostatic model. The homeostatic model was inspired by the Bienenstock-Cooper-Munro theory of synaptic plasticity (Bienenstock et al., 1982). Weight modification was bidirectional (potentiation or depression) to maintain a constant averaged activity of each excitatory population, ri, as follows:
r˙r i 共 t 兲 ⫽ ⫺r i 共 t 兲 , where ri 共t兲 ¡ ri 共t兲 ⫹ 1 when Ei 共t兲 crosses threshold. (13) The time constant r was chosen to be much longer than the timescale of neuronal dynamics. Weight potentiation or depression depended on whether the average excitatory activity in a given segment was greater or smaller than a threshold for synaptic modification, . The homeostatic model is activity-dependent; thus, in the absence of spontaneous activity ( ¡ 0), the weights in the network will not be modified. The threshold is defined to be a function of the averaged excitatory activity itself:
共 r i 共 t 兲兲 ⫽
冉 冊
r i共 t 兲 p , r0
(14)
where r0 ⫽ 2.0 was a constant and p ⬎ 1 (here, p ⫽ 1.5). The modification function depends on ri(t) and i 共ri 共t兲兲 as follows:
共 r i 共 t 兲 , 共 r i 共 t 兲兲兲 ⫽ r i 共 t 兲 ⫺ 共 r i 共 t 兲兲 ⫽ r i 共 t 兲 ⫺
冉 冊
r i共 t 兲 p . r0 (15)
Then, synaptic weight change was implemented according to the following:
b if共t ⫹ ⌬t兲 ⫽ bif共t兲 ⫹ 共ri 共t兲兲
(16)
for the forward excitatory weights, and
d ib共t ⫹ ⌬t兲 ⫽ dib共t兲 ⫺ 共ri 共t兲兲
(17)
for the backward inhibitory weights for which Ei is postsynaptic (i ⫽ {1, 2,…, 7}). Similarly,
b bi 共t ⫹ ⌬t兲 ⫽ bbi 共t兲 ⫹ 共ri⫹1 共t兲兲
(18)
for the backward excitatory weights, and
d if共t ⫹ ⌬t兲 ⫽ dif共t兲 ⫺ 共ri⫹1 共t兲兲
(19)
for the forward inhibitory weights for which Ei⫹1 is postsynaptic (i ⫽ {1, 2,…, 7}). The constant was a small positive number to ensure that weights change slowly relative to the timescale of neuronal dynamics (e.g., 0.001). In the limit of ri 共t兲 ⬍⬍ r0 ,
冉 冊
r i共 t 兲 ri 共t兲 ⬍⬍ 1 and 共ri 共t兲兲 ⫽ r0 r0
p
⬍⬍ ri 共t兲.
This leads to 共ri 共t兲, 共ri 共t兲兲兲 ⬎ 0 because p ⬎ 1, and potentiation of the weights. In the limit of ri 共t兲 ⬎⬎ r0 ,
冉 冊
r i共 t 兲 ri 共t兲 ⬎⬎ 1 and 共ri 共t兲兲 ⫽ r0 r0
p
⬎⬎ ri 共t兲.
This leads to 共ri 共t兲, 共ri 共t兲兲兲 ⬍ 0 and depression of the weights. In both models, the weights were prevented from changing sign in agreement with Dale’s law (Strata and Harvey, 1999).
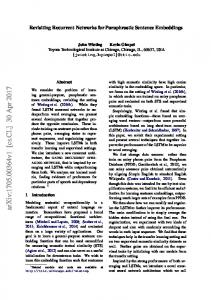
Results Can spontaneous activity successfully tune a bidirectionally connected recurrent network with weak connectivity by using local activity-dependent mechanisms that modify connection strength to produce functional output? Here we studied the generation of unidirectional (forward and backward) propagating waves of activity resembling those observed during crawling in the Drosophila larval motor network. Two main principles provided the basis for our developmental model: (1) the model should use local activity-dependent mechanisms to tune connection strength; and (2) the connections should achieve a stable configuration at the end of development such that the network generates propagating waves of activity with regular timing relationships (interburst intervals and duty cycles) in different segments. We used a recurrent network with bidirectional connectivity, which can generate forward and backward propagating waves when appropriately tuned (Fig. 1) (see also Gjorgjieva et al., 2013; their Fig. 3). The model was initialized with weak connectivity between different segments incapable of generating waves. Weak connectivity in the network is likely specified by activityindependent mechanisms, which guide axons toward their correct target partners. These guidance mechanisms are widespread throughout the central nervous system (Dickson and Gilestro, 2006; Huberman et al., 2008; Klein and Kania, 2014; Hand and Kolodkin, 2015). Each excitatory population in the model network was triggered by patterned spontaneous input (see Materials and Methods), and depending on its strength and duration, increased the activity of the populations in random segments above threshold at different times. We sought to determine the nature of activity-dependent plasticity rules that modify the strength of excitatory and inhibitory weights, b and d, connecting neighboring segments using the spatiotemporal activation patterns of different segments. Having as a goal to produce robust propagating waves of activity with precise timing relationships, we compared a Hebbian with an activity-dependent homeostatic model for connection tuning based on local activity patterns. The Hebbian bidirectional model does not generate functional weight distributions Weight modification in the Hebbian model was based on Hebb’s mechanism (Hebb, 1949): if the population activity in two neighboring segments is simultaneously above threshold, the weights
3726 • J. Neurosci., March 30, 2016 • 36(13):3722–3734
Gjorgjieva et al. • Homeostatic Tuning of Recurrent Networks
0.3
between the neuronal populations should A B increase (Fig. 2 A, B). Even though spontaneous activity in the model was uncorA1 related across segments, correlations A2 between the activations of neighboring segments exist because of the network’s .................. A3 recurrent connectivity. Hebb’s idea has been translated into various forms of A4 correlation-based rules for synaptic modification, which commonly assume that A5 synapses change strength in proportion to the correlation of presynaptic and postA6 synaptic activity. This includes spike timing-dependent plasticity, where the A7 magnitude of synaptic potentiation and depression depends on the order of preA8 1 t.u. synaptic and postsynaptic action poten0.5 t.u. tials, as well as their timing (Markram et al., 1997). Hebbian plasticity has been successfully applied to activity-driven refinement of developing circuits and Figure 1. A network model for the emergence of coordinated output. A, A network model for peristaltic wave propagation with learning in neuronal networks in many eight segments, each consisting of an excitatory (E) and an inhibitory (I) neuronal population. The connections within the same brain regions, including hippocampus, segment (solid lines), a, c, e, and f, labeled only for the most posterior segment, are fixed during development. Nearest-neighbor segments are connected with excitatory, b (blue, arrows), and inhibitory, d (red, dots), connections. Dashed lines indicate that neocortex, and cerebellum (Bliss and these connections are plastic during development. The weights in the forward and backward direction are identified by superLomø, 1973; Bliss and Collingridge, 1993; scripts “f” and “b,” respectively. Each segment receives spontaneous random input of strength R for a duration of T , as illustrated i i Malenka and Nicoll, 1999; Martin et al., on the left. B, An example of suprathreshold excitatory activity (threshold for detection of suprathreshold activity is 0.3) of each 2000; Malenka and Bear, 2004). segment upon driving E8 with Pext ⫽ 1.7 for a network with parameters as in Table 1. Time is measured in arbitrary time units (t.u.). Correlation-based Hebbian rules have Inset, Excitatory activity (blue) and inhibitory activity (red) for segment A8 with a threshold indicated by the dashed line. been often used to model map formation in the visual system (Miller et al., 1989; A Miller, 1992). Therefore, we first characA1 terize the role of Hebbian rules in connecA2 tivity tuning in the recurrent networks for A3 motor output studied here. A4 A common challenge that Hebbian A5 mechanisms face is unbounded growth of A6 synaptic weights. Although upper bounds A7 on synaptic strength can be imposed, and A8 most biological systems probably have a 10 t.u. saturation constraint limiting synaptic growth, it is unlikely that this upper B C bound is always fixed to the same value 0.5 and that the system knows this value a pri0.4 ori. To prevent unbounded synaptic threshold growth, we considered two implementa0.3 10 t.u. tions of the Hebbian model. One imple0.2 mentation is based on bidirectional plasticity, which evokes synaptic potenti0.1 ation if presynaptic activity comes before 0 postsynaptic activity, and depression if 1 t.u. the order of activity is reversed (as in spike timing-dependent plasticity). This model Figure 2. The Hebbian model for synaptic modification. A, Weight changes induced by Hebbian plasticity: A snapshot of 50 t.u. has been referred to as the Hebbian bidi- of activity during early development. When activity in neighboring neuronal populations exceeds threshold simultaneously rectional model (see Materials and Meth- (dashed ellipses), based on the order of threshold crossing, the respective forward or backward weights are updated, here b1b and b ods). The Hebbian bidirectional model d1. B, Excitatory and inhibitory activity in two neighboring segments simultaneously above threshold is shown as a function of e fails to produce stable bidirectional con- time. C, As the activity of two neuronal populations crosses threshold (dashed line), at times denoted by t (arrows), the efficacy ⑀ 共 t 兲 is reset to 0 for a refractory period of t and then exponentially recovers to 1 with a timescale . i ref rec nections because the weights develop in a biased way: some potentiate, whereas than others. However, each pair of neighboring excitatory popuothers decrease to zero, uncoupling neighboring populations lations is connected by weights for wave propagation in both (Fig. 3). What is the reason for this bias? Because random spontaneous directions, so whenever the weight for one direction potentiates, input is applied to each excitatory population in the network with the corresponding weight in the other direction depresses. This initially small b and d, some weights randomly potentiate more creates a feedback loop, in which stronger weights produce more
Gjorgjieva et al. • Homeostatic Tuning of Recurrent Networks
excitatory weights
A
inhibitory weights
C
forward
B
J. Neurosci., March 30, 2016 • 36(13):3722–3734 • 3727
backward
40
20
0 developmental time
0
−10
−20
D
developmental time
weight 7 weight 6 weight 5 weight 4
weight 3 weight 2 weight 1
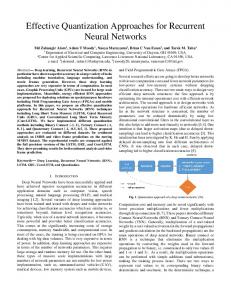
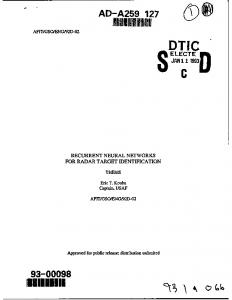
Figure 3. Weights were modified using the Hebbian bidirectional model (Eqs. 4 –11) with ⌬⫹ ⫽ 0.1 and ⌬⫺ ⫽ 0.05 without activity-dependent synaptic efficacy. Spontaneous activity was generated with Ri ⬃ [N(0.2, 0.8)]⫹ and Ti ⬃ U(2, 3). Every 8000 time units, the SD ( ⫽ 0.8) of the distribution for Ri was decreased by 0.05. A, Forward excitatory weights bif. B, Backward excitatory weights bib. C, Forward inhibitory weights dif. D, Backward inhibitory weights dib.
frequent suprathreshold activity, further amplifying the same sets of weights, whereas the weights in the opposite direction decay to zero (Fig. 3). Therefore, it is not possible to strengthen synaptic connections in both directions between neighboring excitatory populations appropriately for wave generation because of the asymmetric integration window of the Hebbian model. This is consistent with various models of spike timing-dependent plasticity (Abbott and Nelson, 2000; Song and Abbott, 2001). Nonlinear plasticity rules can generate functional bidirectional connectivity, but such models are based on detailed spiking and voltage trajectories of individual neurons (Clopath et al., 2010). The Hebbian efficacy model requires balancing of activity across the network We therefore considered an alternate implementation of the Hebbian model where synaptic potentiation is induced if presynaptic activity occurs before postsynaptic activity, augmented by activity-dependent synaptic efficacy to prevent unbounded weight increase (Fig. 2C), but without any synaptic depression. This model has been referred to as the Hebbian efficacy model. The amplitude of weight modification in the Hebbian efficacy model is inversely proportional to the frequency of threshold crossings in segments connected by that weight (see Materials and Methods). The model produces bidirectional weights that become ordered in the direction of wave propagation (Fig. 4A). Thus, of all excitatory weights for forward propagation, the most posterior (b7f ) becomes the largest, whereas the anterior weights (b1f ⫺ b3f ) become the smallest. We found this to be due to a combination of (1) the difference in total input (synaptic and spontaneous) received by each excitatory population, and (2) the preference for synaptic potentiation of the forward weights induced by the order of excitatory segment activation, a hallmark of Hebb’s rule. Indeed, segment A8 has only one neighbor and receives overall less drive than the other segments in the network; thus, its efficacy is the largest, evoking the highest potentiation of b7f . Although the most anterior segment, A1, also has only one
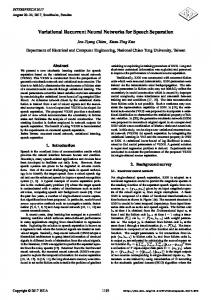
neighbor, it can also be driven from its neighboring segment (A2) in the forward direction so b1f has a lower efficacy and does not potentiate as much. The weights at the anterior end and the middle of the network are most frequently activated; they have the lowest efficacy and are potentiated the least. We examine this in greater detail. The threshold crossing frequency of excitatory activity (necessary to trigger weight change) depends strongly on the strength of the weights at a given time point during the development simulation (Fig. 5A). When weights are small, threshold crossing is purely the result of spontaneous drive, which is approximately uniform across all segments; thus, all segments exhibit approximately the same number of threshold crossings (Fig. 5A, blue). When the weights are sufficiently strong to generate waves, then the activation of any one segment propagates to all remaining segments, activating all of them uniformly. Hence, all segments again exhibit approximately the same number of threshold crossings (Fig. 5A, red). The biggest discrepancy between the frequency of suprathreshold activity in different segments occurs at intermediate synaptic strength (Fig. 5A, yellow). In this scenario, the end segments of the network, which have only one neighboring segment, receive the lowest synaptic input and so have the lowest overall input. Weights connecting neuronal populations whose activity crosses threshold more frequently due to the higher overall drive (in the middle of the network) have smaller efficacies compared with the weights at the ends of the network. Therefore, the former weights potentiate less than the latter. The outcome of this process produces variable steady-state weights (Fig. 4A). Taking the steady-state weights at the end of the developmental period fails to produce propagating waves of activity across the network (data not shown). If Hebbian-style activity-dependent mechanisms indeed tune synaptic connectivity in the bidirectionally connected network, then to equalize the total amount of input received by each segment, the end segments must receive additional spontaneous input (Fig. 5B). Furthermore, as spontaneous activation of all segments decreases during development (Crisp et al., 2008), then the intensity of additional spontaneous drive to the end segments must increase. The increase in the end drive during development might correspond to the biological system progressively testing more frequently whether the network is fully assembled to produce waves. Thus, toward the end of development, the only drive to the network is to the end segments, which will initiate either forward or backward waves (Fig. 5B). Weight distributions from the Hebbian efficacy model produce variable waves even with balanced activity The Hebbian efficacy model with additional end drive successfully produces stable and functional weight distributions (Fig. 4B). To examine the progression of network output during development, we recorded the spatiotemporal activity patterns in the network over a given period (Fig. 6A–E) at the developmental time points denoted in Figure 4B (arrows). The network output gradually becomes more coordinated similarly to motor development in Drosophila (Crisp et al., 2008). Furthermore, partial motifs of coordinated output, which involve the simultaneous suprathreshold activity of excitatory populations in several neighboring segments, typically originate at one end of the network. This makes a concrete experimental prediction for how coordinated activity emerges gradually during development if the Hebbian efficacy model with additional end drive organizes the network. The Hebbian efficacy model with balanced activity across the segments generated stable weight distributions, even when the initial conditions for the weights were randomly distributed in a given range, albeit still weak (Fig. 4C). Increasing that range of
Gjorgjieva et al. • Homeostatic Tuning of Recurrent Networks
3728 • J. Neurosci., March 30, 2016 • 36(13):3722–3734
A forward excitatory weights
initial conditions fails to produce stable weights (data not shown). To determine whether the steady-state weights can indeed generate waves, forward waves were initiated by driving the most posterior population E8 in 20 networks where the weights developed from random initial conditions (Fig. 6F ). The resulting waves have variable interburst intervals and variable duty cycles across the different segments that often fall outside the experimentally measured ranges (Fig. 6G,H ).
40 30
B
C
30
30
20
20
10
10
20 10 0
developmental time
0
0
developmental time
developmental time
Figure 4. Weight development in the Hebbian efficacy model. A, The network weights were modified using the Hebbian efficacy model (Eq. 12), where rec ⫽ 20 t.u. and tref ⫽ 20 t.u. All weights start at the same initial condition (b ⫽ ⫺d ⫽ 2). B, Same as in A but with additional end drive applied to one of the end segments chosen randomly with equal probability (reaching 1.7 at the end of the simulation). Spatiotemporal patterns of excitatory activity at the times denoted with arrows are shown in Figure 6. C, Same as in B but with random initial conditions starting in the range of 0 and 5. In all cases, spontaneous activity was generated with Ri ⬃ [N(0.5, 0.8)]⫹ and Ti ⬃ U(2, 3). Every 8000 time units, the SD ( ⫽ 0.8) of the distribution for Ri was decreased by 0.05. Only excitatory weights in the forward direction are shown as per Figure 3.
Wave sensitivity to spontaneous activity patterns in the Hebbian efficacy model How sensitive is weight development and wave generation in the Hebbian efficacy model to changes in the properties of spontaneous activity? Modest changes to the distribution for generation of spontaneous input strength Ri preserve the interburst intervals but retain the irregular duty cycles during wave propagation (Fig. 7). Some cases, however, produce a stable configuration of weights too small to generate robust waves (Fig. 7, bottom). More substantial variations in the spontaneous input strength result in more significant variability of the final weight distributions and ultimate failure of the network to generate waves. Similarly, stable weight distributions and propagating waves are produced only for a small subset of efficacy time constants and recovery parameters. Mistuning these parameters either destabilizes the weights so that they never saturate to a stable value or stabilizes the weights too early before they are sufficiently strong for wave generation (data not shown). Conclusion for the Hebbian model(s) For our networks with predetermined connectivity spanning only neighboring segments, we conclude that the basic requirement for coincident presynaptic and postsynaptic activity in the Hebbian models is insufficient to generate functional weight distributions that produce propagating waves with the appropriate timing relationships. Although model performance improved with the introduction of new assumptions (synaptic efficacy and additional spontaneous drive to the end segments), the final weight distributions and waves were highly variable. This suggests that Hebbian mechanisms likely play a minor role in tuning the motor network for wave propagation.
The homeostatic model When experimentally challenged with perturbations in synaptic structure and function, neurons have the remarkable ability to regulate their synaptic strengths to bring activity back to a normal range. Various homeostatic mechanisms that maintain neuronal stability have been identified in invertebrates and vertebrates (Pe´rez-Otan˜o and Ehlers, 2005; Davis, 2006; Marder and Goaillard, 2006; Turrigiano, 2008; Pozo and Goda, 2010; Marder, 2012). One of the bestdefined systems for analysis of the homeostatic mechanisms that regulate synaptic efficacy is the Drosophila neuromuscular junction. The neuromuscular junction exhibits a strong homeostatic response to changes in postsynaptic excitability (Petersen et al., 1997; Davis et al., 1998). In contrast to the popular view that homeostatic plasticity is a slow phenomenon involving many neurons simultaneously, neurons may also undergo rapid synaptic tuning (Pozo and Goda, 2010).
Therefore, we considered a different model to regulate synaptic strength: a homeostatic mechanism that maintains network activity at stable levels based on spontaneous input. In our implementation of the homeostatic model, synaptic weights are potentiated or depressed to maintain a constant average activity of the excitatory postsynaptic population in each segment (see Materials and Methods). Spontaneous input is necessary for synaptic change. As such, our homeostatic model falls under the category of local activitydependent models, which require that each neuronal population computes a running average of its activity and the weights are modified to maintain that quantity (Zenke et al., 2013). A different class of homeostatic models are nonlocal models, which require that all incoming weights to a neuronal population are kept normalized, even in the absence of activity (such as synaptic scaling) (Turrigiano et al., 1998). The mechanisms for bidirectional homeostatic plasticity (simultaneously inducing potentiation and depression) have recently been demonstrated for the Drosophila neuromuscular junction (Gavin˜o et al., 2015), and also in Drosophila central neurons. The motor and visual system of developing larvae also shows bidirectional structural homeostasis (Tripodi et al., 2008; Yuan et al., 2011), as well as the mushroom body of the adult (Kremer et al., 2010). In our homeostatic plasticity model, weights potentiate or depress to maintain excitatory activity in all segments (postsynaptic to both excitatory and inhibitory weights) at the same target level. For instance, weights potentiate or depress based on whether the average excitatory activity ri in a segment i is larger than a modification threshold, 共 r i 兲 ; the threshold itself is a nonlinear function of the slow average of postsynaptic activity, as proposed in the BienenstockCooper-Munro plasticity model (Bienenstock et al., 1982) (Fig. 8 A, B). To determine the steady-state activity, we can solve for the case when the weights are also at a steady state. Then from Equation 15,
共 r i 共 t 兲兲 ⫽ r i 共 t 兲 ⫺
冉 冊 r i共 t 兲 r0
p
⫽0
(20)
The steady-state excitatory activity is as follows: p
r eq ⫽ r0 p⫺1 .
(21)
When r0 ⫽ 2.0 and p ⫽ 1.5, then req ⫽ 8.0 (Fig. 8A). Varying p affects the value of the steady-state excitatory activity req (Eq. 21) and the steady-state weights in the network (Fig. 8C). For instance, when p ⫽ 1.7, maintaining req ⫽ 5.4 requires smaller
Gjorgjieva et al. • Homeostatic Tuning of Recurrent Networks
B 15
800 10
400
5
mean overall drive per segment
1200
0
early development
maturity
late development
20
1.5
0
800
1
if only spontaneous drive 400
0.5 0
A1 A2 A3 A4 A5 A6 A7 A8
1200
if additional end drive
A1 A2 A3 A4 A5 A6 A7 A8
A1A2 A3 A4 A5 A6 A7 A8
A1 A2 A3 A4 A5 A6 A7 A8
0
number of threshold crossings per segment
number of threshold crossings per segment
A
J. Neurosci., March 30, 2016 • 36(13):3722–3734 • 3729
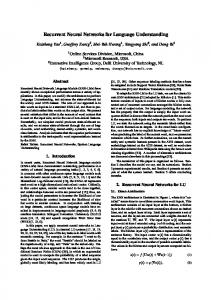
Figure 5. Frequency of threshold crossing of excitatory populations in the different Hebbian models. A, Number of threshold crossings per segment for 10,000 t.u. where spontaneous activity was generated with Ri ⬃ [N(0.2, 0.8)]⫹ and Ti ⬃ U(0.5, 1.5). Here spontaneous activity was fixed during the simulation. The strength of the intersegmental connections (Fig. 1) was uniform across the network. B, The total amount of activity received by each segment consists of different contributions from spontaneous input and from additional end drive at different points in development. Histograms represent the mean overall drive per segment (spontaneous input and end drive) at three developmental time points (early development, late development, and maturity) showing a decrease of spontaneous activity and an increase in end drive. The number of threshold crossings per segment is also shown (red) as in A for a simulation of 10,000 t.u. Middle, With additional end drive (full line), all segments contract at a similar frequency, compared with the case with no end drive (dashed line).
A
A
E
A1 A2 A3 A4 A5 A6 A7 A8
20 10 5 t.u.
0
F
A1 A2 A3 A4 A5 A6 A7 A8
1 t.u.
A1 A2 A3 A4 A5 A6 A7 A8
30
A1 A2 A3 A4 A5 A6 A7 A8
duty cycle
G
D
H
A1 A2 A3 A4 A5 A6 A7 A8
interburst interval
C
A1 A2 A3 A4 A5 A6 A7 A8
30
0.5 t.u.
1 0.8
Hebbian model decreasing spontaneous activity Experimental data forward waves at 25 C
0.6 0.4
20 10 0
A1 A2 A3 A4 A5 A6 A7 A8
30 20 10
0.2 0
forward excitatory weights
B
B
A8 A7 A6 A5 A4 A3 A2 A1
0.2 0.15
0
A1 A2 A3 A4 A5 A6 A7 A8
30
0.1
20
0.05
10 0
3 4 2 6 7 5 8 A7- A6- A5- A4- A3- A2- A1-
Figure 6. Emergence of coordinated output in the Hebbian efficacy model with additional end drive. A–E, Spatiotemporal patterns of suprathreshold excitatory activity at the developmental time denoted with arrows in Figure 4B. A, Scale bar applies to A–E. F, Applying Pext ⫽ 1.7 to E8 in the network with the final set of weights generates a forward wave. G, H, Duty cycle and interburst interval (mean ⫾ SD) for waves that were generated over 20 trials of wave development as in Figure 4C. The model is compared with experimental data as in Gjorgjieva et al. (2013).
weights in the network (Fig. 8D). Similarly, when p ⫽ 1.3, maintaining req ⫽ 20.2 requires larger weights (Fig. 8E). The timescale r also has an effect on the steady-state weights. Increasing r results in lower average excitatory activity, ri (Eq. 13), and smaller
0 developmental time
Figure 7. Varying the mean and SD of spontaneous input in the Hebbian efficacy model. A, Forward excitatory weights (as per Fig. 3). The mean () and the SD () of the distribution for Ri ⬃ [N(, )]⫹ were varied as shown in the inset of each plot. Every 8000 time units, was decreased by 0.05. Compare with Figure 4 where ⫽ 0.5 and ⫽ 0.8. B, Examples of forward waves generated with the steady-state weights at the end of each simulation in A.
steady-state weights (Fig. 8F ). Therefore, the parameters in the homeostatic plasticity model determine the average activity of the excitatory populations and the strength of the steady-state weights in the network necessary to maintain that activity.
Gjorgjieva et al. • Homeostatic Tuning of Recurrent Networks
3730 • J. Neurosci., March 30, 2016 • 36(13):3722–3734
A average activity
(Fig. 9A). The homeostatic model generates stable and functional weight distributions, even when the weights start randomly distributed in a given range (Fig. 9B,D). In contrast to the Hebbian model, the homeostatic model successfully generates stable weight distributions for larger ranges of initial conditions. For especially large ranges of initial weights, functional connectivity does not emerge as some weights continue to potentiate, whereas others depress, depending on their initial strength (data not shown). Last, the homeostatic model can maintain weights at a functional range, even when network connectivity is perturbed. Following appropriate weight development in our functional model network, we “cut” all connections between segments A3 and A4 (by setting the weights to 0), which eliminated wave generation (Fig. 9E). Allowing the homeostatic model to act in the presence of spontaneous input recovered functional weights and appropriately timed waves (Fig. 9C,F).
B
15 10 5 target activity
threshold
0
D
C forward excitatory weights
20 t.u.
t.u.
10
0
E
F
forward excitatory weights
20
10
0
t.u.
developmental time
t.u.
developmental time
Figure 8. The average segmental excitatory activity and weights in the homeostatic plasticity model. A, The average excitatory activity of one segment, E7, fluctuates around the target activity. Spontaneous activity was generated with Ri ⬃ [N(0.5, 0.4)]⫹ and Ti ⬃ U(2, 3) throughout development. B, The modification threshold is a function of the average activity and determines whether the weights will be potentiated (if the threshold is smaller the averaged activity) or depressed (if the threshold is above the averaged activity) as indicated by the upward and downward pointing arrows, respectively. The threshold is shown for the time denoted by the bracket in A. C, D, Varying p, while keeping r constant, affects the target activity req as in Equation 21 and consequently the steady-state feedforward excitatory weights. E, F, Varying r also affects the steady-state weights, even when the target activity is the same. Here, spontaneous activity was generated with Ri ⬃ [N(0.5, 0.4)]⫹ and Ti ⬃ U(2, 3). Activity remained constant during development. C–F, Weights shown as per Figure 3, but only forward excitatory weights for illustration.
The homeostatic model produces stable weight distributions Figure 8 shows that, even at a constant level of spontaneous network activity during a simulation of development, the weights stabilize to maintain the target level of postsynaptic activity. If the amount of spontaneous activity decreases during the developmental period as the network assembles (Crisp et al., 2008), then the weights increase more gradually toward their steady-state value (Fig. 9A), with a time constant combining the slow synaptic weight change and the decrease in spontaneous activity. Weight evolution goes through a plateau before the network has fully assembled. This plateau occurs as a result of the interaction of spontaneous input and recurrent activity in the network when the weights strengthen sufficiently to propagate activity to neighboring segments. Changing the properties of spontaneous activity can change when (and whether at all) this plateau occurs (see Fig. 11). During forward wave propagation, all but one of the excitatory weights (b2f, …, b7f) have as postsynaptic activity the excitatory activity of a segment in the middle of the body (E2, …, E7). The postsynaptic activity for b1f is E1, which is coupled only to a single neighboring segment, E2. Thus, to achieve the same target activity, b1f potentiates more strongly than the other forward excitatory weights
The homeostatic model generates appropriately timed propagating waves To examine the output of the model during development, we recorded the spatiotemporal patterns of activation in the network (Fig. 10A–E) at the developmental time points denoted in Figure 9A (arrows). Coordinated output gradually improves in the network similar to the gradual improvement of motor output during Drosophila development (Crisp et al., 2008). Are the stable weight configurations produced by this model able to generate robust propagating waves with appropriate timing relationships? Probing 20 networks, where the weights were generated from random initial conditions, shows that the homeostatic model can indeed generate waves with regular interburst intervals and duty cycles across the different segments that closely match experimental variability (Fig. 10G,H). This demonstrates that the homeostatic model successfully tunes network connectivity to a functional state, which can generate propagating unidirectional waves with the appropriate segmental timing relationships. Wave sensitivity to spontaneous activity patterns in the homeostatic model The amount of spontaneous activity, determined by the properties of the distribution of input strength into each excitatory population, determines the steady-state value at which the network weights saturate. To further investigate how the steady-state weights depend on the nature of spontaneous activity, we examined weight development and wave generation as a function of the mean () of the distribution for spontaneous input strength, Ri ⬃ [N (, )] (similar results were obtained when varying the SD; data not shown). Increasing raises the average spontaneous input strength, Ri, thus increasing the excitatory activity in each segment, Ei. Because Ei receives two types of input (spontaneous and synaptic input), to maintain an average activity at the target level req, the synaptic input from neighboring populations must decrease; this can be achieved by decreasing the steady-state strength of the weights (Fig. 11). Waves generated by the network using the final steady-state weights become longer as increases, and excitatory activity remains above threshold for a shorter time in each segment, resulting in shorter duty cycles and longer interburst intervals. Increasing ⱖ 0.5 makes the influence of spontaneous input on excitatory activity so strong that very little drive from neighboring segments is needed to maintain the average excitatory activity at target. Therefore, the weights become too small for the network to generate waves (data not shown).
Gjorgjieva et al. • Homeostatic Tuning of Recurrent Networks
A
B
J. Neurosci., March 30, 2016 • 36(13):3722–3734 • 3731
C
forward excitatory weights
30 20 10 connection cut
0 developmental time
D
: before cut
developmental time
E
: immediately after cut
F
: recovery after cut
A1 A2 A3 A4 A5 A6 A7 A8
circuit development, when the properties of different circuit components are immature and changing, and input from the environment unreliable. Here we studied a model network of recurrently connected excitatory and inhibitory neuronal populations segmentally repeated in a single dimension, motivated by the motor network for Drosophila larval crawling. A key feature of this network, when appropriately tuned, is its ability to generate robust forward and backward waves of activity by driving each end of the network (Gjorgjieva et al., 2013). Examining sets of connectivity parameters that enable wave generation in the network has revealed nontrivial solution regions. We sought to identify plausible mechanisms by which these parameters emerge.
0.5 t.u.
Activity-dependent tuning of network connectivity Although there is ample evidence that spontaneous activity patterns instruct refinement of circuit connectivity in sensory systems (Huberman et al., 2008), the importance of spontaneous activity for the development of motor circuits is conflicting (Marder and Rehm, 2005; Myers et al., 2005; Li et al., 2007; Roberts et al., 2014). Network models of spontaneous activity in developing motor circuits have typically addressed the generation and properties of high-activity episodes interrupted by quiet periods in the embryonic chick spinal cord (Tabak et al., 2000, 2001; Marchetti et al., 2005; Tabak et al., 2010). However, unlike sensory systems, it is unclear whether this activity helps refine developing motor circuits. Imaging of spontaneous activity during embryogenesis in Drosophila larvae has revealed a gradual progression of motor output, and manipulations of this activity point to the role of activity-dependent mechanisms in the tuning of the network (Crisp et al., 2008, 2011; Giachello and Baines, 2015). Using computational modeling, we have demonstrated that spontaneous activity can indeed tune a weakly connected recurrent network if the appropriate activity-dependent tuning rules are used. We examined two styles of activity-dependent mechanisms for weight development that through gradual improvement in network output lead to stable weight distributions to generate propagating waves with regular interburst intervals and duty cycles. Hebbian-style models modify synaptic strength based on coincident presynaptic and postsynaptic activity. Although Hebbian mechanisms instruct activity-driven refinements in the developing visual system (Huberman et al., 2008), applying similar mechanisms for the tuning of a motor network for wave propagation yields less successful results. Unlike sensory systems where neurons topographically project from an input to a target layer, the motor network in Drosophila larvae is segmentally organized and recurrently connected. Although correlated activity emerges between neighboring segments, even when spontaneous input is uncorrelated, there is no obvious notion of presynaptic and postsynaptic: the same segment can be both presynaptic and postsynaptic to different synaptic connections. Thus, Hebbian mechanisms are less likely to play a fundamental role in fine-tuning network connectivity. Indeed, both Hebbian (bidirectional and efficacy) models fail to produce func-
Figure 9. Weight development in the homeostatic model with decreasing spontaneous activity in development. A, The development of the weights under the homeostatic model (Eqs. 16 –19) from an identical initial condition (b ⫽ ⫺d ⫽ 2). Spatiotemporal patterns of excitatory activity at the developmental time denoted with arrows are shown in Figure 10. B, Same as in A but with random initial conditions starting in the range of 0 and 5. C, Starting with the final weights in B (T0), only those between segments A4 and A3 were cut (weights set to 0) as indicated by the arrow (Tcut), and allowed to develop again under the homeostatic model (Tend). D, Forward wave generated using the final weights in B at T0. E, The network fails to generate waves when the connections are cut using the initial weights in C at Tcut. F, Forward wave generated by the recovered network using the final weights in C at Tend. In all cases, spontaneous activity was generated with Ri ⬃ [N(0.3, 0.8)]⫹ and Ti ⬃ U(2, 3). Every 8000 time units, the SD ( ⫽ 0.8) of the distribution for Ri was decreased by 0.04. Only excitatory weights in the forward direction are shown in A–C as per Figure 3.
This suggests that, for the homeostatic model to produce stable and functional network weights, spontaneous activity must operate within a range. It should be sufficiently frequent to drive excitatory activity above threshold and to enable weight potentiation; yet it should not be too frequent to allow steadystate population activity to be maintained by synaptic input from neighboring populations. The model is robust to changes in the amount by which spontaneous activity decreases during development, and it can also generate stable and functional weights even when spontaneous activity is constant during development (Fig. 8). Conclusion for the homeostatic model These results demonstrate that, based on the properties of spontaneous activity, different stable weight configurations can be achieved with the homeostatic model by maintaining a target level of postsynaptic activity for each weight. The weights can be reliably reproduced over multiple simulation runs and initial conditions, and no additional assumptions are necessary to bound synaptic growth as for the Hebbian model. A network with the final set of weights can generate propagating waves with precise timing properties, such as regular interburst intervals and duty cycles across the segments. This suggests that differences in the nature of spontaneous activity during development may underlie variability of network connectivity and the resulting wave properties produced by the final network. Therefore, developmental differences in spontaneous activity (endogenous or environmental) represent one plausible way by which such variability is achieved in the motor network of Drosophila (Berni et al., 2012; Gjorgjieva et al., 2013).
Discussion How are neural circuits organized to maintain stable function and produce robust output? This task is made especially difficult during
Gjorgjieva et al. • Homeostatic Tuning of Recurrent Networks
3732 • J. Neurosci., March 30, 2016 • 36(13):3722–3734
A
A
E
A1 A2 A3 A4 A5 A6 A7 A8
20 5 t.u.
0
F
A1 A2 A3 A4 A5 A6 A7 A8
G
A1 A2 A3 A4 A5 A6 A7 A8
duty cycle
C
D
H
0.5 t.u.
1 0.8
Homeostatic model decreasing spontaneous activity Experimental data forward waves at 25 C
0.6
0.5 t.u.
A1 A2 A3 A4 A5 A6 A7 A8
40 20 0
A1 A2 A3 A4 A5 A6 A7 A8
40
0.4
20
0.2
interburst interval
A1 A2 A3 A4 A5 A6 A7 A8
A1 A2 A3 A4 A5 A6 A7 A8
40
forward excitatory weights
B
B
0
A8 A7 A6 A5 A4 A3 A2 A1
0.2
0
0.15 0.1 0.05 0
A1 A2 A3 A4 A5 A6 A7 A8
40 20 6 3 8 7 4 2 5 A7- A6- A5- A4- A3- A2- A1-
Figure 10. Emergence of coordinated output in the homeostatic model. A–E, Spatiotemporal patterns of suprathreshold excitatory activity at the developmental time denoted with arrows in Figure 9A. A, Scale bar applies to A–E. F, Applying Pext ⫽ 1.7 to E8 in the network with the final set of weights generates a forward wave. G, H, Duty cycle and interburst interval (mean ⫾ SD) for waves that were generated over 20 trials of wave development as in Figure 9B. The model is compared with experimental data as in Gjorgjieva et al. (2013).
tional bidirectional weights that generate waves with appropriate timing relationships. In neural systems as diverse as the crustacean stomatogastric system and the vertebrate visual system, homeostatic mechanisms control neuronal function through the regulation of synaptic efficacy and the modulation of intrinsic ionic conductances (Pe´rez-Otan˜o and Ehlers, 2005; Davis, 2006; Marder and Goaillard, 2006; Turrigiano, 2008; Pozo and Goda, 2010; Marder, 2012). Several forms of homeostatic plasticity have been proposed to stabilize network activity, such as regulation of the strength of synaptic transmission and synaptic scaling as a function of global network activity (Turrigiano et al., 1998; Turrigiano, 1999; Turrigiano and Nelson, 2004; Gonzalez-Islas and Wenner, 2006). Altered activity patterns can scale synaptic connections through homeostatic mechanisms also in motor circuits (Borodinsky et al., 2004). Our homeostatic model was based on the goal to maintain a target level of excitatory postsynaptic activity, which was achieved by modifying the synaptic weights for which the target population is postsynaptic. Spontaneous activity was necessary to drive weight modifications (Zenke et al., 2013). Without any additional assumptions, the homeostatic model achieves stable and functional bidirectional weight distributions that generate waves with regular duty cycles and interburst intervals.
0
developmental time
Figure 11. Varying the mean of spontaneous input in the homeostatic plasticity model. A, Forward excitatory weights (as per Fig. 3). The mean () of the distribution for Ri ⬃ [N(, )]⫹ was varied as shown in top left of each graph. In all cases, ⫽ 0.8 and decreased over development by ⌬ ⫽ 0.04 every 8000 time units. Vertical dashed lines indicate the time when the SD reached 0. B, Forward waves generated with the steady-state weights at the end of each simulation in A.
Moreover, different wave properties can be produced from different spontaneous activity patterns, providing a way to generate wave variability in the experimental system. Therefore, our results suggest that activity-dependent homeostatic mechanisms are more likely to tune weak bidirectional connectivity in a recurrent network than Hebbian mechanisms. During tuning, the network gradually improves the coordination of its output, matching the gradual emergence of coordinated output in developing Drosophila larvae. The resulting network can produce appropriately timed network-wide waves of activity that propagate in either direction despite bidirectional connectivity. This property can be matched to the ability of Drosophila larvae to crawl forward and backward with similar properties (Gjorgjieva et al., 2013). The homeostatic model can also restore functional weights following perturbations of connectivity in the presence of spontaneous input with similar patterns as used for developmental tuning. Thus, if activity-dependent homeostasis continues to operate after development to keep patterned activity robust, then the network must continue to receive external input. This is plausible because the Drosophila larval motor network receives descending input during continuous crawling, as well as additional proprioceptive input from the environment.
Gjorgjieva et al. • Homeostatic Tuning of Recurrent Networks
Limitations of the plasticity models Because no activity-dependent plasticity rules have yet been identified in developing motor circuits, it was natural to assume here that inhibitory plasticity is similar to excitatory plasticity (notably, homeostatic adjustment of both excitatory and inhibitory connections occurs) (Gonzalez-Islas and Wenner, 2006). In both activity-dependent models, excitatory and inhibitory weights developed in a balanced fashion, enabling the generation of waves propagating in either direction. Therefore, neither type of weight is stronger than the other at any time. This is currently at odds with experimental data, where at least initially, inhibition is not required to generate output patterns (Crisp et al., 2008). In addition to regulation of synaptic connectivity, which is realized by both our Hebbian and homeostatic models, homeostatic regulation may occur at the level of intrinsic neuronal excitability through the modulation of intrinsic ionic conductances. Theoretical rules for conductance regulation have been successfully used to generate different cells types and reliable motor output in the stomatogastric nervous system of crustaceans (LeMasson et al., 1993; Liu et al., 1998; Marder and Goaillard, 2006; O’Leary et al., 2014). Our current rate-based framework precludes such studies based on conductance-based models, although it can incorporate changes in intrinsic excitability by modulation of the activation functions in the population model equations. Mapping of circuit connectivity in EM volumes has revealed the existence of long-range connectivity that spans non-neighboring segments in the Drosophila motor network (A. Cardona, personal communication). However, how long-range connectivity changes during embryonic development is still unknown. Thus, we based our models on a “minimal” network architecture where the nature of connectivity (but not strengths) was predefined to be nearest neighbor (Gjorgjieva et al., 2013). As we add other types of longrange connections, we will need other kinds of mechanisms, some of them Hebbian, in combination with homeostatic plasticity (Vitureira and Goda, 2013; Zenke et al., 2013) to ensure that connectivity, short- and long-range, is refined in the appropriate manner. Generality of the network model Although our model is motivated by the production of motor output during crawling in Drosophila larvae, it is not an anatomical model of the Drosophila motor network and does not incorporate any detail about the organization and neural identity of different network elements, such as interneurons, motor neurons, and muscles; instead, the activity of each segment is represented with a single excitatory and inhibitory population. Therefore, our model does not capture the known molecular underpinnings of the homeostatic mechanisms that regulate synaptic efficacy and channel function in Drosophila (Tripodi et al., 2008; Davis and Mu¨ller, 2015). For instance, what kind of a “sensor” monitors neuronal or muscle activity, and by what mechanisms is presynaptic and postsynaptic function modulated? Yet, the generality of the model allows it to be applied to other circuits where activity-dependent refinement of connectivity leads to appropriate connectivity for generating unidirectional propagation of activity. One example is the generation of spontaneous waves in the developing mammalian cortex; waves are produced by recurrent networks without a particular directionality of connections but travel along stereotypical directions (Lischalk et al., 2009; Conhaim et al., 2010). In conclusion, for the fixed network architecture with nearestneighbor connections, Hebbian mechanisms are unlikely to play a major role in activity-dependent tuning of connectivity in recurrent
J. Neurosci., March 30, 2016 • 36(13):3722–3734 • 3733
bidirectionally connected networks for wave propagation. By contrast, homeostatic plasticity mechanisms, which maintain target levels of activity using spontaneous input, succeed in generating reproducible patterns of stable network connectivity. As such, they are more likely than Hebbian-style mechanisms in regulating activitydependent tuning of bidirectional motor networks for activity propagation. Both mechanisms are likely to be necessary for the refinement of networks with long-range connectivity.
References Abbott LF, Nelson SB (2000) Synaptic plasticity: taming the beast. Nat Neurosci 3:1178 –1183. CrossRef Medline Berni J, Pulver SR, Griffith LC, Bate M (2012) Autonomous circuitry for substrate exploration in freely moving Drosophila larvae. Curr Biol 22: 1861–1870. CrossRef Medline Bienenstock EL, Cooper LN, Munro PW (1982) Theory for the development of neuron selectivity: orientation specificity and binocular interaction in visual cortex. J Neurosci 2:32– 48. Medline Bliss TV, Collingridge GL (1993) A synaptic model of memory: long-term potentiation in the hippocampus. Nature 361:31–39. CrossRef Medline Bliss TVP, Lømo T (1973) Long-lasting potentiation of synaptic transmission in the dentate area of the anaesthetized rabbit following stimulation of the perforant path. J Physiol 232:331–356. CrossRef Medline Borodinsky LN, Root CM, Cronin JA, Sann SB, Gu X, Spitzer NC (2004) Activity-dependent homeostatic specification of transmitter expression in embryonic neurons. Nature 429:523–530. CrossRef Medline Clopath C, Bu¨sing L, Vasilaki E, Gerstner W (2010) Connectivity reflects coding: a model of voltage-based STDP with homeostasis. Nat Neurosci 13:344 –352. CrossRef Medline Conhaim J, Cedarbaum ER, Barahimi M, Moore JG, Becker MI, Gleiss H, Kohl C, Moody WJ (2010) Bimodal septal and cortical triggering and complex propagation patterns of spontaneous waves of activity in the developing mouse cerebral cortex. Dev Neurobiol 70:679 – 692. CrossRef Medline Couton L, Mauss AS, Yunusov T, Diegelmann S, Evers JF, Landgraf M (2015) Development of connectivity in a motoneuronal network in Drosophila larvae. Curr Biol 25:568 –576. CrossRef Medline Crisp S, Evers JF, Fiala A, Bate M (2008) The development of motor coordination in Drosophila embryos. Development 135:3707–3717. CrossRef Medline Crisp SJ, Evers JF, Bate M (2011) Endogenous patterns of activity are required for the maturation of a motor network. J Neurosci 31:10445– 10450. CrossRef Medline Davis GW (2006) Homeostatic control of neural activity: from phenomenology to molecular design. Annu Rev Neurosci 29:307–323. CrossRef Medline Davis GW, Mu¨ller M (2015) Homeostatic control of presynaptic neurotransmitter release. Annu Rev Physiol 77:251–270. CrossRef Medline Davis GW, DiAntonio A, Petersen SA, Goodman CS (1998) Postsynaptic PKA controls quantal size and reveals a retrograde signal that regulates presynaptic transmitter release in Drosophila. Neuron 20:305–315. CrossRef Medline Dickson BJ, Gilestro GF (2006) Regulation of commissural axon pathfinding by Slit and its Robo receptors. Annu Rev Cell Dev Biol 22:651– 675. CrossRef Medline Fedirchuk B, Wenner P, Whelan PJ, Ho S, Tabak J, O’Donovan MJ (1999) Spontaneous network activity transiently depresses synaptic transmission in the embryonic chick spinal cord. J Neurosci 19:2012–2112. Medline Feller MB (2009) Retinal waves are likely to instruct the formation of eyespecific retinogeniculate projections. Neural Dev 4:24. CrossRef Medline Fox LE, Soll DR, Wu CF (2006) Coordination and modulation of locomotion pattern generators in Drosophila larvae: effects of altered biogenic amine levels by the tyramine  hydroxylase mutation. J Neurosci 26: 1486 –1498. CrossRef Medline Froemke RC, Dan Y (2002) Spike timing-dependent synaptic modification induced by natural spike trains. Nature 416:433– 438. CrossRef Medline Gavin˜o MA, Ford KJ, Archila S, Davis GW (2015) Homeostatic synaptic depression is achieved through a regulated decrease in presynaptic calcium channel abundance. eLife 4:e 05473. CrossRef Medline Giachello CN, Baines RA (2015) Inappropriate neural activity during a sen-
3734 • J. Neurosci., March 30, 2016 • 36(13):3722–3734 sitive period in embryogenesis results in persistent seizure-like behavior. Curr Biol 25:2964 –2968. CrossRef Medline Gjorgjieva J, Berni J, Evers JF, Eglen SJ (2013) Neural circuits for peristaltic wave propagation in crawling Drosophila larvae: analysis and modeling. Front Comput Neurosci 7:24. CrossRef Medline Gonzalez-Islas C, Wenner P (2006) Spontaneous network activity in the embryonic spinal cord regulates AMPAergic and GABAergic synaptic strength. Neuron 49:563–575. CrossRef Medline Hand RA, Kolodkin AL (2015) Semaphorin regulation of neural circuit assembly in the central nervous system. In: Semaphorins, pp 19 –37. New York: Springer. Hanson MG, Landmesser LT (2004) Normal patterns of spontaneous activity are required for correct motor axon guidance and the expression of specific guidance molecules. Neuron 43:687–701. CrossRef Medline Hebb DO (1949) The organization of behavior. New York: Wiley. Heckscher ES, Lockery SR, Doe CQ (2012) Characterization of Drosophila larval crawling at the level of organism, segment, and somatic body wall musculature. J Neurosci 32:12460 –12471. CrossRef Medline Huberman AD, Feller MB, Chapman B (2008) Mechanisms underlying development of visual maps and receptive fields. Annu Rev Neurosci 31: 479 –509. CrossRef Medline Katz LC, Shatz CJ (1996) Synaptic activity and the construction of cortical circuits. Science 274:1133–1138. CrossRef Medline Kirkby LA, Sack GS, Firl A, Feller MB (2013) A role for correlated spontaneous activity in the assembly of neural circuits. Neuron 80:1129 –1244. CrossRef Medline Klein R, Kania A (2014) Ephrin signalling in the developing nervous system. Curr Opin Neurobiol 27:16 –24. CrossRef Medline Kremer MC, Christiansen F, Leiss F, Paehler M, Knapek S, Andlauer TF, Fo¨rstner F, Kloppenburg P, Sigrist SJ, Tavosanis G (2010) Structural long-term changes at mushroom body input synapses. Curr Biol 20: 1938 –1944. CrossRef Medline LeMasson G, Marder E, Abbott LF (1993) Activity-dependent regulation of conductances in model neurons. Science 259:1915–1917. CrossRef Medline Lischalk JW, Easton CR, Moody WJ (2009) Bilaterally propagating waves of spontaneous activity arising from discrete pacemakers in the neonatal mouse cerebral cortex. Dev Neurobiol 69:407– 414. CrossRef Medline Liu Z, Golowasch J, Marder E, Abbott LF (1998) A model neuron with activity-dependent conductances regulated by multiple calcium sensors. J Neurosci 18:2309 –2320. Medline Li WC, Cooke T, Satois B, Soffe SR, Borisyuk R, Roberts A (2007) Axon and dendrite geography predict the specificity of synaptic connections in a functioning spinal cord network. Neural Dev 2:1–18. CrossRef Malenka RC, Bear MF (2004) LTP and LTD: an embarrassment of riches. Neuron 44:5–21. CrossRef Medline Malenka RC, Nicoll RA (1999) Long-term potentiation–a decade of progress? Science 285:1870 –1874. CrossRef Medline Marchetti C, Tabak J, Chub N, O’Donovan MJ, Rinzel J (2005) Modeling spontaneous activity in the developing spinal cord using activitydependent variations of intercellular chloride. J Neurosci 25:3601–3612. CrossRef Medline Marder E (2012) Neuromodulation of neuronal circuits: back to the future. Neuron 76:1–11. CrossRef Medline Marder E, Goaillard JM (2006) Variability, compensation and homeostasis in neuron and network function. Nat Rev Neurosci 7:563–574. CrossRef Medline Marder E, Rehm KJ (2005) Development of central pattern generating circuits. Curr Opin Biol 15:86 –93. CrossRef Medline Markram H, Lu¨bke J, Frotscher M, Sakmann B (1997) Regulation of synaptic efficacy by coincidence of postsynaptic APs and EPSPs. Science 275: 213–215. CrossRef Medline Martin SJ, Grimwood PD, Morris RG (2000) Synaptic plasticity and memory: an evaluation of the hypothesis. Annu Rev Neurosci 23:649 –711. CrossRef Medline Miller KD (1992) Models of activity-dependent neural development. Semin Neurosci 4:61–73. CrossRef Medline Miller KD, Keller JB, Stryker MP (1989) Ocular dominance column development: analysis and simulation. Science 245:605– 615. CrossRef Medline Myers CP, Lewcock JW, Hanson MG, Gosgnach S, Aimone JB, Gage FH, Lee
Gjorgjieva et al. • Homeostatic Tuning of Recurrent Networks KF, Landmesser LT, Pfaff SL (2005) Cholinergic input is required during embryonic development to mediate proper assembly of spinal locomotor circuits. Neuron 46:37– 49. CrossRef Medline O’Donovan MJ (1999) The origin of spontaneous activity in developing networks of the vertebrate nervous system. Curr Opin Neurobiol 9:94 – 104. CrossRef Medline O’Leary T, Williams AH, Franci A, Marder E (2014) Cell types, network homeostasis, and pathological compensation from a biologically plausible ion channel expression model. Neuron 82:809 – 821. CrossRef Medline Pe´rez-Otan˜o I, Ehlers MD (2005) Homeostatic plasticity and NMDA receptor trafficking. Trends Neurosci 28:229 –238. CrossRef Medline Petersen SA, Fetter RD, Noordermeer JN, Goodman CS, DiAntonio A (1997) Genetic analysis of glutamate receptors in Drosophila reveals a retrograde signal regulating presynaptic transmitter release. Neuron 19: 1237–1248. CrossRef Medline Pozo K, Goda Y (2010) Unraveling mechanisms of homeostatic synaptic plasticity. Neuron 66:337–351. CrossRef Medline Roberts A, Conte D, Hull M, Merrison-Hort R, al Azad AK, Buhl E, Borisyuk R, Soffe SR (2014) Can simple rules control development of a pioneer vertebrate neuronal network generating behavior? J Neurosci 34:608 – 621. CrossRef Medline Song S, Abbott LF (2001) Cortical development and remapping through spike timing-dependent plasticity. Neuron 32:339 –350. CrossRef Medline Strata P, Harvey R (1999) Dale’s principle. Brain Res Bull 50:349 –350. CrossRef Medline Suster ML, Bate M (2002) Embryonic assembly of a central pattern generator without sensory input. Nature 416:174 –178. CrossRef Medline Tabak J, Senn W, O’Donovan MJ, Rinzel J (2000) Modeling of spontaneous activity in the developing spinal cord using activity-dependent depression in an excitatory network. J Neurosci 20:3041–3056. Medline Tabak J, Rinzel J, O’Donovan MJ (2001) The role of activity-dependent network depression in the expression and self-regulation of spontaneous activity in the developing spinal cord. J Neurosci 21:8966 – 8978. Medline Tabak J, Mascagni M, Bertram R (2010) Mechanism for the universal pattern of activity in developing neuronal networks. J Neurophysiol 103: 2208 –2221. CrossRef Medline Tripodi M, Evers JF, Mauss A, Bate M, Landgraf M (2008) Structural homeostasis: compensatory adjustments of dendritic arbor geometry in response to variations of synaptic input. PLoS Biol 6:e260. CrossRef Medline Tritsch NX, Yi E, Gale JE, Glowatzki E, Bergles DE (2007) The origin of spontaneous activity in the developing auditory system. Nature 450: 50 –55. CrossRef Medline Turrigiano GG (1999) Homeostatic plasticity in neuronal networks: the more things change, the more they stay the same. Trends Neurosci 22: 221–227. CrossRef Medline Turrigiano GG (2008) The self-tuning neuron: synaptic scaling of excitatory synapses. Cell 135:422– 435. CrossRef Medline Turrigiano GG, Nelson SB (2004) Homeostatic plasticity in the developing nervous system. Nat Rev Neurosci 5:97–107. CrossRef Medline Turrigiano GG, Leslie KR, Desai NS, Rutherford LC, Nelson SB (1998) Activity-dependent scaling of quantal amplitude in neocortical neurons. Nature 391:892– 896. CrossRef Medline Vitureira N, Goda Y (2013) Cell biology in neuroscience: the interplay between Hebbian and homeostatic synaptic plasticity. J Cell Biol 203:175– 186. CrossRef Medline Warp E, Agarwal G, Wyart C, Friedmann D, Oldfield CS, Conner A, Del Bene F, Arrenberg AB, Baier H, Isacoff EY (2012) Emergence of patterned activity in the developing zebrafish spinal cord. Curr Biol 22:93–102. CrossRef Medline Wilson HR, Cowan JD (1972) Excitatory and inhibitory interactions in localized populations of model neurons. Biophys J 12:1–24. CrossRef Medline Yuan Q, Xiang Y, Yan Z, Han C, Jan LY, Jan YN (2011) Light-induced structural and functional plasticity in Drosophila larval visual system. Science 333:1458 –1462. CrossRef Medline Zenke F, Hennequin G, Gerstner W (2013) Synaptic plasticity in neural networks needs homeostasis with a fast rate detector. PLoS Comput Biol 9:e1003330. CrossRef Medline