significant advantages in modelling noise pdf on the basis of HOS parameters; ... c) HOS allow the detection and the analysis of non-minimum-phase signals.
HOS-based symmetric and asymmetric statistical models of non-Gaussian noise for signal detection optimization* A. Tesei, and C.S. Regazzoni DIBE - University of Genoa. Via Opera Pia 11A - 16145 Genova. Italy Abstract - In the context of digital signal processing addressed to communications, this work focuses attention on the optimization of detection of weak signals in presence of additive independent stationary non-Gaussian noise. In order to optimize the detection performances for low SNR values, the selected binary statistical testing approach consists in a Locally Optimum detector, designed on the basis of new proposed models of non-Gaussian noise probability density function (pdf). The investigated analytical models are expressed in terms of various HOS statistical parameters (of the third and fourth orders). In particular, symmetric (depending on the kurtosis parameter) and asymmetric (in terms of the skewness parameter) pdfs have been studied and mutually compared, in order to describe realistically the non-Gaussian noise and improve detection performances. The various resulting methods have been compared with the Gaussian-hypothesis LO test. Experimental results have shown significant advantages in modelling noise pdf on the basis of HOS parameters; the different methods have been applied for detecting known deterministic test signals corrupted by real ship-traffic-radiated non-Gaussian noise.
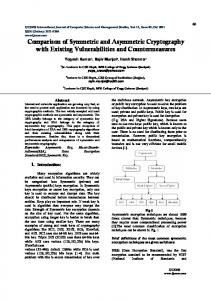
1. INTRODUCTION Conventional digital signal processing algorithms and detection criteria employed in communications, based on the Second Order Statistics (SOS), and optimised in presence of Gaussian noise, may degrade their performances in non-Gaussian environments. The present paper focuses attention on innovative HOS-based noise models for detection in presence of additive, independent and identically distributed (iid), stationary, non-Gaussian noise, under the critical conditions of weak signals (i.e., for very low values of the Signal-to-Noise Ratio - SNR). Detection is dealt with as binary hypothesis testing in the context of statistical inference [1]. In particular, the purpose is to decide between the two hypotheses of the presence and the absence of a transmitted signal [1][2]. noise n(k)
Channel Hc(.)
Transmitter transmitted signal s(k)
+ propagated signal s'(k)
Receiver observation y(k)
detection result
Fig. 1. Mathematical block diagram of a general communication system.
The detection problem is faced with reference to a general digital communication system, as shown in Fig. 1; the system is made up of three main blocks: a. a source of deterministic or stochastic signals, {s(k), k=1, .., K}; b. a propagation channel that uses an input/output function, Hc(.), and adds to the transmitted signal independent, stationary, generally non-Gaussian noise, {n(k), k=1, .., K}, consisting of iid samples; c. a receiver of the resulting observation, {y(k), k=1, .., K}, from which to decide between the presence or the absence of a signal {s(k)}. Attention is focused on the receiver block; the other modules are simplified: *
The present work was partially supported by the European Community in the context of the MAST-I SNECOW Project (MAST 0029-C(A)).
a) the signals emitted are deterministic and have simple shapes (e.g., impulses, sinusoids, etc.); b) the transfer function can only attenuate the signals transmitted (Hc(ω)=G, G is constant, G≤1). Under these assumptions, detection optimization can be reached by selecting the most suitable: 1. binary hypothesis statistical detection criteria, 2. signal processing techniques for noise characterization as a basis for designing detection algorithms. For improving detection performances with generalized noise environments and low SNR values (about 15÷-5 dB), the Locally Optimum (LO) class of detectors is selected [1]; in this paper attention is focused on signal processing approaches for noise modelling aimed at LO-detector design. 1.1 Selection of HOS-based signal processing techniques Conventional processing of deterministic or stochastic signals is based on SOS theory [3], which allows one to describe completely only linear minimum-phase processes, for they can be realistically modelled as linear combinations of statistically uncorrelated harmonic components in time and in frequency. Under the assumptions of deviations from Gaussianity and linearity, the SOS parameters are not sufficient for a complete signal description. HOS-based techniques [4][5] have been selected in the present work as a powerful means to characterise non-Gaussian noise and build efficient and robust detectors on the basis of more complete characterization and more realistic statistical modelling. The main reasons for using HOS to overcome spectral inefficiency are the following analytical properties: a) deviation from Gaussianity is detected if some values in the domains of spectra or cumulants of higher orders than the second one are significantly different from zero; additive Gaussian components are suppressed in the HOS domain; some HOS operators can model deviation from Gaussianity; b) HOS aid in detecting the presence of non-linearities in stochastic processes; c) HOS allow the detection and the analysis of non-minimum-phase signals. This paper is focused on property a). Various recent works have described the use of Higher Order Statistics as the signal-processing basis for non-Gaussian signal detection in Gaussian and non-Gaussian noises: third-order-based algorithms were presented by Hinich and Wilson [6], Kletter and Messer [7], and others; the advantages of a fourth-order statistical parameter (i.e., kurtosis) in noise modelling and signal detection were particularly stressed by Dwyer [8] and Webster [9]. Higher-order moments, cumulants and spectra can be defined as extensions of SOS operators [4][5]. 1.2 Application of detection to a real communication channel characterized by non-Gaussian noise An example of application of the developed methods to real data is given: an underwater acoustic communication system [10] is considered. Data sequences were acquired during an oceanographic campaign conducted in the Southern Adriatic Sea in May 1993 (within the framework of the EEC MAST1 SNECOW Project) [11][12]. The test data were acquired by using a single hydrophone (i.e., a receiving passive underwater acoustic sensor), dropped 30 meter deep from an oceanographic ship, and describe background ship-traffic-radiated noise. The application target consists in detecting deterministic known signals in presence of the acquired noise. The experiments were performed under the critical conditions of shallow-water (from 100 to 600 meter deep) with much ship traffic (on average, about 6-10 ships in a circular area of 12-nm-radius around the fixed receiver). Traffic intensity is associated with the following conditions: a. ship-radiated noise components overcome the other ambient-noise components over a narrow frequency range (from few Hz up to about 1000 Hz); b. traffic ships can be assumed to be uniformly distributed in the area surrounding the receiver. Ship-radiated noise is a complex random process, resulting from the combination (either linear or non linear) of many components. As the noise emitted by a ship is the combination of periodical, almost periodical and slowly varying non-linear components, it is expected to present a series of spikes in its
power spectrum, hence to be non-Gaussian. In the studied application, noise is due to both oceanographic and traffic ships, that is, N independent random sources with very different powers, in particular, few strong sources (the closest ships) and many weak sources (background ships passing far from the sensor). Under these conditions, the resulting noise cannot satisfy the Central Limit Theorem [9], and is expected to be non Gaussian. Table 1 summarizes the main expected noise characteristics. slowly varying periodic or almost periodic time shape stationary iid ⇒ univariate samples non Gaussian very few strong sources and many weak sources Table 1. Main characteristics expected about acoustic ship traffic noise.
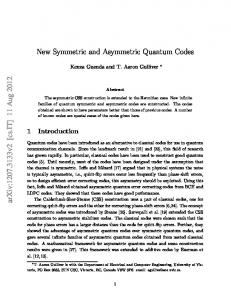
2. DESCRIPTION OF THE METHODS USED AND THEIR APPLICATION TO A REAL CASE If noise is tested to be iid, stationary, non Gaussian (with preliminary statistical analysis, as presented in [11][12]), its pdf has to be modelled analytically in a realistic way for LO-detector design. To this end, two HOS parameters, very easy and quick to estimate, aid in quantifying deviation from Gaussianity; they are skewness (third order) and kurtosis (fourth order). The skewness for a stationary zero-mean iid process {X(k)} can be expressed in terms of the thidr-order cumulant c3x ( ) as: c3x ( 0 , 0 ) = E { X 3 ( k )} Skewness values different from zero imply an asymmetric (hence non-Gaussian) pdf (see Fig. 2). f(x)
c3x (0,0)
(a)
f(x)
f(x)
0 = 0; c4x (0,0,0) = 0
x
0 x c3 (0,0) ### 0
(1)
x
x
0
c4x (0,0,0) ###
(b) Fig. 2. Pdf models differentiated by skewness and kurtosis values.
0
(c)
In the present work a new asymmetric pdf model is presented: it is called "asymmetric Gaussian" pdf, as it directly derives from the Gaussian shape (with consequent advantages in employing it in detector design). It depends on two second-order parameters (deriving from the definition of variance), σ l2 and σ 2r , called respectively "left and right variances" and defined as: Nr Nl 1 1 ( ni − µ )2 ( ni − µ )2 and σ r2 = σ l2 = ∑ ∑ Nr − 1 i =1 Nl − 1 i = 1 (2) ni < µ
ni > µ
(Nl (Nr) is the number of n samples µ)). The model expression follows:
(n−µ) R − 2 | e 2σ | 2 π ( σl + σ r ) paG ( n ) = S (n−µ) − | 2 | e 2σ | + ( ) π σ σ 2 T l r
2
2 l
2 r
n < µ 2
(3)
n ≥ µ
where µ is the mean value. This model is very general (its particular case - when σl=σr - is the Gaussian function) and simple. The left and right variances are linked with the skewness parameter as follows: c3n ( 0 , 0 ) = E {n 3 } =
+∞
z
n 3 pnG ( n ) dn = − 2 σ l4 + 2 σ r4
(4)
−∞
hence they maintain the same level of information as provided by the 3th order statistics. Fig. 2(b) is an example of asymmetric Gaussian pdf where σl