56
IEEE JOURNAL OF SOLID-STATE CIRCUITS, VOL. 42, NO. 1, JANUARY 2007
Hotspot-Limited Microprocessors: Direct Temperature and Power Distribution Measurements Hendrik F. Hamann, Member, IEEE, Alan Weger, James A. Lacey, Zhigang Hu, Pradip Bose, Fellow, IEEE, Erwin Cohen, and Jamil Wakil
Abstract—An experimental technique is presented, which allows for spatially-resolved imaging of microprocessor power (SIMP). In a first step this method utilizes infrared (IR) thermal imaging, while the processor is effectively cooled using an IR-transparent heat sink. In the second step the underlying power distribution is derived by determining the temperature fields for each individual power source on the chip. The measured chip temperature distribution is represented as a superposition of these temperature fields. The SIMP data reveals significant temporal and spatial variations of the microprocessor power/temperature distribution, which can be attributed to the circuit layout as well as to the varying utilization levels across the processor while running full workloads. In this paper we have applied the SIMP method to the dual core PowerPC™970MP microprocessor to measure detailed temperature and power distributions under full operating conditions. In the first part of the paper the impact of power and temperature limitations of high performance CMOS chips is discussed in detail, where we distinguish between hotspot-limited (or temperature-limited) and power-limited chips. The discussion shows the importance of temperature and power distributions for chip floor planning, layout, design and architecture. Second, we present the experimental details of the SIMP method, which is applied to the dual core PowerPC970MP to directly measure the temperature and power fields as a function of workload and frequency. A pronounced movement of the hotspot location is observed. Finally, the hotspot of a competitive microprocessor is compared by measuring temperature efficiencies (temperature increase/performance) for the same workloads and cooling conditions. Index Terms—Cooling, integrated circuit design, integrated circuit layout, microprocessor testing.
I. INTRODUCTION: POWER- AND HOTSPOT-LIMITED CHIPS
I
T IS WELL KNOWN that excessive power dissipation of state-of-the-art CMOS chips has emerged as a major design constraint [1]–[3]. This phenomenon is commonly referred to as the “power limit” or “power wall,” which limits the maximum achievable performance of the digital circuitry. Specifically, a typical CMOS manufacturing line yields a variation of chips with a range of effective gate lengths. Shorter effective gate length translates into faster and higher performing chips while longer effective gate lengths result in slower chips. These
Manuscript received April 16, 2006; revised July 31, 2006. H. F. Hamann, A. Weger, J. A. Lacey, Z. Hu, and P. Bose are with the IBM T.J. Watson Research Center, Yorktown Heights, NY 10598 USA (e-mail:
[email protected]). E. Cohen is with the IBM Systems and Technology Group, Essex Junction, VT 05452 USA. J. Wakil is with the IBM System and Technology Group, Austin, TX 78758 USA. Digital Object Identifier 10.1109/JSSC.2006.885064
different chips are “binned” into different buckets and then sold and marketed accordingly. However, the power consumption increases quite drastically with decreasing gate length, mostly because of increasing source-drain leakage. Because the chip power dissipation cannot be infinite, the power wall limits the performance of the fastest chips by impacting the actual yield for the highest performing chips, which typically account for the largest profits. In the following, we investigate in more detail this “power wall” or “power limit” by referring to the (steady state) Fourier heat conduction equation, which relates generally the (volto the temperature umetric) power distribution via the thermal package parameters distribution : (1) In this equation, the spatial variations of heat flow are described as diffusion process while taking energy conservation into account (net heat flow into an element of the system minus net heat flow out of an element of the system equals the change in energy of the element) [4]. As it is evident from (1), the mean chip temperature is given by the total chip power, but the actual hotspot temperature is determined by the power distribution (rather than the total dissipated power) on the chip. In other words, it is physically possible that a lower power chip can have a more severe hotspot problem than a higher power chip. With this in mind it is useful to distinguish between two general classes of chips, for which the “power wall” has quite different consequences: 1) power-limited chips which are constrained by the power supply such as battery lifetime or current limitations in the interconnects and 2) hotspot-limited chips, which are constrained by reliability and cooling capacity. Realistically, most chips fall between these two cases but this distinction is useful for discussion purposes. In order to clarify the terminology used throughout this paper, we note that a hotspot-limited chip is solely constrained by the junction peak temperatures (independent of the total chip power consumption) while a power-limited chip is only limited by the total chip power (regardless of the junction temperatures). In the following, we have a closer look at the limitations for hotspot-limited chips, which are set by reliability and cooling capacity. Excessive chip temperatures can have a severe impact on failure mechanisms such as electromigration, stress migration and time-dependent dielectric breakdown, all of which are exponentially dependent on the chip temperatures. This reliability problem is further aggravated by the general scaling trend, which has led to a higher transistor density on a chip
0018-9200/$20.00 © 2007 IEEE
HAMANN et al.: HOTSPOT-LIMITED MICROPROCESSORS: DIRECT TEMPERATURE AND POWER DISTRIBUTION MEASUREMENTS
57
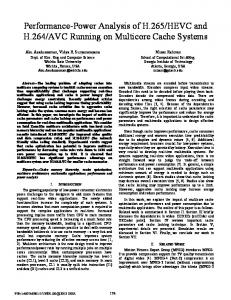
Fig. 1. Example chip power and temperature distribution of different chips, which demonstrate that a power-limited chip should have different design priorities than a hotspot-limited chip. In the upper table, a (25 W) power-limited designed chip is compared to a (100 W) hotspot-limited designed chip. In the lower table, we show the temperature fields for 10 W of power reduction in the lower versus higher power density regions for a (50 W) chip, which is shown on the left next to the table.
(more transistors translates into higher chip-level failure rates), exploding power densities and smaller, even more fragile devices [5]. Naturally, the cooling solution is a very critical component to manage chip temperatures. However, it is important to note that high-end cooling solutions are 1) typically expensive and 2) nonscalable. In fact, cooling technologies have not been able to keep up with the increased power dissipation at a given cost. While air cooling can be pushed to 150 W/cm (average) and maybe slightly higher with additional improvements, the introduction of liquid cooling will cause a major cost jump. Traditionally, chip-level cooling solutions were only a small fraction of the total system cost but, recently these expenses have started to become considerably more significant. For example, it is reported that the chip-level cooling solution beyond 60 W will cost $3.5 per Watt, which excludes further system and datacenter cooling expenses (which can be even higher [6], [7]). Although cooling costs may be lowered by technology advancements, it is clear that package and cooling expenses are starting to have a severe impact on total system costs. Cooling solutions are generally not scalable. Specifically, it seems to be very difficult to envision (cost effective) solutions, which will be able to handle heat loads in the excess of 750 W/cm (which is close to the upper limit of advanced water cooling solutions). With the current projections of increasing power densities [8], the industry could face a very critical barrier in only a few years, even if additional costs could be absorbed or mitigated through new technologies and innovations. It is very important to realize that the “power wall” has quite different consequences for the design whether a chip is hotspotor power-limited. For a power-limited chip, one of the major design considerations is the reduction of total power in the chip. On the other hand however, the details of the power distribution
is a second order concern and only to an extent, where excessive temperatures on the die increase the leakage power disproportionately. In contrast, for a hotspot-limited chip the designer is paying a lot of attention to the actual power distribution across the chip in order to minimize the peak junction temperatures. In other words, the difference in the design priorities for a hotspotor power-limited chip is directly related to the level of granularity of the power, which is considered during chip design. For a power-limited chip, the power granularity equals one while for a hotspot-limited chip the power granularity is larger than one. The minimum required granularity for a hotspot-limited chip is determined by the package parameters, which is discussed in detail elsewhere [9] Fig. 1 shows examples of different chips of the same die size which demonstrate clearly that a power-limited chip should have very different design priorities than a hotspot-limited chip. The left and right columns in the table of Fig. 1 refer to a powerlimited and a hot-spot limited design, respectively. The die size of these illustrative example chips are 18 12 mm and a standard cooling package is assumed [9]. As a first example, the power map with the corresponding temperature distribution for a 25 W (total power) chip is shown in the left column, second row. In this example, the chip has been designed solely with the goal to reduce the total power, but little attention has been paid to the power distribution and thus all the power is concentrated in a small region (i.e., 25 W in 4.5 3 mm ) of the chip, which could be a high performance microprocessor core. As a result of the high local power density (i.e., 185 W/cm ), the 93 K above room temperature increase is substantial ( temperature). By way of comparison, one could think about another chip, which has been designed considering the impact of the power distribution rather than the total power. In the right column, second row, the power and temperature distribution of
58
IEEE JOURNAL OF SOLID-STATE CIRCUITS, VOL. 42, NO. 1, JANUARY 2007
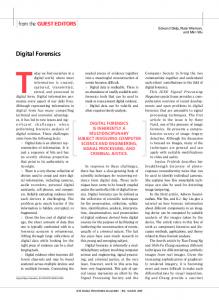
Fig. 2. The SIMP technique. (a) IR thermal measurements using a transparent heat sink (first step). (b) Temperature to power conversion (second step), where the measured chip temperature field is represented as a superposition of the temperature fields for each individual power source. (c) Method for measuring the temperature to power conversion matrix, where a scanning laser beam is focused onto the circuitry side of a dummychip mimicking the individual power sources while the temperature fields for each source are measured.
a 100 W chip is shown, where the power has been uniformly distributed across the chip (46 W/cm ). Although this 100 W chip has 4 the power consumption than the previous example chip, it has only half of the hotspot temperature. Clearly, a lower power chip can have more of a hotspot problem than a higher power chip. Another, more realistic, example is given to the left of the table, which shows the power and temperature distribution of a 50 W chip. This chip has a high power density region (185 W/cm over 4.5 3 mm ) in the corner, which could be a core and a lower power density region (21 W/cm ) in the rest of the chip, which could be caches. As it will be shown further below by the experimental data, such a power and temperature distribution is quite typical. The hotspot temperature for this example is 98 K above room temperature. In the following, we discuss the application of power saving techniques such as clock and power gating for a power-limited and hotspot-limited design, respectively. For the power-limited design, it is irrelevant which region of the chip is targeted by the power saving techniques. For example, the result of 10 W power reduction in the low power density region (from 21 W/cm now to 12 W/cm ) is shown in the left column, third row. Interestingly, although the total power was reduced by 20%, the
peak temperatures are only affected by 2%. On the other hand, for a hotspot-limited chip the designer manages to save 10 W of power in the high power density region (because the design distributes the power more evenly), the temperature reduction is substantial as illustrated in the right column, third row. Although the previous discussion has shown that chip power distributions can be very important—especially if the chip is hotspot-limited—little information about these power distributions is actually available. Currently, one relies on chip power models with various underlying assumptions, which allocate certain amount of power levels over the different units of circuitry based on the chip architecture and processor design [10], [11]. The total chip power can be compared to measurements once hardware is available. Thermal sensors can be used to verify the temperature predictions which are based on these predicted power maps, although the numbers of on-chip thermal sensors is always limited. Generally, power models have not been validated. Furthermore, because power map predictions are lengthy and cumbersome, it is almost impossible to model the respective power distributions for a larger range of realistic workloads (with operating system, etc.), which more accurately represent the actual power distribution during normal operation.
HAMANN et al.: HOTSPOT-LIMITED MICROPROCESSORS: DIRECT TEMPERATURE AND POWER DISTRIBUTION MEASUREMENTS
In this paper, we use the SIMP (spatially-resolved imaging of microprocessor power) technique to measure detailed temperature and power distributions of dual core PowerPC970MP for different workloads, voltages and frequencies. A pronounced movement of the hotspot location can be observed for different workloads, which has naturally important consequences for thermal and power management schemes. Finally, we compare competitive microprocessors by measuring directly temperature efficiencies (temperature increase/performance) for the same workload and cooling conditions. II. SPATIALLY-RESOLVED IMAGING OF MICROPROCESSOR POWER (SIMP) A. First Step: IR Thermal Measurements Using a Transparent Heat Sink In order to gain deeper insights into the power and temperature distributions of a fully operational microprocessor, a simple experimental technique was developed, which allows spatially resolved imaging of microprocessor power (SIMP) [12]–[19]. We describe here the details of the SIMP method, which comprises two steps. The first step involves infrared (IR) thermal measurements, while in the second step, the measured temperature fields are de-convoluted to yield the corresponding power distributions. The first step of this technique is illustrated in Fig. 2(a), which shows a microprocessor cooled by a specifically developed transparent heat sink. While the heat sink cools the chip, the temperature-dependent IR emission from the chip is measured. In order to determine the chip’s thermal distribution using IR thermal imaging, a method for cooling is required which allows removing the heat effectively at high cooling rates W/cm K while being able to simultaneously monitor the temperature distributions. Previous attempts [12], [13] relied on an IR-transparent diamond heat spreader, but the actual cooling rates of this heat sink are typically not sufficient for high power, state of the art microprocessors running full workloads. In addition, this diamond heat spreader involves an interface between the Si chip and the heat spreader, which is naturally difficult to control. In this work, we have implemented an IR-transparent heat sink, which is based on a micro-duct so that an IR-transparent liquid can be flown directly over the chip. As shown in Fig. 2(a), an IR-transparent window is mounted on top of a base plate forming a micro-duct. The duct heights are typically between 0.5 and 2.5 mm. The temperature dependent blackbody IR radiation is picked up with an imaging lens and projected onto a cooled 500 500 InSb array detector. The spatial resolution of the IR setup can range from 120 m down to 3 m depending on the imaging lens. Typically, the backside of the Si die is coated to obtain constant emissivity across the die, which simplifies the conversion from the measured IR signals into actual temperatures. In order to limit the spreading of the heat in the microprocessor die and to enhance the spatial resolution of the temperature image, the microprocessor die is thinned to typically 100 m thickness. The heat removal rates of the IR-transparent sink can be readily adjusted by changing the flow speed, the choice of the IR-transparent liquid and the duct height, thereby emulating
59
different cooling/package conditions and triggering power and thermal management schemes. The range of accessible heat removal rates with this transparent heat sink covers state-of-the-art product cooling solutions as well as future 4 W/cm K). The ability to realize cooling solutions (up to high heat removal rates is very important because it not only enables measurements of state-of-the-art processors under the specified conditions (right frequencies, temperatures, voltages, workloads) and to mimic the correct transient thermal response, but also limits the thermal spreading of the heat throughout the die (potentially washing out the spatial resolution and thermal contrast during the measurements). B. Second Step: Temperature to Power Conversion While the first step of the SIMP technique involves IR thermal measurements of the microprocessor temperature distribution, in the second step, the measured temperature field is de-convolved to obtain the underlying power map. The general concept of this conversion is very simple and based on the fact that the measured chip thermal distributions can be represented as the sum of the individual temperature fields of each individual power source. This concept is illustrated in Fig. 2(b) for a 30 30 power and temperature map. More specifically, the (steady state) chip temperatures are given by
(2) or (3) where is a thermal resistance matrix, a power vector on circuitry level, a temperature vector for each cell at the die’s backside, and are the numbers of cells (to represent the chip and power maps). The coefficients of the A-matrix are thermal repreresistances (e.g., in units of K/W). For example, sents the temperature increase in cell 31 for one unit of power is the temperature increase in cell 12 if in cell 52, while one unit of power is applied to cell 6. The A-matrix itself has to be either calculated (e.g., using computational fluid dynamics (CFD) simulations) or measured. Specifically for the measurements, power sources in form of a scan-able focused laser beam are applied to a dummy chip. The chip is cooled under the same conditions as in the actual experiments in the first step of the SIMP technique while the resulting temperature fields are measured. Fig. 2(c) illustrates this experimental approach to determine the A-matrix, where a laser mimics individual power sources of the processor (the absorption depth in Si is less than 1 m). The spot size of the laser (YAG @ 532 nm) can be readily tuned by the optics and is measured independently by a calibrated CCD camera. In our setup, we have automated the scanning by using a pair of galvo-directing mirrors. Because the absorbed laser power is constant during the A-matrix measurements (as monitored via the back reflection of the laser from the die) and the total chip power is known from electrical measurements (during the first step of the SIMP technique), the exact amount of absorbed laser
60
IEEE JOURNAL OF SOLID-STATE CIRCUITS, VOL. 42, NO. 1, JANUARY 2007
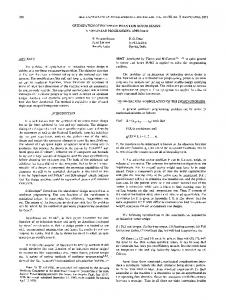
Fig. 3. SIMP validation: (a) Measured temperature distribution using the first step of the SIMP technique. (b) Comparison of the measured IR temperature with 14 resistive thermal sensors on the test chip. (c) Derived power map (granularity 30 20) from the second step of the SIMP technique.
2
power is not necessarily required for the power to temperature conversion. More specifically and referring to (2) and (3), by measuring the total chip power electrically, we have one more , which we can use to solve for the equation power vector. For this particular study, we employed calculated A-matrixes, which are validated using a thermal test chip as described in more detail below. Once the A-matrix has been determined, the corresponding power vector can be readily calculated for each measured (steady state) temperature distribution. Note that the same (superposition) technique can be applied to transient power and temperature distribution. In some cases when solving for the power distribution, we constrain the solution for the power vector (to certain ranges) in order to get better accuracy for the derived power maps. For this equation (3) is solved using a linear least square fit constraining the solutions to a range of values for the power vector.
technique measures the temperatures at the backside. The difference ( 2%) between the backside and circuitry side temperatures again agrees very well with the CFD modeling predictions. Fig. 3(c) shows the derived power map from the second step of the SIMP technique. The data resolves the rectangular heater shape with very good signal to noise ratio. Although the power map in Fig. 3(c) consists of only 30 20 data points, it still demonstrates clearly that the SIMP technique can measure power distributions with quite high accuracy. Adding up the power sources of the power map in Fig. 3(c), which were derived from a (validated) A-matrix, and comparing this to the total electrically measured chip power, we find an agreement of 3% demonstrating the accuracy of the A-matrixes deployed in this work.
C. Validation of SIMP Methodology
A. Temperature and Power Maps of the PowerPC970MP Microprocessor
In order to benchmark the SIMP technique, we applied it to a fully packaged thermal test chip with a known power distribution. The thermal test chip has 14 resistive sensors distributed throughout the die area and a rectangular heater in the upper left corner. Fig. 3(a) shows the measured thermal distribution of this test chip with the heater powered up (using the first step of the SIMP technique). In Fig. 3(b), we compare the measured temperatures with the readings from the resistive thermal sensors, which are not only in excellent agreement with each other but they also agree with computational fluid dynamics calculations (CFD). As it is evident in Fig. 3(b), the temperatures, which are measured by the resistive sensors, are slightly higher because they are located on the circuitry side while the SIMP
III. DIRECT TEMPERATURE AND POWER DISTRIBUTION MEASUREMENTS OF A FULLY WORKING MICROPROCESSOR
The SIMP technique is applied to the dual core PowerPC970MP microprocessor. Fig. 4 shows various temperature and subsequently derived power distributions for the PowerPC970MP microprocessor measured by the SIMP method. Each temperature/power column pair in Fig. 4 refers to a different gray scale bar. The images demonstrate how well the SIMP technique de-convolves the initially measured (and “smeared” out) temperature fields. The image size (including kerfs) is 13.2 11.6 mm and the die thickness of this chip was thinned down to 90 m to enhance the temperature resolution. While the actual pixel resolution of the camera 50 50 m , the spatial resolution of the temperature is
HAMANN et al.: HOTSPOT-LIMITED MICROPROCESSORS: DIRECT TEMPERATURE AND POWER DISTRIBUTION MEASUREMENTS
Fig. 4. Temperature and subsequently derived power distributions (granularity: 30
61
2 30) for the PowerPC970MP microprocessor measured by the SIMP method.
Fig. 5. Power distribution overlaid with the floorplan (left) and a die image (right) of the PowerPC970MP microprocessor running a high power workload.
map is governed by the die thickness (here approximately to 100 m) as discussed in detail in [9]. In this reference, the minimum required granularity for power distributions has been calculated to predict accurately chip temperature fields. Specifically, transfer functions between initial power distributions and resulting temperature fields for various packages and cooling conditions were derived. Two-dimensional (2-D) Fast Fourier Transform of the temperature profiles were carried out in order to establish spatial cutoff frequencies, which relates to the minimum granularity required for thermal analysis. The resolution of the power maps shown in Fig. 4 are governed by the granularity of the A-matrix (440 386 m ), which could be in principle much higher (but not higher than the temperature resolution). As demonstrated in [9], this granularity is sufficient to represent the measured temperature distribution within less than 1%.
In the first two columns of Fig. 4, the respective temperature and power distributions are shown for three different workloads: DC, IDLE, and a high power workload (here for 1.6 GHz, V). In the third and fourth columns, the temperature and corresponding power maps for the IDLE workload are shown V). In the first row, both cores (here for 2.0 GHz and are running and in the second row the left core is running while the right core has been entirely turned off. Finally, in the third row the left core has been powered down. Fig. 5 allows a closer look at the power distribution during the high power workload, where the measured power map is overlaid with a coarse floorplan (left) and the die picture (right). The data enables us to assign the power levels to the individual units, which is critical to develop more temperature and power efficient chips. Specifically for the PowerPC970MP, sub units of the VMX (SIMD/vector) engine, ISU (instruction sequencing
62
IEEE JOURNAL OF SOLID-STATE CIRCUITS, VOL. 42, NO. 1, JANUARY 2007
Fig. 6. Thermal distribution of a standard (non-IBM) desktop microprocessor during bootup of the operating system. The dwell time between the images is 10 s.
unit) and FXU (fixed point integer unit) are identified as high power density regions. B. Hotspot Movements and Dynamic Temperature Distributions The data in Fig. 4 shows that the actual position of the hotspot moves quite drastically for the different utilization levels. More specifically, a hotspot movement of more than 2 mm is observed from single to dual core operation demonstrating that thermal sensors readings and their actual differences to the peak temperare workload dependent. Evidently, this can have atures a significant impact for the thermal and power management. The hotspot movement can be explained readily by referring to the power map in Fig. 5. With both cores running, the thermal cross-talk between the FXUs governs the hotspot (which is close to the middle of the processor) while with only one core running, the SIMD/vector engine power shifts the hotspot over to the side. In order to demonstrate how dynamic the chip temperature and power distributions are, we show in Fig. 6 a series of measured thermal distributions for a standard desktop, (non-IBM) microprocessor during bootup of an operating system. The die of this chip is approximately 1 cm , which has been thinned down to less than 100 m. The first thermal image (A) shows the temperature before the initial bootup with the microprocessor at room temperature while the subsequent images in Fig. 4 show the temperature distributions spaced by 10 s. The time of acquiring an individual temperature distribution is less than 50 ms. The data reveals significant temporal and
spatial variations of the temperature fields, which is due to the circuit layout as well as the varying utilization levels across the processor during bootup. For example, in most images one or even two very pronounced hotspots are measured. After some very high peak temperatures [see Figs. 6(B)–(G)] during the initial phase of the bootup, lower temperatures can be observed in Fig. 6(H) before suddenly higher temperatures return. C. Competitive Comparison As part of the SIMP methodology, the processor has to be re-packaged into the transparent heat sink, which cooling conditions can be controlled very accurately. As a result, SIMP enables us to compare the hotspots of competitive microprocessors under (almost) identical cooling conditions. Specifically, we have investigated several competitive microprocessors by measuring the dynamic temperature distributions for 26 SPEC20001 benchmarks. For example, in Fig. 7 we compare the predecessor of the PowerPC970MP (single core) with a competitive microprocessor running the same spec benchmark under identical cooling conditions. In this example, the PowerPC processor dissipates 79 W (average power density of 125 W/cm while the competitive processor consumes 85 W (average power density of 80 W/cm ). In order to compare these processors more quantitatively, we have integrated the over the run time measured chip peak temperatures of a series of spec benchmarks and then divided by the total run time (i.e., integrated peak temperatures/performance). Applying this metric for the spec benchmarks, we find that the 1http://www.spec.org
HAMANN et al.: HOTSPOT-LIMITED MICROPROCESSORS: DIRECT TEMPERATURE AND POWER DISTRIBUTION MEASUREMENTS
63
Fig. 7. Comparison of the thermal distribution of the PowerPC970MP predecessor with a competitive microprocessor running the same workload under the same cooling conditions.
Fig. 8. Temperature distribution of the dual P0WER5 microprocessor with and without clock gating.
PowerPC processor is significantly more temperature efficient for the same performance) than its competitor (less (although it has a higher average power density). The data suggest that the competitive microprocessor has a much higher local power density, which disproportionally drives up the peak temperatures. The pronounced hotspot of the competitive microprocessor is also evident during other workloads such as OS bootup. It is interestingly to note that when comparing the measured temperature efficiencies (peak temperature/performance) with simultaneously measured power efficiencies
(energy/performance) we find that the differences between processors are significantly larger for the temperature efficiencies than for power efficiencies. D. Implications for Circuit Design, Chip Floor Planning, and Processor Architecture The SIMP technique can be quite important for circuit design, floor planning and processor architecture. For example, the power maps can be directly used to benchmark current chip power models by comparing the actual power distributions with
64
IEEE JOURNAL OF SOLID-STATE CIRCUITS, VOL. 42, NO. 1, JANUARY 2007
the originally predicted power maps from pre-silicon modeling tools at the various stages of the microprocessor design [20]. Eventually, this will result in improved pre-silicon modeling capabilities, which will be critical to guide the design of more power and temperature efficient microprocessors. In addition, the detailed temperature and power distribution information can have a direct impact on chip floor planning for next generation processors that are under design. Finally, this technique can be very important to understand, in which regions it is most beneficial to apply power saving techniques. For example, we have quantified the temperature benefits of clock gating for the POWER5 microprocessor as shown in Fig. 8. Specifically, we find for a particular workload that clock gating can reduce the hotspot temperature by 14% accompanied with 18% of total power reduction. The SIMP methodology allows us to understand the relative temperature-performance and power-performance efficiencies of alternate execution modes: e.g., the efficacy of running the two POWER5 cores in a two-way shared memory multiprocessor (SMP) configuration (with each core executing in single-thread mode) or in a four-way SMP mode (with each core executing two simultaneously multithreaded tasks). With a parameterized pre-silicon simulator that has been validated and calibrated once using the SIMP technique, one can study various power versus temperature versus performance tradeoffs early in the design cycle of future microprocessors in the same architectural family. Such a facility enables the design team to make the right decisions during the crucial early-stage microarchitectural design phase. In the absence of such accurately validated simulators, the design team is likely to make fundamentally erroneous choices in microarchitecture, circuit design and floor planning.
IV. CONCLUSION In this paper, we have discussed the importance of power and temperature distributions for hotspot-limited chips. The details of a new experimental technique—spatially-resolved imaging of microprocessor power, or SIMP—are presented, which can measure detailed power and temperature distributions of microprocessors under full operating conditions. In this paper, we applied this technique to the dual core PowerPC970MP microprocessor to measure detailed temperature and power distributions as a function of workload and frequency. We believe that this methodology is very important to understand and diagnose high power density regions and hotspots in microprocessors, which is vital for designing the appropriate cooling and package solutions. The technique can be used benchmarking chip power models, which will be critical to guide the design of more power and temperature efficient microprocessors. The data presented in this paper show dynamically changing temperature distributions of fully operational chips with significant hotspot movements, which is in particular important for power and thermal management schemes. Finally, we have compared the temperature efficiencies of two competitive microprocessors demonstrating that the PowerPC processor is more temperature efficient than its competitor despite having a higher average power density
REFERENCES [1] D. J. Frank, “Power constrained CMOS scaling limits,” IBM J. Res. & Dev., vol. 46, pp. 236–246, Mar./May 2002. [2] M. Horowitz, E. Alon, D. Patil, S. Naffziger, R. Kumar, and K. Bernstein, “Scaling, power, and the future of CMOS,” in Proc. IEDM, Dec. 2005 [Online]. Available: http://mos.stanford.edu/papers/mh_iedm_05.pdf [3] L. Gwennap, “Power issues may limit future CPUs,” Microprocessor Report, vol. 10, no. 10, Aug. 1996. [4] J. E. Sergent and A. Krum, Thermal Management Handbook: For Electronic Assemblies. New York: McGraw-Hill, 1998. [5] “Failure mechanisms and models for semiconductor devices,” Joint Electron Device Eng. Council Pub., JEP122-A, 2002. [6] S. H. Gunther, F. Binns, D. M. Carmean, and J. C. Hall, “Managing the impact of increasing microprocessor power consumption,” Intel Technol. J., vol. Q1, pp. 1–9, Mar. 2001. [7] V. Tiwari, D. Singh, S. Rajgopal, G. Mehta, R. Patel, and F. Baez, “Reducing power in high-performance microprocessors,” presented at the 35th Design Automation Conf., San Francisco, CA, Jun. 1998. [8] R. C. Chu, “The challenges of electronic cooling: past, current and future,” J. Electron. Packag., vol. 126, pp. 491–500, Dec. 2004. [9] K. Etessam-Yazdani, H. F. Hamann, and M. Asheghi, “Impact of power granularity for chip thermal modeling,” presented at the 9th ITherm Conf., San Diego, CA, May 2006. [10] P. Bose, T. M. Conte, and T. M. Austin, Eds., “Challenges in processor modeling and validation,” IEEE Micro, vol. 19, no. 3, pp. 9–14, May/Jun. 1999, Special issue on Identifying design bugs: processor modeling and validation. [11] R. Desikan, D. Burger, and S. Keckler, “Measuring experimental error in microprocessor simulation,” in Proc. 28th Annu. Int. Symp. Computer Architecture, Göteborg, Sweden, Jun./Jul. 2001, pp. 266–277. [12] T. M. Eiles, D. Hunt, and D. Chi, “Transparent heat spreader for backside optical analysis of high power microprocessors,” in Proc 26th ASM Int. Symp. Testing and Failure Analysis, Bellevue, WA, Sep. 2000, pp. 547–551. [13] H. L. Davidson, “Method for cooling backside optically probe integrated circuits,” U.S. Patent 6,140,141, Oct. 31, 2000. [14] K. C. Steven, “IC device under test temperature control fixture,” U.S. Patent 6,191,599, Feb. 20, 2001. [15] S. Guha, H. F. Hamann, J. A. Lacey, M. McGlashan-Powell, M. P. O’Boyle, and R. J. von Gutfeld, “Transparent cooling duct,” U.S. Patent application 20050094706, 2005. [16] H. F. Hamann, “Spatially resolved imaging of micro-processor power,” in IEEE ISSCC Dig. Tech. Papers, 2005, p. 16. [17] A. J. Weger, J. A. Wakil, R. J. von Gutfeld, H. F. Hamann, J. A. Lacey, and M. P. O’Boyle, “Method and system for measuring temperature and power distributions of a device in a package,” U.S. Patent application 20060039114, 2006. [18] H. F. Hamann, A. Weger, J. Lacey, E. Cohen, and C. Atherton, “Power distribution measurements of the PowerPC970MP microprocessor,” in IEEE ISSCC Dig. Tech. Papers, 2006, pp. 535–537. [19] H. F. Hamann, J. Lacey, A. Weger, and J. Wakil, “Spatially-resolved imaging of microprocessor power (SIMP),” presented at the 9th ITherm Conf., San Diego, CA, May 2006. [20] D. Brooks, P. Bose, V. Srinivasan, M. K. Gschwind, P. G. Emma, and M. G. Rosenfield, “New methodology for early-stage, microarchitecture-level power-performance analysis of microprocessors,” IBM J. Res. & Dev., vol. 47, Sep./Nov. 2003.
Hendrik F. Hamann (M’01) received the Diploma in 1992 and the Ph.D. degree in 1995 from the University of Goettingen, Germany. He is currently a Research Manager for Photonics and Thermal Physics in the Physical Sciences Department at IBM’s T. J. Watson Research Center, Yorktown Heights, NY. During 1995 and 1999, he worked at JILA (Joint Physics Institute between the University of Colorado and NIST) as a Research Associate in Boulder, Colorado. In 1999, he joined IBM Research as a Visiting Scientist. Since 2001, he has been leading the Thermal Physics program in IBM Research, first as a Research Staff Member and currently as a Research Manager. Dr. Hamann is a member of the American Physical Society (APS) and IEEE.
HAMANN et al.: HOTSPOT-LIMITED MICROPROCESSORS: DIRECT TEMPERATURE AND POWER DISTRIBUTION MEASUREMENTS
Alan Weger received the B.S. degree in electrical engineering and computer science from the Massachusetts Institute of Technology, Cambridge, in 1981. He is an Advisory Engineer in the Optical Communications and High Speed Test Department at the IBM Thomas J. Watson Research Center, Yorktown Heights, NY. He has spent 21 years in product development and field operations in the semiconductor industry, in the areas of optical lithography, x-ray lithography, and microprocessor test and diagnostics.
James A. Lacey received the degree in applied science and electronics from the Academy of Aeronautics, Queens, NY. He is a Senior Lab Specialist at the IBM T. J. Watson Research Center, Yorktown Heights, NY. He is currently working on thermal imaging studies of microprocessors. In 2002, he was named an IBM Master Inventor.
Zhigang Hu received the M.S. degree from the Chinese Academy of Sciences, Beijing, and the Ph.D. degree from Princeton University, Princeton, NJ. He is a Research Staff Member at the IBM T. J. Watson Research Center, Yorktown Heights, NY. His research interests include power and reliability-aware processor designs.
65
Pradip Bose (M’79–SM’92–F’06) received the B.Tech. (Hons.) degree from I.I.T. Kharagpur, India, in 1977 and the M.S. and Ph.D. degrees in electrical and computer engineering from the University of Illinois at Urbana-Champaign in 1981 and 1983, respectively. He joined the IBM T. J. Watson Research Center in 1983, where he is currently a Research Staff Member and Manager of a group on reliability and poweraware microarchitectures. He has been involved in research and development work in support of all the POWER-series, high-end microprocessors marketed by IBM. His current research interests include high performance computer architectures, power, complexity and reliability-aware design, and power-performance-reliability modeling of systems. Dr. Bose served as editor-in-chief of IEEE Micro magazine from 2003 through 2006. He is a Fellow of IEEE.
Erwin Cohen received the B.S. degree in mechanical engineering from the University of Illinois at Urbana-Champaign and the M.S.E. and Ph.D. degrees in electrical engineering from Purdue University, West Lafayette, IN, focusing on solid state and EM. He joined IBM in 1998 and is now in the IBM Systems and Technology Group, Essex Junction, VT. His current work is in signal integrity, power plane noise, package design, and microprocessor cooling.
Jamil Wakil received the B.S. degree in mechanical engineering from Texas A&M University, the B.S. degree in electrical engineering from the University of Texas at Dallas, and the M.S. degree in mechanical engineering from The University of Texas at Austin. He is currently working on package thermal development for IBM microelectronics, focusing on first level thermal enhancement for organic packages. He has been with IBM for six years and has several patents and publications.