May 9, 2017 - a 1-cosine gust, are directly incorporated into the flight control design and optimization .... performance-based approach to design flight control.
Hover Flight Control Design for UAS Using Performance-based Disturbance Rejection Requirements Marcos G. Berrios Tom Berger Mark B. Tischler U.S. Army Aviation Development Directorate Moffett Field, CA, USA
Ondrej Juhasz Frank C. Sanders San Jose State University Research Foundation Moffett Field, CA, USA
ABSTRACT A key class of UAS are VTOL vehicles, which afford the ability to hover and maneuver in tight spaces; often in windy and turbulent conditions. This paper presents the development and flight testing of optimized control laws for the 3DR IRIS+ quadrotor designed to aggressively hold its position in a hover while subjected to wind gusts and turbulence. Performance-based disturbance rejection requirements, such as attitude/position tracking error in turbulence and maximum position displacement for a 1-cosine gust, are directly incorporated into the flight control design and optimization process. A Control Equivalent Turbulence Input (CETI) was then used to simulate turbulence in flight and the optimized control laws allowed for the quadrotor to hold its position to within 3.5 inches, a factor of 13.5 improvement over the stock position hold controller. NOTATION Sδlat Sφref vd vg vy x xe y yd ye δd δlat p pd pe φ φe θ θd θe ωBW
Inner-Loop Input Sensitivity Outer-Loop Input Sensitivity Lateral Velocity Disturbance, ft/sec Lateral Gust Input, ft/sec Lateral velocity, ft/sec Longitudinal Position, ft Longitudinal Position Error, ft Lateral Position, ft Lateral Position Disturbance, ft Lateral Position Error, ft Input Disturbance Lateral Input Roll Rate, deg/sec Roll Rate Disturbance, deg/sec Roll Rate Error, deg/sec Roll Attitude, deg Roll Attitude Error, deg Pitch Attitude, deg Pitch Attitude Disturbance, deg Pitch Attitude Error, deg -135 deg Phase Bandwidth, rad/sec
Presented at the AHS 73rd Annual Forum, Fort Worth, Texas, May 9–11, 2017. This is work of the U.S. Government and is not subject to copyright protection in the U.S. Distribution A. Approved for public release; distribution is unlimited.
Crossover Frequency, rad/sec Damping Ratio Attitude Command Attitude Hold Aviation Development Directorate Aeronautical Design Standard Control Equivalent Disturbance Rejection Bandwidth, rad/sec CDRP Control Equivalent Disturbance Rejection Peak, dB CETI Control Equivalent Turbulence Input DRB Disturbance Rejection Bandwidth, rad/sec DRP Disturbance Rejection Peak, dB GM Gain Margin, dB MIMO Multi-Input Multi-Output MTE Mission Take Element PBDR Performance-based Disturbance Rejection PH Position Hold PM Phase Margin, deg RMS Root Mean Square UAS Unmanned Aerial System VTOL Vertical Take-Off and Landing ωc ζ ACAH ADD ADS CDRB
INTRODUCTION Unmanned aerial systems (UAS) play an increasingly significant role in military, commercial, and recreational aviation. A key class of UAS are vertical take-off and landing (VTOL) vehicles, which afford the ability to hover and ma-
neuver in tight spaces; often in windy and turbulent conditions. Various methods have been proposed to develop flight control systems for VTOL UAS that are capable of rejecting wind gusts and turbulence. These methods include using angular acceleration feedback to allow for increased gains and bandwidth (Ref. 1), tuning of PID controllers to minimize the magnitude of the input disturbance sensitivity function (Ref. 2), estimating wind velocity in flight and eliminating its effect using feedback (Ref. 3), and identifying turbulent airwake spectral properties online for use in an adaptive gust alleviating control law (Ref. 4). Unlike manned aircraft, where handling qualities and pilot subjectivity are important, UAS are inherently performance driven vehicles. For manned aircraft, Mission Task Elements (MTEs) are used to assess the handling qualities via assigned Cooper-Harper Handling Quality Ratings (HQR) (Ref. 5). By definition, MTEs have very specific performance level boundaries. For example, the pilot must maintain the helicopter positioned within ±3 ft of a point on the ground to achieve a Level 1 rating for the Hover MTE. Consequently, without pilot subjectivity, assessing flying qualities becomes purely performance driven. Performance-based disturbance rejection (PBDR) requirements have been used to design control laws for a UH60. Specifically, a stability augmentation system for operation in a ship airwake has been designed by minimizing the power spectrum density of the transfer function between the gust input and aircraft rate responses (Ref. 6). In addition, a PBDR requirement of holding a specified position tolerance in moderate turbulence has been used to tune and flight test outer-loop position hold control laws for a UH-60 (Ref. 7). This paper expands on the previous work by incorporating similar and additional PBDR requirements into the flight control design and optimization process for UAS in hover. The objectives of this research are two-fold. The first objective is to design a control system for a quadrotor that aggressively holds a position over the ground in the presence of wind gusts and turbulence. This objective is accomplished by using the flight control design and optimization methods developed at the Aviation Development Directorate for manned aircraft (Ref. 8) and by including performance-based disturbance rejection requirements directly into the flight control design and optimization process. Two such requirements used in the optimization process are the attitude/position tracking error while hovering in turbulence and the maximum position displacement when subjected to a 1-cosine gust (Ref. 9). The second objective is to use the proposed performance-based approach to design flight control systems with various levels of disturbance rejection characteristics and correlate quantitative performance with existing flying qualities and flight control specifications (e.g., stability margins, crossover frequencies, disturbance rejection bandwidth, etc.).
This paper starts by examining the effects of process disturbances (e.g., turbulence and wind gusts) on a typical attitude command and position hold control system from a block diagram perspective. Next, a description of the test aircraft, a 3DR IRIS+ quadrotor, is given and its dynamic behavior and turbulence model are compared to that of a UH-60. In the “Flight Control Design” section, the performance-based disturbance rejection requirements used to drive the design of an attitude-command/attitudehold (ACAH) and position hold (PH) control system are defined. The resulting performance-based ACAH and PH designs are presented along with flight test results, validation results, and performance comparisons with the stock control systems. Lastly, control law designs with increasing levels of disturbance rejection performance are correlated with typical flying qualities and control law design specifications. DISTURBANCE REJECTION Both random turbulence and discrete gusts are types of process disturbances. The effect of these disturbances on an aircraft’s combined dynamics and control system can be quantified by examining the block diagram interaction between the two. Figure 1 depicts a typical roll attitude command block diagram with pre-filter, P φ , controller K φ , input disturbance filter D(s), and plant G φ . 𝛿d
𝐷(𝑠) 𝜙ref
𝑷𝜙
𝒓𝜙cmd
Σ
𝑣g
𝛿d
𝒚𝜙 e
𝑲𝜙
-
𝛿lat
Σ
𝑮𝜙 𝒚′𝜙
𝑷𝜙 =
𝑃𝜙 (𝑠) 𝑃𝑝 (𝑠)
𝒓𝜙cmd =
𝑲𝜙 = 𝐾𝜙 (𝑠) 𝐾𝑝 (𝑠) 𝜙
𝑮𝑣g =
𝜙 𝑣g 𝑝 𝑣g
(𝑠) (𝑠)
𝒚𝜙 e =
𝜙cmd 𝑝cmd 𝜙
𝑮𝜙 = 𝑮𝛿lat 𝜙e 𝑝e
𝒚𝜙 d =
𝜙
𝑮𝑣g 𝜙d 𝑝d
Σ
𝒚𝜙d
𝜙 𝑝
𝒚𝜙 =
𝒚𝜙
𝜙
𝑮𝛿lat = 𝒚′𝜙 =
𝜙 (𝑠) 𝛿lat 𝑝 (𝑠) 𝛿lat
𝜙′ 𝑝′
Fig. 1. A typical roll attitude feedback block diagram. The error dynamics y φe can be expressed as a function of the reference input φref , the input disturbance δd , and the lateral gust vg as: φ y φe = P φ · φref − S φ G δ D(s) · δd − S φ G φvg · vg lat
where S φ is the matrix of sensitivity functions: � � Sφ φ (s) S pφ (s) φ −1 S φ = (II + G δ K φ ) = lat Sφ p (s) S pp (s)
(1)
(2)
Sδlat (s) = Sφ φ (s) + s · S pφ (s)
The attitude sensitivity function Sφ φ , as used in classical MIMO design, is also referred to as the roll attitude disturbance rejection frequency response (Ref. 10). This response corresponds to the roll attitude output due to a roll attitude disturbance at the sensor measurement: (3)
In general, Si j corresponds to the response j for an input i at the sensor measurement. Setting the reference input to zero isolates the effect of the input disturbance and gust on the error and yields:
0 Magnitude [dB]
0
φ Sφ φ (s) = (s) φd
20
−20 −40
S
δ
lat
S
−60
φφ
s⋅ S
Gφδ D(s) · δd + G φvg · vg ) y φe = −SS φ (G lat
(4)
Of specific interest for this attitude command controller is the attitude error φe due to an input disturbance and gust which is given by: φe = −(Sφ φ (s) + s · S pφ (s)) · (
φ φ (s) · D(s) · δd + (s) · vg ) δlat vg (5)
where the expression (Sφ φ (s) + s · S pφ (s)) is the input sensitivity transfer function: Sδlat (s) ,
δlat (s) = (Sφ φ (s) + s · S pφ (s)) δ˜d
(6)
and it is assumed that p = s · φ . Further simplification of Equation 5 yields: φe = −Sδlat (s) · (
φ φ (s) · D(s) · δd + (s) · vg ) δlat vg
(7)
Given an input disturbance filter D(s), and assuming that the plant dynamics φ /δlat and φ /vg do not change, the input sensitivity function Sδlat directly shows the effect of feedback on φe in the presence of an input disturbance δd and gust vg . A typical input sensitivity frequency response is 2. Disturbances with frequencies such that shown in Figure Sδ ( jω) < 0 dB are attenuated by feedback, however, lat disturbances with frequencies such that Sδlat ( jω) > 0 dB are amplified. Therefore, it is important to shape the sensitivity response such that maximum attenuation is achieved around the frequency range in which the disturbance is most active.
pφ
−80 −1 10
0
1
10 10 Frequency [rad/sec]
2
10
Fig. 2. Typical shape of an input sensitivity function. A similar analysis can be performed for a position feedback block diagram to determine the lateral position error ye due to a process disturbance by augmenting the attitude feedback loop with a position hold controller K y , as shown in Figure 3. For an input disturbance δd and lateral gust vg , the error y e is given by: Gφδ · D(s) · δd + G φvg · vg ) y e = −SS y S φ G y · (G lat
(8)
where S y is the matrix of position outer-loop sensitivity functions: � � Syy (s) Svy (s) −1 S y = (II + G y T φ K y ) = (9) Syv (s) Svv (s) and T φ is the matrix of inner-loop closed-loop responses: φ φ T φ = (II + G δ K φ )−1 G δ K φ P φ lat
lat
(10)
The position and velocity output sensitivity functions Syy and Svv , are also referred to as the lateral position and lateral velocity disturbance rejection frequency responses, respectively (Ref. 10). These responses correspond to the lateral position and velocity outputs due to a lateral position and lateral velocity disturbance at the sensor measurement: 0
Syy (s) =
y (s) yd
Svv (s) =
vy (s) vd
(11)
0
(12)
The position error ye can in turn be expressed as: ye = −(Syy (s) + s · Svy (s)) · (Sφ φ (s) + s · S pφ (s)) y y ·( (s) · D(s) · δd + (s) · vg ) (13) δlat vg
𝛿𝑑
𝐷(𝑠)
𝛿att
𝒓𝑦cmd
Σ
𝒚𝑦e
-
𝑲𝑦
Σ
𝝓ref
𝑷𝜙
𝒓𝜙cmd
𝛿d Σ
𝑲𝜙
-
Σ
𝑣g 𝛿lat
𝑮𝜙
𝒚′𝜙
𝒚𝜙
Σ
𝒚𝑦
𝑮𝑦
𝒚′𝑦
Σ
𝒚𝜙d
𝑦cmd 𝒓𝑦cmd = 𝑣 cmd
𝑦
𝑲𝑦 = 𝐾𝑦 (𝑠) 𝐾𝑣 (𝑠)
𝑮𝑦 =
𝜙 𝑣𝑦 𝜙
𝒚𝑦d
(𝑠)
0
(𝑠) 0
𝑦 𝒚𝑦 = 𝑣 𝑦
𝑦d 𝒚𝑦d = 𝑣 𝑦d
𝒚′𝑦 =
𝑦′ 𝑣𝑦′
𝑦e 𝒚𝑦e = 𝑣 𝑦e
Fig. 3. Lateral-axis position hold control system block diagram.
where the expression (Syy + s · Svy ) is the input sensitivity transfer function of the outer-loop: Sφref (s) ,
φref (s) = (Syy (s) + s · Svy (s)) δatt
(14)
Further simplification of Equation 13 yields: ye = −Sφref (s) · Sδlat (s) y y ·( (s) · D(s) · δd + (s) · vg ) (15) δlat vg The position response to an input disturbance and gust is directly proportional to both the outer-loop input sensitivity Sφref (s) and the input sensitivity of the inner-loop Sδlat (s) without position hold augmentation. This result validates the nested loop optimization strategy (Ref. 7) (Ref. 8). In this strategy, the attitude loop feedback controller is optimized first. Once optimized, the resulting attitude loop controller gains are fixed and then the velocity/position outerloop feedback controllers are optimized. Furthermore, Equation 15 implies that an aircraft’s position hold disturbance rejection performance is directly affected by the aircraft’s attitude disturbance rejection characteristics. Knowing the frequency content of the disturbance D(s) and the aircraft dynamics (e.g., φ /δlat (s), φ /vg (s), etc.) provides insight into how each controller K y and K φ should be designed to attenuate applicable frequencies and produce improved disturbance rejection performance. AIRCRAFT DESCRIPTION The small-scale UAS used in this study is the IRIS+ quadrotor manufactured and sold by 3D Robotics (3DR) (Figure 4). The IRIS+ weighs approximately 2.8 lbs, is 0.3 ft tall, and has a cross motor-to-motor distance of 1.8 ft.
Fig. 4. IRIS+ quadrotor by 3D Robotics.
Identified Model A linear state-space model of the IRIS+ around the hover flight condition was identified from flight test data using frequency domain system identification techniques (Ref. 11). The model was then validated in the time domain with pulse responses not used for system identification, ensuring that an accurate model was used for control law design. Due to the quadrotor’s symmetric configuration, decoupled lateral, longitudinal, directional, and heave models were identified and then combined into a complete six degree-of-freedom model. Example identification results are shown here are for the lateral axis only, but similar results were obtained for the other axes. The form of the identified lateral axis model is given by:
The individual and average freqeuency response fit cost values are given in Table 1. The costs are calculated as a weighted sum of the magnitude and phase errors between the frequency responses from flight data and the model responses (Ref. 11).
Table 1. State-Space Model Identification Fit Costs Response p/δlat ay /δlat v/δ ˙ lat Jave
Cost (J) 63.36 24.52 71.05 52.98
Figure 5 shows an overlay between flight data (black) and the identified model (blue) for the roll rate to lateral input frequency response of the bare-airframe. The figure shows an excellent model fit, which is confirmed by the low individual and average fit costs given in Table 1 (for rotorcraft, costs of J < 100 indicate an excellent agreement (Ref. 11)).
Phase [deg] Magnitude [dB]
v˙ Yv Yp +W0 g cos Θ0 Yδlat v − vg p˙ Lp 0 Lδlat = Lv p φ˙ 0 1 0 0 φ 0 0 δlat 0 0 0 −1/τlag δ˙lat 0 0 + 0 δlat (t − τ) 1/τlag v 0 1 0 0 p p ay = Yv Yp 0 Yδlat φ v˙ Yv Yp +W0 g cos Θ0 Yδlat 0 δlat 0 � � + 1/τlag δlat (t − τ) 1/τlag (16)
Coherence
−40
p/δlat −60
−80 −90 −135 −180 −225 −270 1 0.5
Flight Data Model
0 −1 10
0
1
10
2
10
10
Frequency [rad/sec]
Fig. 5. Roll rate to lateral input, bare-airframe frequency response. Flight data is in black and the identified model in blue.
The identified parameter values as well as their insensitivity and Cram´er-Rao bounds are given in Table 2. All identified parameters are known to good accuracy and not correlated with any other parameters as indicated by their low insensitivity (I ≤ 10% (Ref. 11)) and Cram´er-Rao bound (CR ≤ 20% (Ref. 11)) values. Table 2. State-Space Model Identification Parameter Values Param.
Value
CR (%)
Insens. (%)
A-matrix Yv Yp Lv Lp 1/τlag
-0.1996 0a -0.5363 0a 19.18b
6.62 − 5.78 − −
2.37 − 1.77 − −
B-matrix Yδlat Lδlat
0.128 1.601
6.62 3.46
3.09 1.21
Time delay 0.0122
τ a b
13.83
8.132
Eliminated parameter Fixed parameter
After identification of the lateral model, it was validated in the time-domain using a verification maneuver consisting of a pulse. The roll rate results are shown in Figure 6, which shows good agreement between flight data and the flight identified model.
(1/τr ) of the IRIS+, as shown also in Table 3. Figure 7 shows a comparison of the roll rate response of the IRIS+ and UH-60. The lower roll mode frequency of the IRIS+, due to its lack of angular rate damping, results in a reduction in the phase of the roll rate response of about ∆Φ ≈ −60 deg above ω = 5 rad/sec, which is a primary reason for the addition of a lead compensator in the control system designed for the IRIS+, as will be discussed later.
30 Model
25
Flight Data
φ [deg]
20 15 10
Table 3. Stability and Control Derivative and Mode Comparison Between IRIS+ and UH-60)
5 0
Param. −5 0
0.5
1 Time [sec]
1.5
IRIS+
UH-60
A-matrix
2
Yv [1/sec] Yp [ft/rad-sec] Lv [rad/ft-sec] L p [1/sec]
Fig. 6. Time domain verification of the identified model for a lateral pulse input.
-0.1996 0 -0.5363 0
-0.0544 0.2897 -0.0248 -4.8016
B-matrix [ft/sec2 /%]
Yδlat Lδlat [rad/sec2 /%]
An alternate model of the IRIS+ was identified and presented in (Ref. 12) and (Ref. 13).
0.128 1.601
0.0462 0.1265
2.55 -0.481 2.65
0.405 -0.0265 4.83
Modes Comparison to Manned-Sized Helicopter
The second distinction between the IRIS+ and the UH60 is the lack of angular rate damping of the IRIS+, as is evident by the values of Yp = 0 and L p = 0 (Table 3). The result of this is the lower value of the roll mode frequency
Magnitude [dB]
Table 3 shows a comparison of the primary lateral axis stability and control derivatives between the IRIS+ and a UH-60 (FORECAST hover model used), as well as a comparison of their modes. Two important distinctions can be drawn between the IRIS+ dynamics and those of the UH60. First, as expected for a much smaller vehicle, the dynamics of the IRIS+ are at a much higher frequency. The IRIS+ unstable lateral phugoid mode has a frequency of ωphIRIS+ = 2.55 rad/sec, as compared to the UH-60 unstable phugoid value of ωphUH-60 = 0.405 rad/sec. Using the rule-of-thumb that in order to stabilize an unstable mode, a control system must have a crossover frequency of ωc ≥ 3 to 5 × ωunstable (Ref. 8), we expect typical crossover frequency values of ωc ≥ 13.0 rad/sec for the IRIS+, whereas typical values for the UH-60 are ωc ≥ 2.0 rad/sec. An initial estimate of the crossover frequency is a critical characteristic to know before designing a new control system.
p/δlat [rad/sec/%] 0 IRIS+ UH-60
-20
-40
-60 0 Phase [deg]
Useful insight can be gained by comparing the dynamics of the IRIS+ to those of a manned-sized aircraft since established control law optimization strategies and rulesof-thumb were developed for manned-sized helicopters. Adapting the optimization strategies, rules-of-thumb, and typical control system performance values depends on the dynamics of the bare-airframe.
Phugoid ωph [rad/sec] Phugoid ζph [-] Roll 1/τr [rad/sec]
-90
-180
-270 -1 10
0
10
1
10 Frequency [rad/sec]
2
10
Fig. 7. Roll rate frequency response comparison between IRIS+ and UH-60.
Turbulence Model In addition to the bare-airframe model of the IRIS+, a Control Equivalent Turbulence Input (CETI) model (Ref. 14)
was developed from flight test data (Ref. 12). The CETI model provides the ability to evaluate the response of the IRIS+ to realistic turbulence and predict the control system performance in terms of RMS attitude or position variations. Attitude and position variations in turbulence are key performance parameters, and therefore enforcing limits on them during control system optimization is a direct method of ensuring they are met. Therefore, having a way to accurately estimate them is necessary. Like other turbluence models (e.g., Dryden (Ref. 9)), the CETI model is comprised of white noise passed through a low-pass filter. In this case, the filter is first-order: K δturb (s) = wn (s + a)
(17)
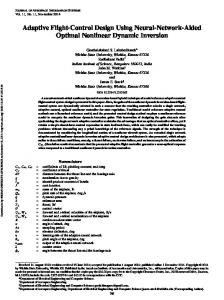
where δturb is the control equivalent turbulence input, given in percent of the maximum control input, and wn is white noise with noise power of 1.0. Table 4 lists the CETI model parameters (gain K and break frequency a) for the IRIS+ and UH-60 medium turbulence CETI models (Ref. 14). Figure 8 shows a comparison of the frequency responses of the two CETI models. Although the CETI model of the IRIS+ has a lower break frequency than that of the UH-60, the steady-state magnitude is higher, as expected for a significantly smaller vehicle that is more susceptible to turbulence. Table 4. Control Equivalent Turbulence Input (CETI) Model Comparison Between IRIS+ and UH-60 Param.
IRIS+
UH-60
K [%] a [rad/sec]
2.64 0.351
1.49 1.05
Control Equivalent Turbulence Input Model [%]
Magnitude [dB]
0
Phase [deg]
Figure 9 shows the block diagram representation of the lateral and longitudinal-axis control system. The controller is comprised of an attitude-command/attitude-hold (ACAH) inner-loop that uses an explicit model following architecture and a simpler position hold (PH) outer-loop feedback controller. A nested-loop design approach is used where first the ACAH inner-loop is designed for the pitch and roll axes to meet a comprehensive set of stability and performancebased disturbance rejection specifications while minimizing actuator activity. Next, the pitch and roll ACAH designs are fixed augmented with the PH controller. The PH controller is similarly designed to meet a set of design specifications. R A direct optimization approach within CONDUIT was used to tune the controller gains (Ref. 8). Performance-based Disturbance Rejection The objective of aggressively holding a position over the ground was accomplished by incorporating performancebased disturbance rejection requirements directly into the design process. For the purposes of this research, the incorporated performance-based specifications consisted of imposing a minimum performance requirement on the aircraft’s disturbance rejection response to CETI turbulence and a 17 ft/sec (10 kt) 1-cosine gust.
CETI(s) =
2.64 δturb (s) = k · wn s + 0.351
(18)
where k = 100 PWM/%. In the “Disturbance Rejection” section, it was shown that the roll attitude response to a process disturbance is given by,
IRIS+ UH-60
-40 0
φ φ (s) = Sδlat (s) · (s) · D(s) δd δlat
-45
-90 -1 10
A control system was designed for the IRIS+ with the objective of aggressively holding a position over the ground in the presence of wind gusts and turbulence.
Control Equivalent Turbulence Input (CETI) As indicated in ”Turbulence Modeling” section, the CETI disturbance used herein is generated by passing white noise through a low-pass filter:
20
-20
FLIGHT CONTROL DESIGN
0
10
1
10 Frequency [rad/sec]
2
10
Fig. 8. Control Equivalent Turbulence Input (CETI) model frequency response comparison between IRIS+ and UH-60.
(19)
where the disturbance transfer function D(s) is now CETI(s). Multiplying the bare-airframe dynamics, φ /δlat (s), with CETI(s) produces the open-loop response of the aircraft to CETI turbulence and is shown in Figure 10. Figure 10 shows that 99% of the total energy in the attitude response of the IRIS+ when subjected to CETI turbulence lies between 0.1 - 5 rad/sec. Therefore, feedback control that provides maximum attenuation within this frequency
δd
𝐏𝐨𝐬𝐢𝐭𝐢𝐨𝐧 𝐇𝐨𝐥𝐝 (𝐏𝐇)
𝑥ref 𝑣𝑥 ref 𝑦ref 𝑣𝑦 ref
Σ
𝜃
-
𝑲PH 𝜙ref ref
𝐀𝐭𝐭𝐢𝐭𝐮𝐝𝐞 𝐂𝐨𝐦𝐦𝐚𝐧𝐝 𝐀𝐭𝐭𝐢𝐭𝐮𝐝𝐞 𝐇𝐨𝐥𝐝 (𝐀𝐂𝐀𝐇) 𝐄𝐱𝐩𝐥𝐢𝐜𝐢𝐭 𝐌𝐨𝐝𝐞𝐥 𝐅𝐨𝐥𝐥𝐨𝐰𝐢𝐧𝐠 (𝐄𝐌𝐅)
δff
෩ −1 𝑮
𝑷cmd
Σ
δfb
δg
𝑫 Σ
δact
𝑮
𝑲ACAH
𝝉
𝜃cmd , q cmd 𝜙cmd , pcmd
Σ
-
𝜃, 𝑞,𝜙, 𝑝
Σ
Σ
𝑥, 𝑣𝑥 , 𝑦, 𝑣𝑦
natt npos
Fig. 9. Laterl and longitudinal-axis control system block diagram consisting of an attitude-command/attitude-hold (ACAH) innerloop and position hold (PH) outerloop.
range will yield improved disturbance rejection characteristics. This response is then attenuated by the input sensitivity function Sδlat (s) to ultimately produce the closed-loop attitude response to turbulence.
3⋅RMS
2 φe [deg]
φ /δlat (s) · CETI(s)
4
40
0
20 Magnitude [dB]
−2 0 3⋅RMS
−20 −40
−4 0
20
99% of total energy
40
60 80 Time [sec]
100
120
Fig. 11. Representative roll attitude error (φe ) response to CETI turbulence.
−60 −80
1.5
−100 0.01
3⋅RMS
0.1 1 5 Frequency [rad/sec]
100 1
Fig. 10. Open-loop response of the IRIS+ roll attitude when subjected to CETI turbulence. ye [ft]
A typical roll attitude error (φe ) and lateral position error (ye ) response of the IRIS+ subjected to CETI turbulence are shown in Figures 11 and 12, respectively. From the response, bounds on the error signal equal to three times the root-mean-square (RMS) are calculated and used as a direct measure of the aricraft’s disturbance rejection performance. During the design process, the RMS of the error signal is computed in the frequency domain by calculating the area under the signal’s autospectrum (Ref. 8) (Ref. 15). Specific performance requirements (e.g., 3·RMS(φe ) ≤ 2 deg ; 3·RMS(ye ) ≤ 0.5 ft) are then imposed and used to drive the flight control design.
0.5 0 −0.5 −1 3⋅RMS
−1.5 0
20
40
60 80 Time [sec]
100
120
Fig. 12. Typical lateral position error (ye ) to CETI turbulence.
1-Cosine Gust Input A lateral 1-cosine gust input is also used to measure the aircraft’s disturbance rejection performance. The lateral gust amplitude, vgust is calculated by: vgust =
vmax (1 − cos(ωg · t)) 2
Figure 15 depicts a typical lateral position response to a 1-cosine vgust . The maximum displacement of the position response is calculated and used as the disturbance rejection performance measure for the gust input.
(20)
2
where vmax is the maximum amplitude of the gust and ωg is the frequency of the input. Figure 13 shows the time history profile of an example lateral 17 ft/sec 1-cosine gust. y [ft]
20
1
e
0
vgust [ft/s]
15
−1 10 Maximum Displacement
−2 0
5
0 0
2
4 6 Time [sec]
8
10
2
4 6 Time [sec]
8
10
Fig. 15. Representative lateral position response to a 1cosine gust.
Fig. 13. Representative 1-cosine gust input. The frequency ωg is dynamically chosen to be the frequency where the maximum magnitude of the gust-toposition (y/vg ) frequency response occurs, as shown in Figure 14. The frequency corresponding to the maximum magnitude provides a “worst-case,” or maximum displacement, response for a pure sinusoidal gust input. The 1-cosine input used here is not a continuous sinusoidal signal, however, produces a near maximal displacement response at ωg .
Attitude Command Attitude Hold (ACAH) Inner-loop Design The lateral-axis ACAH inner-loop control law is shown in Figure 16 with an identical structure used for the longitudinal axis. Both controllers take the form of an explicit model following (EMF) architecture (Ref. 8). This architecture −1 consists of a command model Pφ , inverse plant G˜φ , an equivalent time delay τφ , and the feedback controller Kφ .
y/vg (s)
𝛿d
−15 𝜙ሷ cmd 𝜙ሶ cmd 𝜙cmd
Magnitude (dB)
−20 𝜙ref
−25
𝑷𝜙
𝑣g
𝐷(𝑠) ෩ −1 𝑮 𝜙
δ𝑓𝑓lat
𝝉𝜙
Σ
δ𝑓𝑏lat
Σ
δlat
𝑮𝜙
𝑲𝜙
−30 𝜙෨ cmd , 𝑝cmd
Σ
-
Σ
𝜙, 𝑝
−35 −40 0.1
𝜙d , 𝑝d
ωg 1 Frequency [rad/sec]
5
Fig. 14. Representative lateral position frequency response to a gust input.
Fig. 16. Lateral-axis ACAH inner-loop control law with an EMF architecture.
An EMF architecture is a two-degree of freedom controller and therefore, allows for the separate design of
the inner-loop’s closed loop behavior and the inner-loop’s response to disturbances/modeling uncertainties. The closed-loop response is set by the command model. The command models for both the lateral and longitudinal axes are second order systems with natural frequency ωn = 10 rad/sec and damping ratio ζ = 0.7071.
Kφ (s) = ((
100 s2 + 14.1421s + 100
+ K pφ )φe + K p p pe )Klead (s)
s
Kiθ + K pθ )θe + K pq qe )Klead (s) s
(28)
(21) vg
These command model parameters were chosen based on RC pilot preference.
δd
The equivalent time delay is included to account for filtering delays, sampling delays, and high frequency dynamics that are not modeled by the inverse plant. The equivalent time delay for the lateral and longitudinal axis were calculated to be,
CETI
τφ = 0.0629 sec, τθ = 0.0657 sec
(27)
Similarly, for the pitch axis: Kθ (s) = ((
Pφ (s) = Pθ (s) =
Kiφ
δ෨d
δfflat
Σ
Σ
p δlat
δlat
δfblat
𝑲𝝓
𝑮𝝓
p vg Σ
𝑝
1 𝑠
𝜙
Klead
(22)
Σ Σ
Given a commanded attitude, the bare-airframe dynamics are inverted to estimate the required control input necessary to produce said command. For example, the linearized angular acceleration response in the roll axis is given by: p˙ = Lv · v + Llat · δlat
(23)
Under the assumption that p ≈ φ˙ and approximating the lateral body velocity to be:
K𝑖ϕ 1 𝑠
ϕ෨ cmd p cmd
Kpp Kpϕ
𝑝e Σ
𝜙e Σ
-
-
Σ
𝑝d Σ 𝜙d
Fig. 17. Lateral axis feedback control structure. g φ v≈ s −Yv
(24)
the lateral input required to produce a roll attitude command, φcmd , can be estimated by g · φcmd s −Yv Llat
φ¨cmd − Lv · δfflat =
(25)
Similarly, the longitudinal input required to produce a pitch attitude command, θcmd , is estimated by
δfflon
−g θ¨cmd − Mu · · θcmd s − Xu = Mlon
(26)
The lateral axis feedback controller Kφ is shown in Figure 17 with an identical structure used in the longitudinal axis. It consists of proportional-integral feedback on roll attitude error (φe ), proportional feedback on roll rate error (pe ), and a lead compensator (Klead ) such that:
The lead compensators were included to account for the reduced phase in the bare-airframe dynamics due to a lack of angular rate damping as described in the “Aircraft Description” section. In addition, it is known that there is a clear trade-off between stability margins and disturbance rejection performance (Ref. 16). Generally, as disturbance rejection performance increases, stability margins decrease. Introducing more phase into the system allows for a larger bandwidth controller with increased disturbance rejection capabilities while still ensuring that pre-defined stability margins are met. For both the lateral and longitudinal axes, the lead compensator was chosen to provide 80 deg of phase at a nominal crossover frequency of 20 rad/sec. A low-pass filter with break frequency ω = 100 rad/sec was also included to ensure sufficient roll-off of the control signal at higher frequencies. Inner-Loop Flight Control Design Specifications The feedback gains, K pφ , Kiφ , K p p , K pθ , Kiθ , and K pq were tuned
R in CONDUIT to simultaneously meet a comprehensive set of stability and performance specifications while minimizing actuator usage. Table 5 summarizes the specifications used for the ACAH control law design and provides the constraints imposed on each specification. The gain and phase margin requirements in SAE-AS94900 were reduced from their original values.
Magnitude [dB]
Broken-loop at δlat
Phase [deg]
Source
Constraint
Stability
≥ 0.30 ≥ 10 rad/sec ≤ [4, 3, 2, 1] deg
Actuator Usage Actuator RMS - Process noise disturbance
Generic
Minimize
Inner-Loop Optimization Strategy The PBDR requirement used to drive the design of the ACAH control system was the 3·RMS attitude error of the aircraft when subjected to CETI turbulence. A family of designs was generated by systematically reducing (tightening) the 3·RMS requirement, for both the roll and pitch axes, from 4 to 1 deg. A 3·RMS of 2 deg was found to be a good compromise between performance and stability and was chosen as the final design. The “UAS Flying Qualities Requirements” presents the results for the entire family of designs. Inner-Loop Flight Control Design Results Figure 18 shows the broken-loop response of the lateral axis with a crossover frequency ωc = 22.71 rad/sec, gain margin (GM) of 4.81 dB, and phase margin (PM) of 43.80 deg. The closed-loop response of the lateral axis is also shown in Figure 19 with a -135 degree phase bandwidth of ωBW = 10.61 rad/sec. Figure 20 shows the lateral axis simulation result of subjecting the IRIS+ to CETI turbulence. The time domain results (3·RMS = 2.1 deg) closely matches the predicted 3·RMS obtained in the frequency domain (3·RMS = 2 deg).
−90 −180 −270 −360 0
1
2
10 10 Frequency [rad/sec]
10
Fig. 18. Lateral-axis broken-loop response of optimized design. φ /φref (s) Magnitude [dB]
Generic Generic Generic
−20
−450 −1 10
L.H.P. [4 dB / 35 deg] -
Performance Eigenvalue damping ratio Crossover frequency 3·RMS Attitude Error - CETI Turbulence
0
0 −10 −20 0
Phase [deg]
Generic AS94900 GARTUER
−90 −135 −180 −270 −1 10
0
10 Frequency [rad/sec]
1
10
Fig. 19. Lateral-axis closed-loop response of optimized design.
3 3⋅RMS
2 1 φe [deg]
Eigenvalues Gain/phase margins Nichols robust stab. margins
20
0
Table 5. ACAH Design Specifications Description
40
0 −1 −2 3⋅RMS
−3 0
20
40
60 80 Time [sec]
100
120
Fig. 20. Roll attitude error, φe , of the IRIS+ subjected to CETI turbulence.
The remaining ACAH design results for a 3·RMS requirement of 2 deg are summarized in Table 6 with all design constraints being met.
Table 6. ACAH Control Law Design Specification Comparison with Flight Data
Magnitude [dB]
Roll Axis 4.81 43.80 0.30 22.71 2.00 10.61
0 −20
Flight Data CONDUIT Analysis Model
Phase [deg]
−40 −0
Pitch Axis
−90 −135 −180 −270 1
4.21 39.70 0.30 25.24 2.00 10.39
Coherence
GM [dB] PM [deg] min(ζ ) ωc [rad/sec] 3· RMS(θe ) [deg] ωBW [rad/sec]
φ /φref (s) 20
Design
GM [dB] PM [deg] min(ζ ) ωc [rad/sec] 3· RMS(φe ) [deg] ωBW [rad/sec]
Additionally, the closed loop response obtained from flight data and the analysis model is shown in Figure 22. Excellent agreement is also noted, giving confidence in the accuracy of the analysis model and validity of the implemented design. Similar comparisons between flight data as the analysis model were seen in the pitch axis.
0.5
0 1
Inner-Loop Design Validation In order to flight validate the design, broken-loop and closed-loop sweeps of the optimized design were conducted and frequency responses genR erated using CIFER (Ref. 11). Figure 21 overlays the lateral broken-loop response obtained from flight data and from the analysis model. Excellent agreement between the two responses is seen around crossover.
10 Frequency [rad/sec]
Fig. 22. Closed-loop response comparison between flight data and analysis model with optimized design. Table 7 summarizes the ACAH control law design specifications with those obtained from flight. Excellent agreement is noted in both the lateral and pitch axes. Table 7. ACAH Control Law Design Specification Comparison with Flight Data
Broken-loop at δlat Magnitude [dB]
40
Design
Flight Data
20
CONDUIT Analysis Model
GM [dB] PM [deg] ωc [rad/sec] 3· RMS(φe ) [deg] ωBW [rad/sec]
Phase [deg]
−20 −90 −180
4.81 43.80 22.71 2.00 10.61
45.50 22.67 2.03 11.25
Pitch Axis
−270
GM [dB] PM [deg] ωc [rad/sec] 3· RMS(θe ) [deg] ωBW [rad/sec]
−360 1 Coherence
Flight
Roll Axis
0
0.5
0 1
30
10 Frequency [rad/sec]
4.21 39.70 25.24 2.00 10.39
38.57 24.68 1.89 11.03
50
Fig. 21. Broken-loop comparison between flight data and analysis model with optimized design.
Inner-Loop Flight Test Results The optimized design and the stock IRIS+ “Stabilize” control systems were flown outdoors with simulated CETI turbulence in 2-3 kt winds. The stock “Stabilize” mode is also an attitude command attitude hold controller. Figure 23 shows the resulting roll
attitude error from flight for both the PBDR design and “Stabilize”. A significant improvement can be seen in the performance-based design with a 3·RMS performance measure of 2.03 deg, very close to the predicted/designed value.
20 Stabilize Mode PBDR
Magnitude [dB]
8 6 4 φe [deg]
Sδlat (s)
0
−20
2 0 −40 −1 10
−2 −4 −6 −8 0
Stabilize Mode PBDR
20
40
60 80 Time [sec]
100
120
Fig. 23. Flight data comparison of the roll attitude error between the stock “Stabilize” controller and the performance-based design. Table 8 summarizes the pitch and roll 3·RMS attitude error performance measures obtained from flight. For both axes, the measures obtained from flight data match the designed performance measure of 2 deg very closely and are both over a factor of three smaller than the stock controller. Table 8. 3· RMS Attitude Error Comparison Between Performance-based Design and Stabilize Mode
3· RMS(φe ) 3· RMS(θe )
PBDR [deg]
Stabilize Mode [deg]
2.03 1.89
6.66 6.35
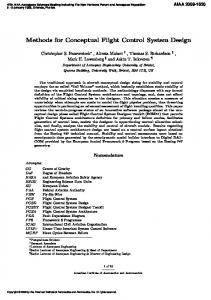
Inner-Loop Discussion Examining the sensitivity functions for both controllers provides insight into the differences in disturbance rejection characteristics that were observed in flight. Figure 24 shows the lateral axis input sensitivity functions Sδlat obtained from analysis for both the PBDR design and the stock controller. Recall that 99% of the total energy in the attitude response of the IRIS+ due to CETI turbulence lies between 0.1 - 5 rad/sec (Figure 10). This frequency range is the critical region for disturbance rejection and where the sensitivity function is most effective in attenuating this type of disturbance. The PBDR design is roughly 5 dB smaller in magnitude within this entire region, leading to larger disturbance attenuation and an overall smaller 3·RMS attitude error performance measure.
0
1
10 10 Frequency [rad/sec]
2
10
Fig. 24. Lateral-axis input sensitivity of the performance-based disturbance rejection design and the stock “Stabilize” controller.
The feedback gain acting on the attitude error that is most effective in shaping the sensitivity function at low frequency is the integrator gain. Proportional-integral feedback can be expressed as: s + (Ki /K p ) (29) s where the integrator-to-proportional gain ratio Ki /K p is the frequency up to which the integral action is effective. A good rule of thumb is to choose this ratio to be 1/5 of the crossover frequency ωc in order to limit the phase loss/lag at that frequency (Ref. 8) (Ref. 17). With a nominal crossover of ωc = 20 rad/sec for the IRIS+, the rule of thumb suggests a ratio of 4. However, significant improvements in disturbance rejection can be obtained by increasing the range of effectiveness of the integrator gain, or equivalently, increasing the integrator-to-proportional gain ratio. This increase in performance comes at a cost of larger phase loss around crossover, further amplifying the need for a lead compensator. Directly incorporating the 3·RMS attitude error performance measure into the design and optimization process exploited this benefit and produced a controller with significant improvements in disturbance rejection properties. The resulting integrator-to-proportional gain ratio obtained from the optimized design is 13, approximately 3/5 of crossover. The stock “Stabilize” controller provides lead compensation in the form of derivative action on the angular rate error which allows for a high-bandwidth controller, however, there is no integral action on the attitude error, only a proportional gain. Kp ·
PH Outer-loop Design Using and fixing the feedback gains of the ACAH innerloop design corresponding to a 3·RMS of 2 deg, position
hold (PH) control laws were developed for the lateral and longitudinal axes. The lateral-axis PH outer-loop control law is shown in Figure 25 with an identical structure used in the longitudinal axis. The feedback controller Ky , consists of proportional-integral feedback on lateral position error (ye ), proportional feedback on lateral velocity error (vye ), and a lead compensator (Kylead ) such that:
Ky (s) = ((
Kiy + K py )ye + K pvy vye ) · Kylead (s) s
(30)
Table 9. PH Design Specifications Description
Source
Constraint
Generic AS94900
L.H.P. [4 dB / 35 deg]
GARTUER
-
Stability Eigenvalues Gain/phase margins - Inner-loop - Outer-loop Nichols robust stab. margins - Inner-loop - Outer-loop
Performance
Similarly, for the pitch axis: Kx (s) = ((
Kix + K px )xe + K pvx vxe ) · Kxlead (s) s
(31)
As with the ACAH inner-loop design, the lead compensators were included to allow for increased gains while ensuring adequate stability margins were still maintained. For both axes, the lead compensator was chosen to provide 45 deg of phase at a nominal outer-loop crossover frequency of ωc = 4 rad/sec. For simplicity, the integrator-toproportional gain ratio was set to 0.8, 1/5 of the nominal outer-loop crossover frequency of 4 rad/sec.
1 s
𝑲𝒚
Ki𝑦
Σ 𝑦cmd 𝑣𝑦 cmd
y Σ e
Kp𝑦
-
Σ Σ
𝑣𝑦 e
Kylead
𝜙ref
K𝑝vy
𝑣𝑦
Σ Σ 𝑣𝑦 d
Eigenvalue damping ratio Crossover frequency - Outer-loop 3·RMS Position Error - CETI Turbulence Max position displacement - 10 kt 1-cosine Gust
Generic Generic
≥ 0.3 ≥ 1 rad/sec
Generic
≤ 0.5 ft
Generic
≤ 1 ft
Actuator Usage Actuator RMS - Process noise disturbance
Generic
Minimize
Outer-Loop Optimization Strategy The performancebased disturbance rejection requirements used in the design of the PH control system were the 3·RMS position error of the aircraft when subjected to CETI turbulence and the maximum displacement of the aircraft due to a 10 kt 1cosine gust. A family of designs were generated by systematically reducing the maximum displacement requirement, for both the lateral and longitudinal axes. In both cases, the performance requirement was reduced until further reduction caused a violation in one of the pre-defined design constraints.
𝑦
yd
Fig. 25. Lateral-axis position hold (PH) control law structure. Outer-Loop Flight Control Design Specifications The feedback gains, K py , K pvy , K px , and K pvx were tuned to simultaneously meet a comprehensive set of stability and performance specifications while minimizing actuator usage. Table 9 summarizes the specifications used for the PH control law design and provides the constraints imposed on each specification.
Outer-Loop Flight Control Design Results During the optimization process, a minimum maximum-displacement to a 1-cosine gust performance measure of 0.37 ft was achieved in the lateral axis, while a minimum performance measure of 0.50 ft was achieved in the longitudinal axis. Figure 26 shows the lateral-axis broken-loop response, broken at the actuator (δlat ), with a crossover frequency of ωc = 22.8 rad/sec, GM of 5.18 dB, and PM of 45 deg. The outer-loop broken-loop response, broken at the roll reference command (φref ) is shown in Figure 27 and has a crossover frequency of ωc = 4 rad/sec, GM of 7.07, and PM of 49.08 deg.
Broken-loop at δlat
0.2 3⋅RMS
50
0.1
0
ye [ft]
Magnitude [dB]
100
Phase [deg]
0
0
−90 −0.1
−180 −270
3⋅RMS
−360 −450 −1 10
−0.2 0 0
1
10 10 Frequency [rad/sec]
20
2
10
Fig. 26. Lateral-axis broken loop response (broken at the actuator, δlat ) of the optimized design.
40
60 80 Time [sec]
100
120
Fig. 28. Lateral position response to CETI turbulence of the optimized design. 1
100
0.5
0
ye [ft]
Magnitude [dB]
Broken-loop at φref
Phase [deg]
−100 0
0
−0.37 −0.5
−90 −180 −270
−1 0
−360 −450 −1 10
0
1
10 10 Frequency [rad/sec]
2
4 6 Time [sec]
8
10
2
10
Fig. 27. Lateral-axis broken loop response (broken at the roll reference command, φref ) of the optimized design. Figure 28 depicts the lateral position response of the vehicle when subjected to CETI turbulence and shows the effectiveness of the PH controller, allowing the aircraft to maintain position within 0.15 ft. In Figure 29, the lateral position response to a 10 kt 1-cosine gust is shown with the vehicle reaching a maximum displacement of the design value 0.37 ft. The remaining lateral and longitudinal PH design results are summarized in Tables 10 and 11, respectively.
Fig. 29. Lateral position response to a 10 kt 1-cosine gust of the optimized design.
Broken-loop at δlat
Table 10. Lateral-Axis PH Control Law Design Results
Position Loop 7.07 49.08 4.0 10.13
Performance min(ζ ) 3· RMS(ye ) [ft] - CETI Turbulence Max Displacement [ft] - 10 kt 1-cosine Gust
Table 11. Longitudinal-Axis PH Control Law Design Results Longitudinal-Axis
Design
Attitude Loop GM [dB] PM [deg] ωc [rad/sec]
4.37 38.19 25.31
Position Loop GM [dB] PM [deg] ωc [rad/sec] ωBW [rad/sec]
7.12 69.36 4.30 10.90
Performance min(ζ ) 3· RMS(xe ) [ft] - CETI Turbulence Max Displacement [ft] - 10 kt 1-cosine Gust
0.30 0.11 0.50
0
−90 −180 −270
0.5
0 1
10 Frequency [rad/sec]
50
Fig. 30. Broken-loop comparison between flight data and analysis model with optimized design.
Additionally, the closed-loop response obtained from flight data and the analysis model is shown in Figure 31. Excellent agreement is noted, validating the analysis model and design implementation. Similar results were noted in the longitudinal axis. y/yref (s) 20 0 −20
Flight Data CONDUIT Analysis Model
−40 −0 −90 −135 −180 −270 1
0.5
0 −1 10
Outer-Loop Design Validation In order to flight validate the PH design, broken-loop and closed-loop sweeps were performed. Figure 30 shows an overlay of the lateral axis broken-loop response (broken at the actuator/inner-loop) obtained from flight data and from the analysis model used for control law optimization. Again, great agreement between the two responses is seen around crossover.
CONDUIT Analysis Model
−360 1
0.30 0.14 0.37
Flight Data
20
−20 0
Magnitude [dB]
GM [dB] PM [deg] ωc [rad/sec] ωBW [rad/sec]
Magnitude [dB]
5.21 44.45 22.97
Phase [deg]
GM [dB] PM [deg] ωc [rad/sec]
Phase [deg]
Attitude Loop
Coherence
Design
Coherence
Lateral-Axis
40
0
10 Frequency [rad/sec]
1
10
Fig. 31. Position hold closed-loop response comparison between flight data and analysis model with optimized design. Table 12 summarizes the PH control law design specifications with those obtained from flight, showing excellent agreement and validating the analysis model and implementation of the control laws on the IRIS+.
Table 12. PH Control Law Design Specification Comparison with Flight Data Design
Flight
Table 13. 3·RMS Position Error Comparison Between Performance-based Design and Loiter Mode Mode
47.00 21.56 3.49
PBDR [ft]
Loiter Mode [ft]
0.28 0.14
3.85 3.13
Roll Axis GM [dB] PM [deg] ωc [rad/sec] Max ygust [ft] ωBW [rad/sec]
Table 13 summarizes the 3·RMS position error obtained from flight for both controllers.
5.18 45.00 22.8 0.37 3.24
3· RMS(ye ) 3· RMS(xe )
Pitch Axis 4.37 38.19 25.31 0.50 3.33
36.73 24.68 3.61
Outer-Loop Discussion In the “Disturbance Rejection” section it was shown that the aircraft’s position hold performance is directly proportional to both the input sensitivity (Sδlat ), with no PH augmentation, and the sensitivity function of the outer-loop (Sφref ). Figure 33 shows the outer-loop sensitivity function obtained from analysis for both the PH PBDR design and the stock controller.
Outer-Loop Flight Test Results The optimized PH design and the stock IRIS+ “Loiter” PH control system were flown outdoors in 2-3 kts of wind with simulated CETI turbulence. Because 1-cosine gusts could not be recreated in flight, the 3·RMS position error was used to measure the performance of each controller. Figure 32 shows the resulting position response for both the PBDR design and “Loiter” mode. A significant improvement can be seen in the PBDR design with a 3·RMS position error of 0.28 ft in the lateral axis and 0.14 ft in the longitudinal axis, an order of magnitude improvement over the stock “Loiter” PH controller.
1 North Position [feet]
10 0 −10 −20 −30 −40 −50 −1 10
2
Loiter Mode PBDR 0
1
10 10 Frequency [rad/sec]
Fig. 33. Outer-loop input sensitivity function analysis model for the performance-based disturbance rejection design and stock “Loiter” control system.
0 −1 −2 Loiter Mode Perf−based Dist. Rejection
−3 −4
Sφref (s)
Magnitude [dB]
GM [dB] PM [deg] ωc [rad/sec] Max xgust [ft] ωBW [rad/sec]
−3
−2 −1 0 East Position [feet]
1
2
Fig. 32. Position response from flight data, for both the performance-based disturbance rejection design and stock “Loiter” control system in CETI turbulence.
As was the case for the input sensitivity without PH augmentation (Figure 24), the magnitude of the performancebased design is much lower than the stock controller within the critical frequency range for disturbance rejection. The lead compensator used in the PH controller allowed for a design with larger gains, and consequently greater attenuation in the outer-loop sensitivity function, while still meeting imposed stability margin constraints. The combined attenuation between Sφref and Sδlat yields the overall disturbance rejection characteristics of the system and is shown in Figure 34.
Sφref (s) · Sδlat (s)
flight values lends validity to the fidelity of the model-based design and to the resulting flying qualities associated with each performance measure.
20
Magnitude [dB]
0
Table 14. 3·RMS Attitude Error Comparison With Flight Data
−20 −40
Design [deg]
Flight (φerr ) [deg]
Flight (θerr ) [deg]
1.00 2.00 3.00 4.00
0.94 2.03 2.99 4.12
1.00 1.89 3.09 3.92
−60 Loiter Mode PBDR 0
1
10 10 Frequency [rad/sec]
2
10
Fig. 34. Input sensitivity function analysis model for the performance-based disturbance rejection design and stock “Loiter” control system.. As expected, the overall response of the performance-based PH design is greatly attenuated when compared to the stock control system. From Bode’s Integral Theorem, it is known that any attenuation of the sensitivity function at a given frequency corresponds to an amplification at another frequency (“water-bed effect”) (Ref. 18). Using a performance-based design process allowed the optimization to “transfer” the energy of the sensitivity function from the lower frequencies where turbulence is active to higher frequencies where the magnitude of the IRIS+ bare-airframe dynamics and the disturbance shaping function roll off (Figures 7 - 8).
Figure 35 shows the gain and phase margins for the four designs superimposed on the stability margin specification from SAE-AS-94900. As expected, an increase in disturbance rejection performance comes at the cost of reduced stability margins with the most aggressive design having a GM of 3 dB and a PM of 26 deg for both axes. 90
ROLL
PITCH
1 deg − 3⋅ RMS Att. Error 2 deg − 3⋅ RMS Att. Error 3 deg − 3⋅ RMS Att. Error 4 deg − 3⋅ RMS Att. Error
80 70 60 PM [deg]
−80 −1 10
50 40 30 20
UAS FLYING QUALITIES REQUIREMENTS Using a performance-based design approach, flight control systems with various levels of disturbance rejection characteristics can be developed. The performance of each design can in turn be correlated with existing flying qualities specifications to provide flight control design guidelines for UAS. The suitability of this approach in determining appropriate values for typical flying qualities is examined by using the four ACAH designs developed with increasing levels of performance. ACAH Metrics The performance-based requirement used during the ACAH flight control design was the 3·RMS attitude tracking error to CETI turbulence. Designs with constraints of 4, 3, 2, and 1 degree 3·RMS tracking error were developed, flight tested with CETI turbulence, and the corresponding flying qualities metrics were tabulated. Table 8 compares the four designed performance measures with those obtained from flight. The excellent agreement between the designed and
10 0 0
5
10 GM [dB]
15
20
Fig. 35. Stability margins for ACAH designs with increasing levels of performance. The crossover frequency ωc for each design is shown in Figure 36. A clear trend of increasing crossover frequency for increasing levels of performance is observed with values ranging from 15 rad/sec for the least aggressive design to over 30 rad/sec.
max|Sφ φ (s)| , max|Sθ θ (s)|
35 ROLL
9
PITCH
ROLL
PITCH
30
25
DRP [dB]
ωc [rad/sec]
8
20
7
6
15
5 1
2 3 4 3⋅RMS Attitude Error [deg]
4 0
Fig. 36. Crossover frequency ωc for ACAH designs with increasing levels of performance. Figure 37 shows the disturbance rejection bandwidth ωDRB for the four designs and Figure 38 the disturbance rejection peak DRP. The attitude disturbance rejection bandwidth is the frequency where the magnitude of the attitude sensitivity function (e.g., Sφ φ from Equation 5) is -3 dB. The criteria was developed by the Aviation Development Directorate (ADD) for full-scale, UH-60 sized rotorcraft (Ref. 10) and established by correlating numerical values with Level 1 CooperHarper handling quality ratings for the hover ADS-33E Mission Task Element flown in turbulence. The attitude disturbance rejection peak is the maximum magnitude of the attitude sensitivity function. Again, a distinct trend is observed. Increasing disturbance rejection bandwidth results in increased performance. The DRB values obtained are approximately a factor of 10 larger than the current ADS-33 values for full-sized vehicles. |Sφ φ (s)| , |Sθ θ (s)| = −3 dB 10 ROLL
PITCH
1 2 3 4 3⋅ RMS Attitude Error [deg]
5
Fig. 38. Disturbance rejection peak (DRP) for ACAH designs with increasing levels of performance.
The -3dB bandwidth and peak magnitude of the input sensitivity function Sδlat has also been used as a disturbance rejection metric and has been refered to as the control equivalent disturbance rejection bandwidth/peak (CDRB/CDRP) (Ref. 19). Figures 39 and 40 show these two metrics. Similar to DRB and DRP, clear trends are seen for the bandwidth and peak of the input sensitivity function. |Sδlat (s)| , |Sδlon (s)| = −3 dB 13 ROLL
PITCH
12 11 ωCDRB [rad/sec]
10
10 9 8 7 6
9 ωDRB [rad/sec]
5
8 4
7
Fig. 39. Control equivalent disturbance rejection bandwidth (CDRB) for ACAH designs with increasing levels of performance.
6 5 4
1 2 3 4 3⋅ RMS Attitude Error [deg]
1 2 3 4 3⋅RMS Attitude Error [deg]
Fig. 37. Disturbance rejection bandwidth (DRB) for ACAH designs with increasing levels of performance.
PH Metrics
max|Sδlat (s)| , max|Sδlon (s)| 13 ROLL
Using the inner-loop design corresponding to a 3·RMS of 2 deg, three outer-loop PH designs were developed with increasing levels of performance. For the lateral axis, designs imposing a maximum 1-cosine gust position displacement of 0.37, 0.5, and 1.0 ft were developed. For the longitudinal axis, performance measures of 0.5 ft, 0.75 ft, and 1.0 ft were used.
PITCH
12 11 CDRP [dB]
10 9 8
The following figures summarize common flying qualities metrics obtained from the three PH designs and are intended to show trends and provide insight into typical values expected for similar type and sized UAS.
7 6 5 4 0
1 2 3 4 3⋅ RMS Attitude Error [deg]
5
Fig. 40. Control equivalent disturbance rejection peak (CDRP) for ACAH designs with increasing levels of performance.
The outer-loop position disturbance rejection bandwidth is the frequency where the magnitude of the position sensitivity function (e.g., Sy y from Equation 9) is -3 dB. Similarly, the outer-loop control equivalent disturbance rejection bandwidth is the frequency where the magnitude of the outer-loop input sensitivity function Sφref is - 3dB.
Figure 41 shows the integrator-to-proportional gain ratio in percent of crossover for the 4 designs. For all four designs, a factor of ≈ 3/5 of ωc is seen, contrast to the 1/5 of ωc rule of thumb.
90 LAT LON
80 70 60
90
ROLL
PM [deg]
100 PITCH
Ki / Kp [ % of ωc ]
80
50 40 30
70
20
60
10
50
0 0
40 30 20 0
1 2 3 4 3⋅ RMS Attitude Error [deg]
5
Fig. 41. Integral-to-proportional gain ratio in percentage of each design’s crossover frequency.
For the metrics shown, clear trends in their correlation with disturbance rejection performance were noted. Each metric alone, however, does not guarantee a certain level of performance and it is important to examine a comprehensive set of specifications. Given a set of specifications that accurately defines the flying qualities of a vehicle, combined with defined performance requirements, a similar performance-based design approach can be used to determine desired flying qualities for UAS.
LAT / LON Max Displacement 0.37 ft 0.5 ft 1.0 ft
5
0.5 ft 0.75 ft 1.0 ft
10 GM [dB]
15
20
Fig. 42. Outer-loop stability margins for PH designs with increasing levels of performance.
max|Syy (s)| , max|Sxx (s)| 5 LAT
6
LON
LAT LON
5.5 5
3
DRP [dB]
ωc [rad/sec]
4
2
4.5 4
1
3.5 3
0 0
0.37 0.5 0.75 1 Max 1−Cosine Gust Displacement [ft]
0.37 0.5 0.75 1 Max 1−Cosine Gust Displacement [ft]
Fig. 43. Outer-loop crossover frequency ωc for PH designs with increasing levels of performance.
Fig. 45. Outer-loop disturbance rejection peak (DRP) for PH designs with increasing levels of performance.
|Syy (s)| , |Sxx (s)| = −3 dB
|Sφref (s)| , |Sθref (s)| = −3 dB 3
2
LAT LON
LAT LON
2.5 ωCDRB [rad/sec]
ωDRB [rad/sec]
1.5
1
2 1.5 1
0.5 0.5
0
0
0.37 0.5 0.75 1 Max 1−cosine Gust Displacement [ft]
Fig. 44. Outer-loop disturbance rejection bandwidth (DRB) for PH designs with increasing levels of performance.
0.37 0.5 0.75 1 Max 1−Cosine Gust Displacement [feet]
Fig. 46. Outer-loop control equivalent disturbance rejection bandwidth (CDRB) for PH designs with increasing levels of performance.
max|Sφref (s)| , max|Sθref (s)| 7 LAT LON
CDRP [dB]
6
5
4
3
2
0.37 0.5 0.75 1 Max 1−Cosine Gust Displacement [feet]
Fig. 47. Outer-loop control equivalent disturbance rejection peak (CDRP) for PH designs with increasing levels of performance.
CONCLUSION A flight control system for the IRIS+ quadrotor was designed and flight tested to aggressively hold a position over the ground in the presence of wind gusts and turbulence. The following conclusions were noted: 1. For any control system with sequential loops, the response of the outer-loop variables to a process disturbance depends on the outer-loop sensitivity function and the inner-loop sensitivity function without the outer-loop closed. This result was shown here for an aircraft control system consisting of an inner attitudehold loop and an outer position-hold loop where the position response to input disturbances (e.g., gust and turbulence) is directly proportional to both the input sensitivity function of the outer-loop Sφref and the input sensitivity of the inner-loop Sδlat (s) without position hold augmentation. Consequently, an aircraft’s position hold performance is a function of its attitude disturbance rejection characteristics. 2. In order to design a high bandwidth controller for the IRIS+ quadrotor with acceptable disturbance rejection performance, lead compensation is needed to provide additional phase around crossover due to a lack of angular rate damping in the bare-airframe dynamics. 3. Excellent validation between the analysis model and flight data was seen in closed/broken-loop frequency response overlays as well as in the comparison of the 3·RMS attitude/position tracking error in turbulence. This reulst highlights the importance of accurate bare-airframe and turbulence models for use in the
performance-based design process described in this paper. When an accurate turbulence model is not available, values of typical attitude and position hold metrics (e.g., disturbance rejection bandwidth and peak) were provided as a guideline. Typical flight control and flying qualities metrics were observed to be roughly an order of magnitude greater than those for manned-sized aircraft (e.g., UH-60). 4. The critical frequency range for disturbance rejection performance due to Control Equivalent Turbulence Input (CETI) turbulence is 0.1 - 5 rad/sec for the IRIS+ quadrotor. To maximize disturbance attenuation within this frequency range, an integrator-toproportional gain ratio of ≈ 3/5 of the crossover frequency ωc is suggested. 5. Incorporating performance-based disturbance rejection (PBDR) requirements directly into the flight control design process allowed for the development of a position hold controller for the IRIS+ quadrotor with significantly improved disturbance rejection characteristics over the stock control system. The quadrotor was able to hold its position to within 3.5 inches with the PBDR design, a factor of 13.5 improvement over the stock position hold controller. ACKNOWLEDGMENTS The authors would like to thank Mark J.S. Lopez, Eric L. Tobias, and Joseph A. Wagster IV for serving as safety observers, ground control station managers, and test leads during the execution of the outdoor flight experiments. In addition, the authors would like to thank Rhys M. Lehmann from the Defence Science and Technology Group in Melbourne, Australia for his intellectual and hands-on contributions during the initial indoor flight testing. REFERENCES 1 Hoffmann,
G. M., Waslander, S. L., and Tomlin, C. J., “Quadrotor Helicopter Trajectory Tracking Control,” presented at the AIAA Guidance, Navigation, and Control Conference and Exhibit, Honolulu, HI, 2008. 2 Sahul, M. P. V., Chander, N. V., and Kurian, T., “A Novel
Method on Disturbance Rejection PID Controller for Quadcopter Based on Optimization Algorithm,” presented at the Third Internation Conference on Advances in Control and Optimization of Dynamical Systems, Kanpur, India, 2014. 3 Waslander,
S. L. and Wang, C., “Wind Disturbance Estimation and Rejection for Quadrotor Position Control,” presented at the AIAA Information Control, Aerospace Conference, Seattle, WA, 2009. 4 Horn,
J. F., Sparbanie, S., Cooper, J., and Schierman, J., “Adaptive Gust Alleviation for a Tilt-Rotor UAV operating
in Turbulent Airwakes,” presented at the AIAA Guidance, Navigation, and Control Conference and Exhibit, Honolulu, HI, 2008. 5 Tischler,
M. B., Advances in Aircraft Flight Control, Taylor and Francis, 1996. 6 Lee,
D. and Horn, J. F., “Optimization of a Helicopter Stability Augmentation System for Operation in a Ship Airwake,” presented at the American Helicopter Society 61st Annual Forum, Grapevine, TX, 2005. 7 Mansur,
M. H. and Tischler, M. B., “Flight Test Comparison of Alternate Strategies for Multi-Loop Control Law Optimization,” presented at the American Helicopter Society 69th Annual Forum, Phoenix, AZ, 2013. 8 Tischler, M. B., Berger, T., Ivler, C. M., Mansur, H., Mo-
hammadreza, Cheung, K. K., and Soong, J. Y., Practical Methods for Aircraft and Rotorcraft Flight Control Design: An Optimization Based Approach, AIAA, 2017. 9 Anon., “Flying Qualities of Piloted Aircraft,” MIL-STD-
1797B, Department of Defense Interface Standard, 2006. 10 Berger,
T., Ivler, C. M., Berrios, M. G., and Tischler, M. B., “Disturbance Rejection Handling Qualities Criteria for Rotorcraft,” presented at the American Helicopter Society 72nd Annual Forum, West Palm Beach, FL, 2016. 11 Tischler,
M. B. and Remple, R. K., Aircraft and Rotorcraft System Identification: Engineering Methods and Flight Test Examples Second Edition, AIAA, 2012. 12 Juhasz,
O., Lopez, M. J., Berrios, M. G., Berger, T., and Tischler, M. B., “Turbulence Modeling of a Small Quadrotor UAS Using System Identification from Flight Data,” presented at the Seventh AHS Technical Meeting on VTOL Unmanned Aircraft Systems, Mesa, AZ, 2017. 13 Cheung,
K. K. and et al., “An Overview of the U.S. Army Aviation Development Directorate Quadrotor Guidance, Navigation, and Control Project,” presented at the 73rd American Helicopter Society Annual Forum, Fort Worth, TX, 2017. 14 Lusardi, J. A., von Gruenhagen, W., and Seher-Weiss, S., “Parametric Turbulence Modelling for Rotorcraft Applications, Approach, Flight Tests and Verification,” presented at the Rotorcraft Handling Qualities Conference, University of Liverpool, UK, 2008. 15 Mansur, M. H., Lusardi, J. A., Tischler, M. B., and Berger, T., “Achieving the Best Compromise between Stability Margins and Disturbance Rejection Performance,” presented at the American Helicopter Society 65th Annual Forum, Grapevine, TX, 2009.
16 Mansur, M. H., Lusardi, J. A., Tischler, M. B., and Berger, T., “Achieving the Best Compromise between Stability Margins and Disturbnace Rejection Performance,” presented at the American Helicopter Society 65th Annual Forum, Grapevine, TX, 2009. 17 Skogestad,
S. and Postlethwaite, I., Multivariable Feedback Control: Analysis and Design, John Wiley ans Sons, Ltd, 2005. 18 Astr¨ ˚ om,
K. J. and Murray, R. M., Feedback Systems: An Introduction for Scientists and Engineers, Princeton University Press, 2008. 19 Hayes,
P. M., Grill, I., and Horn, J., “Gust Rejection Using Active Trailing Edge Flaps,” presented at the American Helicopter Society 68th Annual Forum, Fort Worth, Texas, 2012.