Fast and accurate pointing is a prerequisite for efficient use of ... The proliferation of laptop computers has, however, brought touchpads into use, also among ...
International Journal of Human-Computer Interaction, vol. 26, no. 7 (2010), pp. 703-734 Preprint version
How Age Affects Pointing with Mouse and Touchpad: A Comparison of Young, Adult, and Elderly Users Morten Hertzum Computer Science, Roskilde University, Roskilde, Denmark Kasper Hornbæk Computer Science, University of Copenhagen, Copenhagen, Denmark
Abstract. Effects of age on pointing performance have become increasingly important as computers have become extensively used by still larger parts of the population. This study empirically investigates young (1214 years), adult (25-33 years), and elderly (61-69 years) participants’ performance when pointing with mouse and touchpad. We aim to provide an integrated analysis of (a) how these three age groups differ in pointing performance, (b) how these differences are affected by the two pointing devices, and (c) how the submovement structure of cursor trajectories may explain performance differences. Results show that adult participants perform better than both young and elderly participants in that adult participants make fewer errors than young participants and complete trials quicker than elderly participants. Moreover, young participants are quicker than elderly participants, who make neither more nor less errors than young and adult participants. All three age groups were slower and made more errors with the touchpad than the mouse, but the touchpad slowed down elderly participants more than young participants, who in turn were slowed down more than adult participants. While adult participants made more efficient submovements than elderly participants, young participants had an intermediate position in that they were similar to adult participants for some submovement measures and similar to elderly participants for others. Keywords: pointing performance, age effects, submovement analysis, cursor trajectories, pointing devices, movement direction, Fitts’s law, kinematics
1
Introduction
Fast and accurate pointing is a prerequisite for efficient use of direct-manipulation interfaces and, thus, important to users’ overall task performance and subjective experience of systems. However, a host of interacting factors complicates design decisions and leads to substantial performance differences across pointing devices (e.g., Epps, 1986) and input techniques (e.g., Worden, Walker, Bharat, & Hudson, 1997). One of the factors prominently affecting pointing performance is user age. Understanding the effects of age has become increasingly important to consider as computers have become extensively used by still larger parts of the population, including both children (Hourcade, 2006) and elderly people (Nichols, Rogers, & Fisk, 2006). The aim of this study is to empirically investigate (a) how age group (young, adult, elderly) affects pointing performance, (b) how these age effects interact with pointing device (mouse, touchpad), and (c) how the submovement structure of cursor trajectories may help explain performance differences. While age has recently been the subject of considerable research on pointing performance most of this research has focused on either elderly users (e.g., Ketcham, Seidler, van Gemmert, & Stelmach, 2002; Smith, Sharit, & Czaja, 1999; Walker, Philbin, & Fisk, 1997) or children (e.g., Donker & Reitsma, 2007; Hourcade, Bederson, Druin, & Guimbretière, 2004; Lambert & Bard, 2005). By including young, adult, and elderly users, this study provides for direct comparison of young and elderly users and for more precisely assessing the biases introduced by basing design on adult users only – the predominant user group in studies of pointing devices and input techniques. Furthermore, previous research on age effects has hardly considered pointing devices other than the mouse. The proliferation of laptop computers has, however, brought touchpads into use, also among young and elderly people. Finally, performance measures such as error rates and trial completion times provide an external view on pointing movements, and we therefore also analyse cursor trajectories with respect to their phases and
1
submovement structure. Movement phases and submovement structure have been particularly useful in characterizing the pointing performance of elderly and disabled people and appear to reveal reasons for their lower performance compared to able-bodied adults (Hwang, Keates, Langdon, & Clarkson, 2005; Ketcham et al., 2002; Walker et al., 1997). Related to cursor trajectories, we analyse whether performance is differentially affected by the direction of movement, in addition to the usual task characteristics of distance to target and target size. The direction of movement has not previously been studied in relation to age but has been found to affect adults’ pointing performance (Whisenand & Emurian, 1996). In the next section we review previous work on age effects in relation to pointing. Section 3 describes the methodology of our experiment, and Section 4 gives the results of the data analysis. In Section 5 we discuss the results, their implications for understanding pointing performance, and how they may inform the design of input techniques that facilitate a variety of users in achieving high speed in their movement toward targets combined with high precision in target acquisition.
2
Background and related work
Pointing with a mouse or a touchpad involves continuous cursor movement produced by continuous finger, hand, and/or arm movement. Such pointing movements are typically understood as consisting of a large and fast submovement to get close to the target followed by one or several slower and more precise submovements to position the cursor over the target (Meyer, Abrams, Kornblum, Wright, & Smith, 1988). While the initial submovement is governed by the distance to the target (D), the subsequent submovements are governed by the width of the target (W). Fitts (1954) showed that the time needed to perform a pointing movement could be expressed in terms of these two variables: D + 1) MT = a + b × log2( W
(1)
where a and b are empirical constants determined by linear regression. The logarithmic term characterizes the difficulty of the pointing task and is known as the index of difficulty (ID). The constants a and b depend on the pointing device and have been used extensively in comparisons of such devices (Guiard & Beaudouin-Lafon, 2004; MacKenzie, 1992). For a specified pointing device, 1/b gives its index of performance (MacKenzie, 1992) or throughput (Zhai, 2004), with higher values of 1/b indicating more efficient devices. The interpretation of a is more contested (Soukoreff & MacKenzie, 2004). One interpretation is that it constitutes reaction or mental-preparation time. A substantial literature discusses how age affects pointing performance and documents that older adults experience a performance decline on a variety of pointing tasks. The performance decline resulting from ageing includes longer movement times (Chaparro, Bohan, Fernandez, Choi, & Kattel, 1999; Seidler & Stelmach, 1996), larger movement variability (Ketcham & Stelmach, 2001), and more errors (Smith et al., 1999). The reason for these differences may be increased reaction time and decreased muscle strength (Welford, 1977). Whereas increasing the ID of tasks impairs performance for all users, older adults’ performance suffers more with high ID values (Ketcham et al., 2002). Several studies find differences in strategy between adults and older adults, where older adults appear to emphasize accuracy over speed (Seidler & Stelmach, 1996). The literature also reports performance differences among adults, younger adults, and children (e.g., Donker & Reitsma, 2007; Hourcade et al., 2004). Hourcade et al. (2004) reviewed the literature on performance differences between children and adults, highlighting a number of differences in performance. For instance, children and young adults appear to process information slower than adults, affecting their reaction time and the speed at which they move. Hourcade et al. (2004) also presented empirical data that showed how children aged between 4 and 5 made more errors, had more target re-entries, and used more time on pointing tasks compared to young adults. The literature rarely explores whether effects of age on pointing performance differ across pointing devices. Many studies investigate performance with only one pointing device (e.g., Donker & Reitsma 2007; Walker et al. 1997). Among the exceptions, Scaife and Bond (1991) compared the performance of 5 to 10 year old children’s performance with touchscreen, mouse, joystick, and keyboard. They found significant interactions between age and device so that as age increased from 5 through 10 years greater improvements were found with the mouse and the joystick than with the touchscreen. Chaparro et al. (1999) compared the performance of young adults (mean age 32) and older adults (mean age 70) when using a mouse and a trackball. From performance measures and physiological measures of muscle activity, Chaparro et al. argued that the mouse may be a poorer pointing device for older adults compared to the trackball. While speed and accuracy indicate the net result of a pointing task, and illustrate age-related performance differences, these measures provide no information on movement during a task. It has been suggested that such information could help explain why a certain speed and accuracy was obtained and help describe differences
2
between pointing devices. MacKenzie, Kauppinen, and Silfverberg (2001), for example, argued that “analyses tend to focus on gross measures such as movement time and error rates. These measures adequately establish ‘that there is a difference’, but their power in eliciting ‘why there is a difference’ is limited”. Several models have related the micro structure of movements to speed and accuracy measures (for reviews, see Elliott, Helsen, & Chua, 2001; Meyer et al., 1988;). Crossman and Goodeve (1983), for instance, described pointing as a series of iterative corrections. The idea is that movement trajectories consist of a series of ballistic submovements based on feedback from the previous submovement; these submovements were assumed to be similar in duration and have errors proportional to the distance to the target. Meyer et al. (1988) proposed the optimized submovement model, which states that submovements are optimized so as to minimize total movement time while maintaining high accuracy despite the variability owing to neuromotor noise. Among other things, the optimized submovement model accounts for submovements’ endpoints and the relative frequency of secondary submovements. These models and related efforts help understand and predict the relation between speed, accuracy, and cursor trajectory. Phillips and Triggs (2001) studied users of computer mice and identified the accelerative and decelerative phases of pointing movement. The decelerative phase, that is the phase from peak velocity to maximum displacement of the cursor from its starting position, lasted about 70% of the duration of the pointing movement. From this observation Phillips and Triggs argued that improvements in input technologies should aim at facilitating the final phase of target acquisition (i.e., homing in on the target). They also showed that smaller targets required more submovements than larger targets, as did Dillen, Phillips, and Meehan (2005). Hwang et al. (2005) used a different definition of submovements but found that able-bodied users mostly made fast movements when far away from the target; that is, as one of their first submovements. Movements in different directions may differ in submovement structure. Dillen et al. (2005) found that for right-handed touchpad users upper-rightward movements required fewer submovements than upper-leftward and vertical movements. Also, upper-rightward movements were completed more quickly and upper-leftward movements were less accurate. For right-handed mouse users, diagonal movements have been found to be slower than horizontal and vertical movements (Phillips & Triggs, 2001; Whisenand & Emurian, 1996). This shows differences across pointing devices, probably due to biomechanical differences that become important because a touchpad involves more finger movement compared to a mouse, which involves more wrist movement. A joystick involves yet another set of biomechanics, and Smyrnis, Evdokimidis, Constantinidis, and Kastrinakis (2000) found that movement direction did not affect the duration of pointing movements performed with a joystick. Age effects on the direction of movement have to the best of our knowledge not been investigated. The study of cursor trajectories may be put to at least two uses, both of which are explored in this paper. The submovement structure may be used to explain differences in performance across pointing devices. Mithal and Douglas (1996) showed how cursor trajectories varied dependent on whether participants used a mouse or an isometric joystick. The cursor trajectories for users of the isometric joystick were affected by hand tremor to a larger extent than the trajectories of mouse users. Dillen et al. (2005) found that participants performed more submovements with a touchpad compared to a mouse and argued that the excess submovements seemed mostly related to coarse movement to get close to the target (i.e., clutching), rather than to the final acquisition of the target. Another use of cursor trajectories relevant to this paper is their use for explaining age-related differences in movement. Studies of cursor trajectories have shown, for instance, that older adults make more submovements (Walker et al., 1997) and have lower peak velocity (Ketcham et al., 2002), longer phases of deceleration (Pohl, Winstein, & Fisher, 1996), and longer cursor trajectories (Smith et al., 1999). Hourcade et al. (2004) showed that children between 4 and 5 years of age made more submovements than adults and that those submovements were less accurate. As a more extensive example, Walker et al. (1997) investigated possible explanations for the observations that older adults were about 65% slower than younger adults in pointing tasks and that older adults spent longer time to home in on targets. They used both accuracy constrained tasks and tasks consisting only of a ballistic movement, and they varied penalties for errors. This enabled them to identify four factors that differed between young and older adults: noise-to-force ratio, the use of visual feedback, strategy in completing tasks, and ability to produce force. Walker et al. showed that the relation between peak acceleration (force) and the variability of endpoint distribution (noise) in a ballistic movement differs with age: young adults have higher peak acceleration and lower variation in endpoint compared to older adults. Older adults spend more time than young adults from their last submovement to releasing the mouse button, suggesting that perceptual feedback may be less efficiently processed. Walker et al.’s evidence for strategy differences between age groups comes from observing the effect of a point system to encourage quick and accurate performance. While young adults adopted an optimizing strategy by adjusting their movements to earn many points, older adults adopted a more conservative strategy of not adjusting their movements to the point system. Finally,
3
differences in maximum velocity (force) between age groups were seen. Interpreting this difference was difficult, however, because there was no difference between the force produced by older adults in the ballistic task and the force produced by the younger adults in the accuracy constrained task. In sum, while some attempts have been made to explain age-related differences in pointing performance by analysing cursor trajectories, we know of no integrated discussion of young, adult, and elderly users. Further, we know of no study that uses analysis of submovements to investigate the interaction between age and different pointing devices. These limitations form the point of departure for the experiment described next.
3
Experimental Method
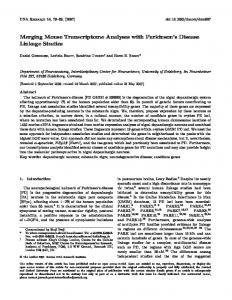
To empirically investigate age effects during pointing movements, we conducted an experiment with participants in three age groups. The experiment employed a five-factor, mixed factorial design. The betweensubjects variable was participant age. The within-subjects variables were distance to target, target size, movement direction, and pointing device. 3.1 Participants The 36 experimental participants formed three age groups of 12 participants: young, ranging from 12 to 14 years of age with an average of 12.83 (SD = 0.94); adult, ranging from 25 to 33 years of age with an average of 28.75 (SD = 2.56), and elderly, ranging from 61 to 69 years of age with an average of 62.67 (SD = 2.35). Note that the young participants were adolescents, not young adults. The adult and elderly groups fell within commonly used age intervals often labelled younger adults and older adults (roughly 20-34 and 60-79 years, respectively; Nichols, Rogers, & Fisk, 2003). Each age group consisted of six male and six female participants. All participants were right handed and had normal or corrected-to-normal vision. None of the participants were information technology (IT) students, none had an IT education, and none worked as IT professionals. One participant (in the elderly group) had previously worked as an IT professional but was now retired. All participants were residents of Denmark. Table 1 summarizes participants’ experience using computers. There were no differences between age groups in participants’ ratings of their experience using mouse and touchpad, F(2, 34) = 1.53 and 2.12, respectively (both ps > 0.1). All participants had experience using both pointing devices. Furthermore, all participants had used computers for years and spent hours a week using computers, particularly for online activities. We found significant differences between age groups for years of computer use, F(2, 34) = 9.63, p < 0.01, years of Internet use, F(2, 34) = 21.74, p < 0.001, and hours of computer use a week, F(2, 34) = 4.26, p < 0.05, but not for hours online a week, F(2, 34) = 2.03, p > 0.1. Linear contrasts showed that young participants had used computers and the Internet for fewer years than adult and elderly participants. This appears to be a rather direct consequence of the young participants’ lower age. Linear contrasts also showed that adult participants used computers for more hours a week than elderly participants. In addition to experience, people’s feelings toward computers affect their performance; specifically, computer anxiety has been found to make many elderly people refrain from the use of computers (Nichols et al., 2006). Table 2 summarizes participants’ general feelings toward computers. An overall multivariate analysis of the six questions in the table shows no difference between age groups, Wilks’s λ = 0.61, F(12, 56) = 1.33, p > 0.2. 3.2 Tasks The experimental tasks are a modification of the multi-directional tapping test (ISO 9241, 2000), and they are similar to the tasks used by Hwang et al. (2005) and Phillips and Triggs (2001) in previous studies of cursor trajectories during pointing movements. The tasks also resemble the tasks used in previous studies of directional gestures (e.g., Kurtenbach, Sellen, & Buxton, 1993; Moyle & Cockburn, 2005). Eight objects are arranged in a circle around a centre object, and participants are required to alternate between selecting the centre object and one of the eight surrounding objects (see Figure 1). The target that the participant should select next is highlighted; that is, it is red while the other objects are light blue. The first target in every task is the centre object. Its selection marks the start of the task. Selection of one of the eight objects around the centre object always occurs after selecting the centre object and thus entails a movement in one of eight specified directions. Selection of the centre object after having selected one of the eight objects surrounding it entails a movement in the opposite direction. While the selections of the centre object can be predicted from the alternating structure of the task, participants cannot predict which of the eight surrounding objects will be the next target because the order in which they are to be selected is randomized. Our reasons for choosing this task are threefold. First, we intend to study tasks that are demanding in motor and visual abilities but make low demands for mental activity, and the selected task appears to be representative of
4
such tasks. Second, the mix of predictable and unpredictable target locations resembles real-world conditions in which object locations are sometimes known and sometimes not. Third, the task is a previously used means of evaluating pointing devices, and in studies with a focus on cursor trajectories it is more widely used than the multi-directional tapping test (ISO 9241, 2000). In addition, the task can be systematically varied on three dimensions expected to influence performance: Distance to target (three levels). The distance from one target to the next is the radius of the circle formed by the eight objects. The radius of the circle was either 70 pixels (small), 175 pixels (medium), or 350 pixels (large). The large circle occupied the full height of the screen. According to Fitts’s law, target selection time increases with increasing distance to targets. Target size (two levels). Small targets had a diameter of 6 pixels, and large targets had a diameter of 21 pixels. According to Fitts’s law, target selection time increases with decreasing target size. Movement direction (eight levels). The objects surrounding the centre object were equally spaced, at 45-degree intervals. Using compass terminology the eight directions were: N, NE, E, SE, S, SW, W, and NW. According to Fitts’s law target selection time is unaffected by movement direction, but previous studies show that pointing movements are affected by the direction of movement (Dillen et al., 2005; Phillips & Triggs, 2001; Whisenand & Emurian, 1996). The tasks do not include distracter objects between the initial cursor position and the target because the operation of mouse and touchpad appears to be insensitive to the presence of distracters (e.g., Hertzum & Hornbæk, 2007). 3.3 Design The experiment employed a mixed factorial design where participants were divided into age groups and all participants used both mouse and touchpad to complete two blocks of six tasks. Half of the participants in each age group used the mouse for the first half of the session and the touchpad for the second half of the session. The other half of the participants used the touchpad first, then the mouse. In each age group the order of the six tasks in a block was determined using one balanced Latin square for the six participants starting with the mouse and another for the six participants starting with the touchpad. A new pair of Latin squares was used for each block. Each task consisted of 32 trials and covered one level of target size, one level of distance to target, and all eight levels of movement direction. The trials of a task alternated between selecting the centre target and one of the eight targets surrounding the centre target. Each of the surrounding targets was selected twice, the order determined at random. To summarize, 36 participants, distributed onto 3 age groups (young, adult, elderly) performed: 2 pointing devices (mouse, touchpad) × 2 blocks × 3 distances to target (70, 175, and 350 pixels) × 2 target sizes (6 and 21 pixels) × 8 movement directions (N, NE, E, SE, S, SW, W, NW) × 4 repetitions = 768 trials per participant. 3.4 Procedure The experiment was administered individually for each participant. After a brief presentation of the experiment, participants filled out a background questionnaire similar to the pre-session questionnaire used by Ceaparu, Lazar, Bessiere, Robinson, and Shneiderman (2004), see Tables 1 and 2 for the questions in the questionnaire. Next, participants tried the experimental software on some sample tasks. Participants trained for an average of three minutes, during which they made the same number of object selections with the mouse and the touchpad. To support the use of the touchpad participants were offered a hand rest, which 19 of them used. Participants were instructed to work as quickly as possible, while maintaining high accuracy. They were also instructed to use only their right hand for performing the tasks. Participants first completed two blocks of six tasks with one pointing device. For the trials in a task the next target appeared as soon as the previous target had been correctly selected. Participants could not proceed until the correct target had been selected. After each task participants could relax for a moment before they performed the next task. Upon completing the two blocks for a pointing device, participants filled out a
5
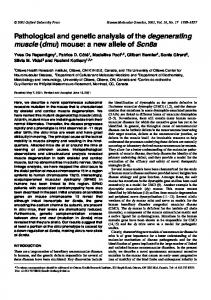
questionnaire about their satisfaction with the pointing device. Then, participants completed two similar blocks of six tasks with the pointing device not yet used. Finally, after performing with both pointing devices, participants indicated which of the two they preferred. The experimental sessions were conducted on a 1.86 GHz HP laptop with a mouse connected through a USB port, a built-in 68mm × 39mm Synaptics touchpad, and a 15-inch screen with a resolution of 1024×768 pixels. The mouse was an optical mouse with two buttons and a wheel. Only the left button was used during the experiment. On the touchpad, selections could be made by tapping the surface of the touchpad or clicking the leftmost of the two buttons below the touchpad. The control:display gain was set at the middle value in Windows XP. A test application presented the tasks to participants and logged their input. In addition to logging object selections (clicks), the cursor position was logged every 15.6 ms. The experimental sessions lasted an average of 44 minutes. 3.5 Dependent measures We measured error rate, trial completion time, submovements, subjective satisfaction, and preference. Error rate was measured as the percentage of trials for which participants missed a target by clicking one or several times in an empty part of the screen or on a wrong object. Trial completion time was measured from the selection of one target to the selection of the next target. Trial completion time was further divided into reaction time, movement time, and selection time. Reaction time was defined as the phase from the start of a trial to the cursor had moved more than one pixel away from its initial position. Selection time was defined as the phase from the cursor entered the target for the last time until the end of the trial. Movement time was the phase between reaction time and selection time. Submovements were defined on the basis of the speed and acceleration profiles of cursor movements (for an illustration, see Figure 2). Using the NER and NERD digital filters (Kaiser & Reed, 1977, 1978), we first smoothed the logged cursor positions and then differentiated them twice. This was done to reduce effects of friction and hand tremor and to get the speed and acceleration of the cursor at each point in time. We used filters with a 0-7 Hz pass band, a 7-9 Hz tolerance, and a stop band that ranged from 9 Hz upward. These filter settings are similar to those used by Ketcham et al. (2002) and the final filter used by Meyer et al. (1988). As in Walker et al. (1997), the initial submovement of each trial was considered to begin when cursor speed exceeded 75 pixels/second for a period of at least 15ms, and submovements were considered to end when (1) speed reached zero or (2) acceleration changed signs from negative to positive indicating a relative minimum in speed. For the second criterion to mark the end of a submovement we followed Hwang et al. (2005) by further requiring that the minimum in speed at the end of the submovement was less than 75% of the peak speed within the submovement. This ensured an actual slowdown in speed prior to the following speedup. From Hwang et al. (2005) we also inherited the final criterion that a submovement had to be at least 100ms long. Submovements following the initial submovement were considered to start immediately after the end of the prior submovement. For each submovement we recorded its duration, endpoint, maximum speed, time of maximum speed, and the length of the cursor trajectory Subjective satisfaction was measured by 11 questions adapted from ISO 9241 (2000) and Douglas, Kirkpatrick, and MacKenzie (1999). Finally, preference was measured as participants’ rank-ordering of the two pointing devices.
4
Results
Below error rates, trial completion times, and submovements are analysed using analysis of variance (ANOVA) with participant age as a between-subjects variable and pointing device, distance to target, target size, and movement direction as within-subjects variables. Subjective satisfaction is analysed using a multivariate ANOVA of the full set of satisfaction questions followed by univariate ANOVAs of individual questions. Finally, the preference data are analysed with a Kruskal-Wallis test. 4.1 Learning effects Before analysing learning effects, we removed 406 (1.5%) outlier trials, which were more than three interquartile ranges above the upper quartile in trial completion time. In the remaining 27242 trials we found no difference in error rate between the first and the second block, Fs(1, 35) = 0.03 and 1.09 (both ps > 0.3) for mouse and touchpad, respectively. For the 24497 non-outlier, non-error trials, there were significant differences in trial completion times between blocks for mouse, F(1, 35) = 11.29, p < 0.01, and touchpad, F(1, 35) = 6.79, p < 0.05. With both pointing devices participants were faster during the second block, see Figure 3. To avoid
6
that learning effects confound our results we use only the data from the second block in the remainder of our analysis. 4.2 Error rates Figure 4 shows error rates for the 13650 non-outlier trials in the second block. Before conducting the statistical analysis, the average accuracy of trials within a task was arcsine transformed because percentage values cannot be assumed normally distributed (Fleiss, 1981). There was a significant difference in error rates for age groups, F(2, 34) = 4.52, p < 0.05. Bonferroni-adjusted post-hoc tests showed that young participants (M = 12.8%, SD = 0.11) had higher error rates than adult participants (M = 7.6%, SD = 0.08). The elderly participants’ error rates (M = 8.7%, SD = 0.10) were closest to those of adult participants. We found significant differences in error rates for pointing device, F(1, 35) = 7.92, p < 0.01, and target size, F(1, 35) = 125.91, p < 0.001. Error rates were lower for the mouse (M = 8.2%, SD = 0.09) than the touchpad (M = 11.1%, SD = 0.10) and lower for large targets (M = 5.6%, SD = 0.07) than small targets (M = 13.8%, SD = 0.10). We also found significant interactions between pointing device and target size, F(1, 35) = 18.68, p < 0.001, and between pointing device, target size, and age group, F(2, 34) = 8.47, p < 0.01. These interactions indicate that the increase in error rates from large to small targets was smaller for the touchpad than the mouse, due to the elderly participants. For elderly participants the increase in error rates from large to small targets was 1.8 and 8.9 percentage points for the touchpad and mouse, respectively. For young and adult participants these differences were in the range 9.4 to 10.0 percentage points for both pointing devices. There was no difference in error rates for distance to target, F(2, 34) = 2.21, p > 0.1, and no interaction between distance to target and age group, F(4, 32) = 1.48, p > 0.2. For movement direction we found a significant difference in error rates between horizontal-and-vertical (N, E, S, W) and diagonal (NE, SE, SW, NW) movements, F(1, 35) = 4.57, p < 0.05. Surprisingly, error rates were higher for horizontal-and-vertical (M = 10.2%, SD = 0.07) than diagonal (M = 9.1%, SD = 0.07) movements. We found no difference in error rates between horizontal (E, W) and vertical (N, S) movements, F(1, 35) = 0.41, p > 0.5 (N = 6813). Finally, directions of movement interacted with neither age group nor pointing device. 4.3 Trial completion times Figure 5 shows trial completion times for the 12338 non-outlier, non-error trials in the second block. There was a significant difference in trial completion time for age groups, F(2, 34) = 21.21, p < 0.001. Bonferroniadjusted post-hoc tests showed that elderly participants (M = 2175ms, SD = 837) were significantly slower than young (M = 1614ms, SD = 699) and adult (M = 1587ms, SD = 575) participants, while there was no difference between young and adult participants. We found a significant difference in trial completion time for pointing device, F(1, 35) = 297.29, p < 0.001. Participants were substantially faster using the mouse (M = 1311ms, SD = 440) than the touchpad (M = 2273ms, SD = 707). We also found a significant interaction between pointing device and age group, F(2, 34) = 3.51, p < 0.05, indicating that the increase in trial completion time when using the touchpad compared to the mouse was larger for elderly participants (1135ms increase) than for young participants (977ms increase) and even smaller for adult participants (774ms increase). There was a significant difference in trial completion time for target size, F(1, 35) = 773.86, p < 0.001. As expected, participants were faster with large targets (M = 1460ms, SD = 578) than small targets (M = 2124ms, SD = 776). There was also a significant interaction between target size and age group, F(2, 34) = 12.92, p < 0.001, indicating that the increase in trial completion time for small compared to large targets was bigger for elderly participants (836ms increase) than for young (580ms increase) and adult (576ms increase) participants. We found a significant difference in trial completion time for distance to target, F(2, 34) = 369.44, p < 0.001. Bonferroni-adjusted post-hoc tests showed significant differences between all three pairs of distance to targets. As expected, participants were fastest at the short distance (M = 1532ms, SD = 662) followed by the medium distance (M = 1792ms, SD = 723) and slowest at the long distance (M = 2051ms, SD = 802). We also found a significant interaction between distance to target and age group, F(4, 32) = 4.98, p < 0.01, indicating that the increase in trial completion time for increasing distances to target was bigger for elderly participants than for young and adult participants. The increase in trial completion time from small to large distances to target was 648ms for elderly participants compared to 453ms for young participants and 455ms for adult participants. There was a significant difference in trial completion time for movement direction, F(7, 29) = 2.41, p < 0.05. Bonferroni-adjusted post-hoc tests showed that this overall difference was not a result of significant differences between any pair of individual directions. Furthermore, trial completion times neither differed between horizontal-and-vertical (N, E, S, W) and diagonal (NE, SE, SW, NW) movements, F(1, 35) = 0.26, p > 0.6, nor
7
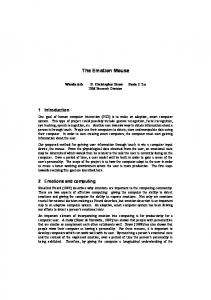
between horizontal (E, W) and vertical (N, S) movements, F(1, 35) = 2.23, p > 0.1 (N = 6122). There was however a significant interaction between movement direction and pointing device, F(7, 29) = 4.17, p < 0.001, indicating that the increase in trial completion time when using the touchpad compared to the mouse was smaller for movements in the N and S directions (889ms and 866ms increase, respectively) and greater for movements in the E and SE directions (1027ms and 986ms increase, respectively) compared to other directions (949ms mean increase). We found no interaction between movement direction and age group, F(14, 22) = 0.71, p > 0.7. 4.4 Reaction time, movement time, and selection time To analyse trial completion time further, we divided it into reaction time, movement time, and selection time, see Table 3. Averaged over all participants, trial completion time consisted of 13% reaction time, 51% movement time, and 35% selection time. For all three phases there were significant differences between pointing devices (reaction time: F[1, 35] = 366.45, p < 0.001; movement time: F[1, 35] = 57.67, p < 0.001; selection time: F[1, 35] = 248.04, p < 0.001) with the touchpad being consistently slower than the mouse. Similarly, we found significant differences between age groups for reaction time, F(2, 34) = 13.46, p < 0.001, movement time, F(2, 34) = 10.68, p < 0.001, and selection time, F(2, 34) = 23.54, p < 0.001. Bonferroniadjusted post-hoc tests showed that reaction time was significantly lower for young participants compared to adult (p < 0.05) and elderly (p < 0.001) participants. A significant interaction between age group and pointing device, F(2, 34) = 14.54, p < 0.001, indicated that the differences across age groups were due to the touchpad; for the mouse there was no difference in reaction time across age groups. Bonferroni-adjusted post-hoc tests showed that movement time was significantly longer for elderly participants compared to adult participants (p < 0.001) and that a similar difference between elderly and young participants approached significance (p = 0.06). A significant interaction between age group and pointing device, F(2, 34) = 4.09, p < 0.05, indicated that young participants had movement times similar to those of adult participants for the mouse but similar to those of elderly participants for the touchpad. Bonferroni-adjusted post-hoc tests showed that selection time was significantly longer for elderly participants compared to young and adult participants (both ps < 0.001). A significant interaction between age group and pointing device, F(2, 34) = 3.60, p < 0.05, indicated that the gap in selection time between elderly participants and the average of young and adult participants was larger for the touchpad (350ms longer) than the mouse (214ms longer). Target size significantly affected reaction time, movement time, and selection time, Fs(1, 35) = 154.87, 876.49, 46.79, respectively (all ps < 0.001). For movement time a significant interaction between target size and age group, F(2, 34) = 13.75, p < 0.001, indicated that elderly participants were slowed down more by small compared to large targets (81% slowdown) than young (69% slowdown) and adult (70% slowdown) participants. Distance to target significantly affected reaction time, movement time, and selection time, Fs(2, 34) = 39.98, 550.98, 8.66, respectively (all ps < 0.01). There were significant interactions between distance to target and age group for reaction time, F(4, 32) = 3.97, p < 0.01, and movement time, F(4, 32) = 7.70, p < 0.001, indicating that increasing distances to target increased young participants’ reaction times less and elderly participants’ movement times more, compared to the other groups of participant. For example, young participants’ reaction time was 10% longer for large compared to small target distances, whereas it was 26% and 22% longer for adult and elderly participants, respectively. Interestingly, movement direction significantly affected reaction time, F(7, 29) = 4.50, p < 0.01, and selection time, F(7, 29) = 3.06, p < 0.01, but not movement time, F(7, 29) = 0.82, p > 0.5. Bonferroni-adjusted post-hoc tests showed that reaction times were faster for horizontal (E, W) movements (M = 226ms) than movements in the SE and SS directions (M = 242ms), and that selection times were faster for vertical (N, S) movements (M = 619ms) and movements in the NW direction (M = 611ms) than for movements in the SE direction (M = 643ms). The magnitude of the effects was, however, small. We found no interactions between movement direction and age group, Fs(14, 22) = 1.16, 0.70, 0.79 for reaction time, movement time, and selection time, respectively (all ps > 0.3). 4.5 Modelling by Fitts’s law We used Fitts’s law to model the movement and selection time of the 12338 non-outlier, non-error trials in the second block. Following MacKenzie (1992) we determined the effective width of targets using the standard deviation of the endpoint coordinates. The regression lines were based on average times for each combination of IDe, pointing device, and age group. Figure 6 shows the resulting regression lines.
8
Overall, Fitts’s law predicted time well, with r2 values from 0.86 to 0.91. The equations were as follows: young, mouse: -25 + 224×ID; adult, mouse: 21 + 225×ID; elderly, mouse: -71 + 333×ID; young, touchpad: 428 + 293×ID; adult, touchpad: 233 + 285×ID; and elderly, touchpad: 249 + 419×ID. The regression lines for elderly participants were steeper than for young and adult participants. For elderly participants using the mouse, b in Fitts’s law was about 50% larger; when they used the touchpad, b was about 70% larger. Another noteworthy point about the regression results was that while the intercept was negligible for the mouse, it ranged from 233 to 428 ms for the touchpad. This may reflect the higher reaction and selection times for the touchpad, discussed in the previous section. 4.6 Submovements Submovements were analysed for the 12338 non-outlier, non-error trials in the second block. An overall multivariate analysis of the five submovement measures in Table 4 showed significant differences between age groups, Wilks’s λ = 0.31, F(10, 58) = 4.56, p < 0.001, and pointing devices, Wilks’s λ = 0.06, F(5, 29) = 86.70, p < 0.001, and a significant interaction between age group and pointing device, Wilks’s λ = 0.40, F(10, 58) = 3.35, p < 0.01. With the experiment-wide error thus protected we analysed the individual measures. For number of submovements, we found a significant difference between age groups, F(2, 34) = 16.04, p < 0.001. Bonferroni-adjusted post-hoc tests showed that elderly participants performed more submovements than young and adult participants. Unsurprisingly, more submovements were needed to reach targets with the touchpad than the mouse, F(1, 35) = 257.04, p < 0.001. We found no interaction between age group and pointing device, F(2, 34) = 2.67, p > 0.08. The number of submovements increased significantly with distance to target, F(2, 34) = 432.13, p < 0.001. The mean number of submovements was 5.43 (SD = 2.14), 6.42 (SD = 2.39), and 7.38 (SD = 2.62) for short, medium, and long target distances, respectively. A significant interaction between age group and distance to target, F(4, 32) = 3.30, p < 0.05, indicated that elderly participants contributed more to the increase than young and adult participants. We also found a significant effect of target size, F(1, 35) = 806.30, p < 0.001, with the mean number of submovements being 5.21 (SD = 0.97) for large targets and 7.50 (SD = 1.35) for small targets. For distance left to target at the end of the first submovement (in percent of total distance to target), there was a significant difference between age groups, F(2, 34) = 7.70, p < 0.01. Bonferroni-adjusted post-hoc tests showed that adult participants came closer to the target during their first submovement than elderly participants. Overall the distance left to the target did not differ between pointing devices, F(1, 35) = 1.31, p > 0.7. However, a significant interaction between age group and pointing device, F(2, 34) = 4.73, p < 0.05, indicated that while young participants performed similarly to adult participants with the mouse they performed similarly to elderly participants with the touchpad. Unsurprisingly, the distance left to the target after the first submovement was significantly longer for the long distance to target, F(2, 34) = 35.62, p < 0.001. The mean distance left was 44% (31 pixels), 43% (76 pixels), and 52% (182 pixels) for short, medium, and long target distances, respectively. Moreover, the distance left to the target after the first submovement increased significantly with decreasing target size, F(1, 35) = 12.61, p < 0.001. For maximum speed, the difference between age groups approached significance, F(2, 34) = 3.26, p = 0.051. Maximum speed was higher for the touchpad than the mouse, F(1, 35) = 29.32, p < 0.001. We found no interaction between age group and pointing device, F(2, 34) = 0.55, p > 0.5. For submovement during which maximum speed was reached, we found a significant difference between age groups, F(2, 34) = 12.78, p < 0.001, but no difference between pointing devices, F(1, 35) = 3.15, p > 0.08. Bonferroni-adjusted post-hoc tests showed that adult participants reached maximum speed during an earlier submovement than young and elderly participants. This effect was, however, moderated by a significant interaction between age group and pointing device, F(2, 34) = 9.84, p < 0.001, indicating that while young participants performed similarly to elderly participants with the touchpad they performed similarly to adult participants with the mouse. For duration from the start of the fastest submovement to maximum speed was reached, we found a significant difference between age groups, F(2, 34) = 11.84, p < 0.001. Bonferroni-adjusted post-hoc tests showed that young and adult participants accelerated the cursor to its maximum speed more quickly than elderly participants. Overall, participants took longer to accelerate the cursor to its maximum speed with the touchpad than the mouse, F(1, 35) = 14.22, p < 0.001. This effect was, however, moderated by a significant interaction between age group and pointing device, F(2, 34) = 8.14, p < 0.001, indicating that while young and adult participants accelerated more quickly with the mouse elderly participants took about the same time to reach maximum speed with mouse and touchpad.
9
4.7 Angle between cursor trajectory and direction to target For the 12338 non-outlier, non-error trials in the second block, we calculated the angle between the smoothed cursor trajectory and the direction to the target. Figure 7 shows the angle when the cursor had moved different percentages of the inter-target distance away from its position at the beginning of a trial. In 3350 trials participants overshot the target by at least 10% before returning and selecting it, but the figure is restricted to the initial part of cursor trajectories; that is, until the cursor had for the first time moved 100% of the intertarget distance away from the previous target (in the figure, the angle is therefore larger than zero at 100%). There was a significant difference between age groups, F(2, 34) = 3.32, p < 0.05, indicating that adult participants had smaller angles than elderly participants. We also found a significant difference between pointing devices, F(1, 35) = 115.93, p < 0.001, with larger angles for the mouse than the touchpad. Further, there was a significant effect of the percentage of distance moved, F(9, 27) = 866.34, p < 0.001. Using Helmert contrasts we found that at each level of distance the angle was higher than the average angle of later levels of distance (all ps < 0.001). A significant interaction between age group and percentage of distance moved, F(18, 18) = 3.10, p < 0.05, indicated that adult participants’ angles dropped more at the first levels of distance compared to young and elderly participants. For both pointing devices the direction of cursor movement differed considerably from the direction toward the target, see Table 5. As suggested by the large angles, the cursor trajectory was considerably longer than the distance to targets. The length of the cursor trajectory was on average 1.51 times (SD = 0.19) the distance to targets for the mouse and 1.65 times (SD = 0.24) for the touchpad. The difference between pointing devices was significant, F(1, 35) = 18.61, p < 0.001. We found no difference in trajectory length between age groups, F(2, 34) = 2.35, p > 0.1, and no interaction between age group and pointing device, F(2, 34) = 2.40, p > 0.1. 4.8 Subjective assessments and preference An overall multivariate analysis showed no difference between age groups in participants’ subjective assessments of the pointing devices, Wilks’s λ = 0.47, F(22, 46) = 0.97, p > 0.5, and no interaction between age group and pointing device, Wilks’s λ = 0.35, F(22, 46) = 1.43, p > 0.1. However, the multivariate analysis showed a significant overall difference between pointing devices, Wilks’s λ = 0.23, F(11, 23) = 7.09, p < 0.001. Univariate analyses of the individual questions showed that participants rated the mouse significantly more favourably than the touchpad on seven of the eleven questions, see Table 6. The preference ranking performed by participants after they had used both pointing devices showed no difference between age groups in participants’ ranking of the pointing devices, Kruskal-Wallis test χ2(2, N = 36) = 0.45, p > 0.7. A total of 31 participants preferred the mouse; 5 participants preferred the touchpad (2 young, 2 adult, and 1 elderly). The preference for the mouse was significant, Binomial test, p < 0.001.
5
Discussion
The participants in this study included young and elderly participants in addition to the adult participants (2533 years of age), which are overrepresented in studies of pointing. Many pointing techniques have been studied for adults only. The young participants (12-14 years of age) represented a group older than the children in many previous studies (e.g., Hourcade et al., 2004; Scaife & Bond, 1991; Strommen, Revelle, Medoff, & Razavi, 1996) but still clearly younger than adults. The young participants were experienced computer users and, according to Hourcade et al. (2004), at an age where they had almost reached maximum potential for quick and accurate pointing. The elderly participants (61-69 years of age) represented an age group that is a growing part of the population (Nichols et al., 2006). They too were experienced computer users and not yet at an age with excessive within-group variability in vision, motor performance, and the like. 5.1 Age effects Overall, young participants made more errors than adult participants and were faster than elderly participants. This suggests that over the next years the young participants will improve their accuracy without becoming slower. Dividing trial completion time into phases we found that young participants had shorter reaction times than both adult and elderly participants, because young participants reacted faster when using the touchpad and were affected less by distance to target. For movement-phase time, young participants performed similarly to adult participants when using the mouse but similarly to elderly participants when using the touchpad. Selection times were shorter for young than elderly participants. Thus, young participants reacted, moved, and selected quicker than elderly participants, except for movement phases performed with the touchpad. One reason for the similarity in young and elderly participants’ movement-phase times when using the touchpad may be that they performed a similar number of submovements before reaching maximum speed. Conversely, when using the mouse young participants reached maximum speed during an earlier submovement than elderly
10
participants, and had shorter movement-phase times. Contrary to some previous studies of children’s pointing performance (Badan, Hauert, & Mounoud, 2000; Donker & Reitsma, 2007; Lambert & Bard, 2005), the young participants in our study were no slower than adult participants, completed pointing movements in the same number of submovements, spent a similar amount of time in the selection phase, and had cursor trajectories of similar length. The most likely reason for these differences appears to be that our young participants were a few years older than the children participating in the previous studies. Overall, adult participants made fewer errors than young participants and performed faster than elderly participants. This indicates that the adult participants performed better than both young and elderly participants, but in distinctly different ways. Moreover, adult participants performed at least as well as young and elderly participants on all measures except reaction time. Reasons for the adult participants’ better performance appear to include that, compared to both young and elderly participants, they came closer to the target during their first submovement and performed fewer submovements before they reached maximum speed. Compared to elderly participants, adult participants also needed fewer submovements to complete pointing movements and accelerated the cursor more quickly during the submovement in which maximum speed was reached. These results generally accord with previous comparisons of the pointing performance of adult and elderly people (e.g., Ketcham et al., 2002; Smith et al., 1999; Walker et al., 1997) but, as discussed above, discord somewhat with previous studies of children’s pointing. As can be seen from our Fitts’s law models (Figure 6), young and adult participants’ trial completion times were affected similarly by changes in the index of difficulty of the tasks. Adult participants were, however, slowed down less by using the touchpad compared to the mouse. Overall, elderly participants were slower than young and adult participants but made neither more nor less errors. This accords with Seidler and Stelmach (1996), who suggest that with increasing age people accept a slowdown in pointing performance to maintain an unchanged level of accuracy. Indications of such a strategy were most clearly seen in the trials causing elderly participants most difficulty. For example, elderly participants were slowed down more by the touchpad and by small targets than young and adult participants, but at the same time elderly participants’ error rates when selecting small targets with the touchpad differed less from their other error rates, compared to how much error rates differed for the other groups of participant. In accordance with previous studies (Chaparro et al., 1999; Ketcham et al., 2002; Worden et al., 1997), elderly participants were consistently slowed down more by tasks with high indexes of difficulty than were other participants. Target size and distance to target contributed differently to this uneven slowdown. While smaller targets and longer distances both unevenly prolonged the movement phase, longer distances also unevenly prolonged elderly participants’ reaction phase. One reason for this could be visual processing time, suggesting that elderly participants may have taken longer than other participants to spot far away targets visually. Elderly participants’ longer selection phase, irrespective of the task’s index of difficulty, may be a further indication of increased visual processing time, in this case to verify that the cursor was over the target. 5.2 Device effects Across all three age groups participants were slower and made more errors with the touchpad compared to the mouse. The slower performance with the touchpad accords with previous studies by Epps (1986) and MacKenzie et al. (2001) but the higher error rates discord with MacKenzie et al. (2001), who found no difference in error rates; Epps (1986) did not report error rates. A likely reason for this disagreement is that error rates differ across age groups. While MacKenzie et al. (2001) do not report the age of their participants, they appear to be university students (p. 12) and thereby about the same age as our adult participants. For adult participants we find similar error rates for mouse and touchpad (see Figure 4); the overall difference in error rates becomes visible only when all three age groups are included in the analysis. This shows the limitations of generalizing from studies based on participants from one age group. With adults as the only group of participant, performance is likely to be overestimated and differences between pointing devices are likely to be underestimated. The age groups’ trial completion times were differentially affected by pointing device. Elderly participants were slowed down more by the touchpad than young participants, and young participants were, in turn, slowed down more than adult participants. These differences are unlikely to be a result of experience effects as there were no differences between age groups in participants’ ratings of their experience using mouse and touchpad. Rather, the touchpad appears to be more difficult to use quickly and accurately, and the young and elderly participants were affected more by this increase in difficulty than the adult participants were. Interestingly, the use of either mouse or touchpad in certain cases determined whether young participants performed as well as adult participants or similarly to elderly participants. Such shifts in the young participants’ performance were seen for time spent in the movement phase and for submovement during which maximum speed was reached. In both cases young participants performed similarly to elderly participants when using the more difficult touchpad, while the easier-to-use mouse enabled them to perform similarly to adult participants.
11
Notably, differences between mouse and touchpad were seen in all three phases of trial completion time. Reaction times were about four times longer when using the touchpad. This suggests that more mental preparations are required to perform touchpad movements. Further support for the large magnitude of the difference is provided by a study of touchpads (Dillen et al., 2005) that reports reaction times comparable to ours for the touchpad and a study of mice (Walker et al., 1997) that reports reaction times comparable to ours for the mouse. Movement-phase times with the touchpad were about 60% longer than with the mouse, which might be expected because fine-grained movement is more difficult with a touchpad and because clutching is more of an issue. With the settings used in the experiment, the full width of the touchpad corresponded to about 900 pixels, suggesting that clutching was often a result of suboptimal use of the touchpad, at least at small and medium distances to target. Selection times were about twice as long with the touchpad than the mouse. One reason for this might be increased time for verifying that the fine-grained movements have succeeded in positioning the cursor over the target. Another reason might be that selection with a mouse can be prepared during motion (e.g., by beginning to lift one’s finger), while it cannot with a touchpad. Overall, the main explanations for the slower performance of the touchpad compared to the mouse seem to be longer reaction and selection times, and a number of excess submovements. The higher maximum speed of the touchpad and its more straight line of movement toward the target are insufficient to compensate for these drawbacks. It should be noted that the experimental tasks did not involve switching between pointing device and keyboard. Such switching may be faster between touchpad and keyboard because they are closer than mouse and keyboard, possibly making the number of switches a factor in deciding whether mouse or touchpad is the faster pointing device. 5.3 Submovements and movement direction Our data on submovements showed many differences between pointing devices and between age groups. Use of the touchpad was associated with more submovements; elderly participants also engaged in more submovements than young and adult participants. In general, more submovements were strongly related to longer trial completion times (with a Pearson correlation of 0.90) and moderately related to error rates (with a point biserial correlation coefficient of 0.34). The analysis of submovements thus gives indications of likely mechanisms behind the differences in speed and accuracy. Across pointing devices, going from close to far targets increased the number of submovements by about two, and going from large to small targets also increased the number of submovements by about two. In a previous study, Dillen et al. (2005) aimed at identifying whether the number of submovements with a touchpad was related mostly to the first, distance-covering part of pointing movements or the last, homing-in part of the movements. They concluded that “accuracy was the lesser determinant of the number of submovements using the touchpad” (p. 233). Our data suggest a rather even balance between the two parts of pointing movements, though it should be taken into consideration that the span in ID values was slightly larger for the difference in distances to target than for the difference in target sizes. Thus, the larger number of submovements with the touchpad compared to the mouse appears to be about evenly distributed between a need for more clutching during distance-covering movement and more difficulty in making fine-grained movement to home in on targets. Adult participants moved the cursor in a more straight line toward the target than elderly participants, they came closer to the target during their first submovement than elderly participants, and they reached maximum speed during an earlier submovement than young and elderly participants. Young and adult participants made fewer submovements than elderly participants, and in the submovement during which maximum speed was reached young and adult participants also accelerated the cursor more quickly to its maximum speed than elderly participants did. These results indicate a more efficient submovement structure for adult participants. In accordance with Walker et al. (1997) but in discord with Ketcham et al. (2002), we found no difference between age groups in maximum cursor speed. This suggests that the age groups do not differ in their ability to produce force. Rather, the adult participants’ better performance appears to be a result of improved ability to administer the application of force. On a methodological note, we find that maximum speed was typically reached during the first or second submovement. Some studies (e.g., Ketcham et al., 2002) define the first submovement as the one during which maximum speed is reached and thereby disregard that users may perform a short, initial submovement before their main submovement or may even perform the distance-covering part of their movement as two more evenly sized submovements. The direction of a pointing movement affected both error rates and trial completion times. While this is consistent with previous studies, our specific finding that error rates were higher for horizontal and vertical than for diagonal movements is contrary to previous studies (Phillips & Triggs, 2001; Whisenand & Emurian,
12
1996), which find that when pointing with a mouse diagonal movements are more difficult (i.e., take longer) than horizontal and vertical movements. A likely explanation is that movement direction affects the mouse and touchpad differently. We specifically found that the slowdown when using the touchpad compared to the mouse was larger for movements in the E and SE directions. Movements in these directions may be more biomechanically demanding because the finger used for operating the touchpad moves toward the user’s (right) hand; this involves either considerable bending of the finger or movement of the hand. Additional effects of movement direction were found for reaction time and selection time. However, the magnitude of the effects of movement direction was generally small, and none of them affected age groups differentially. 5.4 Design implications This study first of all suggests that people of different age use pointing devices differently and thus could benefit from different interaction designs to support their pointing. For elderly users, the selection phase could be supported by techniques aimed at reducing excess submovements over the target (similar to, e.g., Worden et al., 1997) and by better visual indication of the object currently under the cursor. For young users, techniques aimed at enhancing accuracy appear most relevant. Touchpad performance seems likely to benefit much from interaction techniques that improve the final phase of homing in on the target (e.g., Grossman & Balakrishnan, 2005; Hertzum & Hornbæk, 2007). Another improvement that appears attainable would be to reduce selection time, which is about twice as long as for the mouse. Ideas similar to the slide-touch (Ren & Moriya, 2000), originally devised for pen-based interfaces, might work also for fingers operating touchpads. For the mouse, the most important design implication probably is that target prediction by extending the cursor movement in its current direction is inconsistent with our participants’ cursor trajectories (Figure 7). Assuming that the mouse proceeds in a relatively straight line toward the target will likely lead to frequently predicting a wrong target or it will involve that users must abandon their natural way of performing pointing movements in favour of movements intended specifically to exploit interaction techniques that make use of target prediction (e.g., Guiard, Blanch, & Beaudouin-Lafon, 2004). The submovement structure of participants’ cursor trajectories varies considerably across age groups and pointing devices. This suggests that algorithms for predicting movement endpoints (e.g., Lank, Cheng, & Ruiz, 2007; Murata, 1998) need to be tested with a more varied group of users and pointing devices because prediction algorithms often make use of the submovement structure. Some algorithms for target prediction are restricted to one-dimensional tasks (e.g., Lank et al., 2007; McGuffin & Balakrishnan, 2005). Given the magnitude of the angle between cursor trajectory and direction toward target in our data, extending target prediction to two-dimensional tasks seems an important challenge. The submovement structure can also be utilized to detect when users experience trouble and then make appropriate, dynamic adjustments of the behaviour of the pointing device. Dynamic adjustments appear necessary because users experience different problems depending on age, pointing device, and the characteristics of the pointing task. For example, multiple short submovements in the vicinity of an object likely indicate problems in the selection phase and could possibly be counteracted by temporarily changing the control:display gain or visually enlarging objects close to the cursor. Repeated instances of multiple long and fast submovements suggest clutching and could possibly be counteracted by a gradual and permanent change of the control:display gain to produce more cursor movement per unit of device movement. Long selection times after a user has for the last time entered a target may suggest a concern about inadvertently moving the cursor while performing the selection and could be counteracted by delaying or briefly restricting cursor movement when the cursor is stationary over a target and the user is initiating a selection operation. This appears especially relevant when selection is made by tapping a touchpad. Finally, the magnitude of the differences in submovement structure across age groups may in some settings be usable as a coarse-grained security mechanism. A marked change in submovement structure may, especially after a period without cursor movement, suggest that another person is using the computer and can possibly provide an unobtrusive technique for dynamic user verification.
6
Conclusion
Pointing movements are affected not only by task characteristics but also by user age and pointing device. Further, the task characteristics of importance are not restricted to distance to target and target size but also include the direction of movement. This study provides an integrated analysis of how user age and pointing device affect pointing movements and how the direction and submovement structure of cursor trajectories may help explain the differences. For age we find that: •
Adult participants perform at least as well as young and elderly participants on all measures except reaction time. Specifically, adult participants make fewer errors than young participants and complete pointing movements more quickly than elderly participants. The analysis of submovements suggests that
13
adult participants’ better performance is a result of an improved ability to administer the application of force, rather than of an ability to produce more force. •
Young participants are quicker than elderly participants, but in several aspects of their performance young participants have an intermediate position between adult and elderly participants. For certain measures, for example the duration of the movement phase, this intermediate position is strongly affected by the pointing device in that young participants perform similarly to elderly participants when using the touchpad, while the mouse enables them to perform similarly to adult participants.
•
Elderly participants are slower but no less accurate than young and adult participants. This appears to reflect a strategy of accepting somewhat slower performance to maintain high accuracy. Moreover, elderly participants are consistently slowed down more than other participants by longer distance to target and smaller target size.
Across age groups participants complete pointing movements more quickly and accurately with the mouse than the touchpad, but the touchpad also increases the differences between age groups. Compared to the mouse, the touchpad slows down elderly participants, and to some extent young participants, more than adult participants. The difficulty of using the touchpad includes prolonged preparation before movement is initiated, longer movement phases, and more time for the final verification and selection of targets. Also, the increase in number of submovements compared to the mouse is about evenly distributed between the distance-covering and the homing-in parts of movement. This makes it difficult to pinpoint one aspect of touchpad performance as a particularly relevant object for improvement, but it appears that much can be gained from improving the final phase of homing in on the target. For all three age groups and both pointing devices in this study there is a considerable angle between the actual cursor trajectory and the direct line toward the target, suggesting that two-dimensional target prediction may be a difficult task With more extensive use of computers by children and elderly people it becomes increasingly important to assess and improve the usability of pointing devices for a diversity of users. Larger displays and smaller, more closely spaced display objects will tend to increase age effects because elderly users will suffer more from the increase in their pointing tasks’ index of difficulty. For children even small differences in age may entail considerable performance differences. Finally, the existing literature on pointing performance tends to use only adult participants, possibly overestimating performance and underestimating differences between pointing devices.
Acknowledgements This study received financial support from the Danish Research Councils’ Program on IT research through its funding of the HIT project. Maria Ie Pedersen recruited the experimental participants and ran the experimental sessions. We are grateful to the 36 persons who agreed to participate in the experiment.
References Badan, M., Hauert, C.-A., and Mounoud, P. (2000). Sequential pointing in children and adults. Journal of Experimental Child Psychology, 75(1), 43-69. Ceaparu, I., Lazar, J., Bessiere, K., Robinson, J., and Shneiderman, B. (2004). Determining causes and severity of end-user frustration. International Journal of Human-Computer Interaction, 17(3), 333-356. Chaparro, A., Bohan, M., Fernandez, J., Choi, S.D., and Kattel, B. (1999). The impact of age on computer input device use: Psychophysical and physiological measures. International Journal of Industrial Ergonomics, 24(5), 503-513. Crossman, E.R.F.W., and Goodeve, P.J. (1983). Feedback control of hand-movement and Fitts’ Law. Quarterly Journal of Experimental Psychology, 35A(2), 251-278. Dillen, H., Phillips, J.G., and Meehan, J.W. (2005). Kinematic analysis of cursor trajectories controlled with a touchpad. International Journal of Human-Computer Interaction, 19(2), 223-239. Donker, A., and Reitsma, P. (2007). Aiming and clicking in young children’s use of the computer mouse. Computers in Human Behavior, 23(6), 2863-2874. Douglas, S.A., Kirkpatrick, A.E., and MacKenzie, I.S. (1999). Testing pointing device performance and user assessment with the ISO 9241, part 9 standard. In Proceedings of the CHI 99 Conference on Human Factors in Computing Systems (pp. 215-222). New York: ACM Press.
14
Elliott, D., Helsen, W.F., and Chua, R. (2001). A century later: Woodworth’s (1899) two-component model of goal-directed aiming. Psychological Bulletin, 127(3), 342-357. Epps, B.W. (1986). Comparison of six cursor control devices based on Fitts’ law models. In Proceedings of the Human Factors Society 30th Annual Meeting (pp. 327-331). Santa Monica, CA: Human Factors Society. Fitts, P.M. (1954). The information capacity of the human motor system in controlling the amplitude of movement. Journal of Experimental Psychology, 47, 381-391. Fleiss, J. (1981). Statistical Methods for Rates and Proportions. New York: Wiley. Grossman, T., and Balakrishnan, R. (2005). The bubble cursor: Enhancing target acquisition by dynamically resizing of the cursor’s activation area. In Proceedings of the CHI 2005 Conference on Human Factors in Computing Systems (pp. 281-290). New York: ACM Press. Guiard, Y., and Beaudouin-Lafon, M. (Eds.). (2004). Fitts’ law 50 years later: Applications and contributions from human-computer interaction (special issue). International Journal of Human-Computer Studies, 61(6). Guiard, Y., Blanch, R., and Beaudouin-Lafon, M. (2004). Object pointing: A complement to bitmap pointing in GUIs. In Proceedings of Graphics Interface 2004 (pp. 9-16). London, ON: Canadian Human-Computer Communications Society. Hertzum, M., and Hornbæk, K. (2007). Input techniques that dynamically change their cursor activation area: A comparison of bubble and cell cursors. International Journal of Human-Computer Studies, 65(10), 833851. Hourcade, J.P. (2006). Design for children. In G. Salvendy (Ed.), Handbook of Human Factors and Ergonomics. Third Edition (pp. 1446-1458). Hoboken, NJ: Wiley. Hourcade, J.P., Bederson, B.B., Druin, A., and Guimbretière, F. (2004). Differences in pointing task performance between preschool children and adults using mice. ACM Transactions on Computer-Human Interaction, 11(4), 357-386. Hwang, F., Keates, S., Langdon, P., and Clarkson, J. (2005). A submovement analysis of cursor trajectories. Behaviour & Information Technology, 24(3), 205-217. ISO 9241 (2000). Ergonomic Requirements for Office Work with Visual Display Terminals (VDT’s) – Part 9: Requirements for Non-Keyboard Input Devices. Geneva, CH: International Organization for Standardisation. Kaiser, J.F., and Reed, W.A. (1977). Data smoothing using low-pass digital filters. Review of Scientific Instruments, 48(11), 1447-1457. Kaiser, J.F., and Reed, W.A. (1978). Bandpass (bandstop) digital filter design routine. Review of Scientific Instruments, 49(8), 1103-1106. Ketcham, C.J., Seidler, R.D., van Gemmert, A.W.A., and Stelmach, G.E. (2002). Age-related kinematic differences as influenced by task difficulty, target size, and movement amplitude. Journal of Gerontology: Psychological Sciences, 57B(1), 54-64. Ketcham, C.J., and Stelmach, G.E. (2001). Age-related declines in motor control. In J.E. Birren and K.W. Schaie (Eds.), Handbook of the Psychology of Aging. Fifth Edition (pp. 313-348). San Diego, CA: Academic Press. Kurtenbach, G.P., Sellen, A.J., and Buxton, W.A.S. (1993). An empirical evaluation of some articulatory and cognitive aspects of marking menus. Human-Computer Interaction, 8(1), 1-23. Lambert, J., and Bard, C. (2005). Acquisition of visuomanual skills and improvement of information processing capacities in 6- to 10-year-old children performing a 2D pointing task. Neuroscience Letters, 377(1), 1-6. Lank, E., Cheng, Y.-C. N., and Ruiz, J. (2007). Endpoint prediction using motion kinematics. In Proceedings of the CHI 2007 Conference on Human Factors in Computing Systems (pp. 637-646). New York: ACM Press. MacKenzie, I.S. (1992). Fitts’ law as a research and design tool in human-computer interaction. HumanComputer Interaction, 7(1), 91-139.
15
MacKenzie, I. S., Kauppinen, T., and Silfverberg, M. (2001). Accuracy measures for evaluating computer pointing devices. In Proceedings of the CHI 2001 Conference on Human Factors in Computing Systems (pp. 9-16). New York: ACM Press. McGuffin, M., and Balakrishnan, R. (2005). Fitts’ law and expanding targets: Experimental studies and designs for user interfaces. ACM Transactions on Computer-Human Interaction, 12(4), 388-422. Meyer, D.E., Abrams, R.A., Kornblum, S., Wright, C.E., and Smith, J.E.K. (1988). Optimality in human motor performance: Ideal control of rapid aimed movements. Psychological Review, 95(3), 340-370. Mithal, A.K., and Douglas, S.A. (1996). Differences in movement microstructure of the mouse and the fingercontrolled isometric joystick. In Proceedings of the CHI 96 Conference on Human Factors in Computing Systems (pp. 300-307). New York: ACM Press. Moyle, M., and Cockburn, A. (2005). A flick in the right direction: A case study of gestural input. Behaviour & Information Technology, 24(4), 275-288. Murata, A. (1998). Improvement of pointing time by predicting targets in pointing with a PC mouse. International Journal of Human-Computer Interaction, 10(1), 23-32. Nichols, T.A., Rogers, W.A., and Fisk, A.D. (2003). Do you know how old your participants are? Ergonomics in design, 11(3), 22-26. Nichols, T.A., Rogers, W.A., and Fisk, A.D. (2006). Design for aging. In G. Salvendy (Ed.), Handbook of Human Factors and Ergonomics. Third Edition (pp. 1418-1445). Hoboken, NJ: Wiley. Phillips, J.G., and Triggs, T.J. (2001). Characteristics of cursor trajectories controlled by the computer mouse. Ergonomics, 44(5), 527-536. Pohl, P.S., Winstein, C.J., and Fisher, B.E. (1996). The locus of age-related movement slowing: Sensory processing demands of a continuous goal-directed aiming task. Journal of Gerontology: Psychological Sciences, 51B(2), 94-102. Ren, X., and Moriya, S. (2000). Improving selection performance on pen-based systems: A study of pen-based interaction for selection tasks. ACM Transactions on Computer-Human Interaction, 7(3), 384-416. Scaife, M., and Bond, R. (1991). Developmental changes in childrens’ use of computer input devices. Early Child Development and Care, 69(1), 19-38. Seidler, R., and Stelmach, G. (1996). Motor control. In J. Birren (Ed.), Encyclopedia of Gerontology. Volume 2 (pp. 177-185). San Diego, CA: Academic Press. Smith, M.W., Sharit, J., and Czaja, S.J. (1999). Aging, motor control, and the performance of computer mouse tasks. Human Factors, 41(3), 389-396. Smyrnis, N., Evdokimidis, I., Constantinidis, T.S., and Kastrinakis, G. (2000). Speed-accuracy trade-off in the performance of pointing movements in different directions in two-dimensional space. Experimental Brain Research, 134(1), 21-31. Soukoreff, R.W., and MacKenzie, I.S. (2004). Towards a standard for pointing device evaluation, perspectives on 27 years of Fitts’ law research in HCI. International Journal of Human-Computer Studies, 61(6), 751789. Strommen, E.F., Revelle, G.L., Medoff, L.M., and Razavi, S. (1996). Slow and steady wins the race? Threeyear-old children and pointing device use. Behaviour & Information Technology, 15(1), 57-64. Walker, N., Philbin, D.A., and Fisk, A.D. (1997). Age-related differences in movement control: Adjusting submovement structure to optimize performance. Journal of Gerontology: Psychological Sciences, 52B(1), 40-52. Welford, A.T. (1977). Motor performance. In J.E. Birren and K.W. Schaie (Eds.), Handbook of the Psychology of Aging (pp. 450-496). New York: Van Nostrand Reinhold. Whisenand, T.G., and Emurian, H.H. (1996). Effects of angle of approach on cursor movement with a mouse: Consideration of Fitts’ law. Computers in Human Behavior, 12(3), 481-495. Worden, A., Walker, N., Bharat, K., and Hudson, S. (1997). Making computers easier for older adults to use: Area cursors and sticky icons. In Proceedings of the CHI 97 Conference on Human Factors in Computing Systems (pp. 266-271). New York: ACM Press.
16
Zhai, S. (2004). Characterizing computer input with Fitts’ law parameters - The information and noninformation aspects of pointing. International Journal of Human-Computer Studies, 61(6), 791-809.
17
Table 1. Participants’ experience using computers (N = 36 participants); significant differences between age groups are marked with asterisks. Young Adult Elderly Mean SD Mean SD Mean SD 1 Mouse experience 6.58 1.31 7.50 1.09 7.25 1.54 Touchpad experience 1 4.50 2.32 6.17 2.08 4.75 2.01 Years of computer use ** 5.75 2.22 10.92 4.27 14.04 6.51 Years of Internet use *** 4.04 1.53 9.25 1.60 9.50 3.29 Hours of computer use a week * 17.96 13.69 29.79 14.50 15.04 10.84 Hours online a week 14.46 13.65 18.08 12.92 8.83 5.59 1 Participants indicated their mouse and touchpad experience on nine-point rating scales (1: none – 9: very experienced). * p < 0.05, ** p < 0.01, *** p < 0.001. Question
18
Table 2. Participants’ general feelings toward computers (N = 36 participants); questions adopted from Ceaparu et al. (2004). Question Computers make me feel (1: very uncomfortable – 9: very comfortable) When you run into a problem on the computer or an application you are using, do you feel (1: anxious – 9: relaxed/indifferent) When you encounter a problem on the computer or an application you are using, how do you feel about your ability to fix it (1: helpless – 9: confident that I can fix it) How experienced do you think you are when it comes to using a computer (1: very inexperience – 9: very experienced) When there is a problem with a computer that I can’t immediately solve, I would stick with it until I have the answer (1: strongly disagree – 9: strongly agree) If a problem is left unresolved on a computer, I would continue to think about it afterward (1: strongly disagree – 9: strongly agree)
Young Mean SD
Adult Mean SD
Elderly Mean SD
7.67
1.23
7.75
0.62
6.75
0.97
5.50
1.51
5.67
1.37
6.58
1.00
6.25
1.22
6.17
1.70
5.42
2.11
7.33
1.07
7.08
1.24
6.67
1.72
5.50
1.57
6.33
1.87
5.17
2.17
5.67
2.10
6.25
1.96
5.42
2.75
19
Table 3. Trial completion time divided onto three phases (N = 12338 trials); significant differences between age groups are marked with asterisks. Phase Mouse Reaction time (ms) Movement time (ms) Selection time (ms)
Young
*** ***
Touchpad Reaction time (ms) *** Movement time (ms) ** Selection time (ms) *** ** p < 0.01, *** p < 0.001
Adult
Elderly Mean SD
Mean
SD
Mean
SD
92 683 338
16 62 64
108 687 391
43 80 95
90 918 578
33 111 97
281 1127 669
45 362 164
368 861 721
69 149 131
467 1188 1044
112 194 216
20
Table 4. Submovement analysis of cursor trajectories (N = 12338 trials); significant differences between age groups are marked with asterisks. Measure Mouse No. of submovements Distance left to target a (%) Max speed (pixels/s) Max speed submovement b Max speed offset c (ms)
*** ** * *** ***
Young Mean SD
Mean
SD
Elderly Mean SD
4.19 43% 1448 1.26 123
4.34 41% 1508 1.26 123
0.60 0.10 278 0.11 7.3
6.01 54% 1253 1.56 141
0.43 0.08 132 0.08 7.9
Adult
0.74 0.09 219 0.19 6.6
Touchpad No. of submovements ** 7.71 1.80 6.84 0.92 8.90 1.00 Distance left to target a (%) ** 51% 0.08 40% 0.07 48% 0.08 Max speed (pixels/s) 1640 231 1688 267 1515 293 b Max speed submovement ** 1.55 0.24 1.29 0.10 1.45 0.15 Max speed offset c (ms) 139 9.1 134 12.8 137 6.7 a Distance from endpoint of first submovement to centre of target in percent of inter-target distance. b The submovement during which maximum speed was reached. c Time interval from start of fastest submovement to maximum speed was reached. * p < 0.05, ** p < 0.01, *** p < 0.001
21
Table 5. Angle between cursor trajectory and direction to target (N = 12338 trials); significant differences between age groups are marked with asterisks. Measure Mouse Angle at 10% of distance (degrees) Angle at 20% of distance (degrees) Angle at 30% of distance (degrees) Angle at 40% of distance (degrees) Angle at 50% of distance (degrees) Angle at 60% of distance (degrees) Angle at 70% of distance (degrees) Angle at 80% of distance (degrees) Angle at 90% of distance (degrees) Angle at 100% of distance (degrees) Touchpad Angle at 10% of distance (degrees) Angle at 20% of distance (degrees) Angle at 30% of distance (degrees) Angle at 40% of distance (degrees) Angle at 50% of distance (degrees) Angle at 60% of distance (degrees) Angle at 70% of distance (degrees) Angle at 80% of distance (degrees) Angle at 90% of distance (degrees) Angle at 100% of distance (degrees) * p < 0.05
* * * *
Young Mean SD
Adult Mean SD
Elderly Mean SD
39.87 31.66 26.28 22.39 19.47 16.33 12.96 10.04 7.74 6.36
6.24 6.40 6.46 6.07 5.94 5.67 4.86 3.40 2.95 2.79
36.70 27.09 23.00 19.87 17.14 14.44 11.91 9.26 6.82 5.37
10.33 8.78 8.38 7.62 6.44 5.61 4.92 3.70 3.06 2.72
41.76 34.34 29.79 25.93 21.92 18.78 15.26 11.98 9.04 6.57
6.93 6.79 7.14 6.72 5.52 4.97 4.48 3.40 3.16 2.68
26.79 17.16 14.36 12.30 10.95 9.47 8.29 7.06 6.04 5.43
7.22 5.88 4.96 4.39 4.23 3.29 2.75 2.38 2.07 1.80
21.74 12.98 10.68 9.39 8.48 7.27 6.48 5.73 4.94 4.36
5.51 3.70 2.76 2.45 2.33 2.31 2.12 2.09 1.97 1.78
26.23 17.68 14.85 12.62 11.03 9.82 8.82 7.47 6.53 5.76
3.40 3.04 2.91 2.16 2.21 2.14 2.11 1.47 1.37 1.42
22
Table 6. Participants’ subjective ratings of the pointing devices (N = 36 participants); significant differences between pointing devices are marked with asterisks. Mouse
Question
Touchpad
Mean
SD
Mean
SD
1.31
0.47
2.64
1.02
1.86
0.76
3.06
0.89
1.69
0.52
3.31
1.01
1.61
0.55
2.33
1.01
1.78
0.83
2.69
1.19
1.86
0.87
2.81
1.67
2.00
1.04
2.81
1.28
Wrist fatigue (1: none – 5: very high)
2.17
1.00
2.47
1.16
Arm fatigue (1: none – 5: very high)
2.42
1.13
2.78
1.07
Shoulder fatigue (1: none – 5: very high)
2.14
1.17
2.17
0.97
1.75
1.02
2.03
0.94
Overall, the pointing device was (1: very easy to use – 5: very difficult to use)
***
Long cursor movements were (1: very easy – 5: very difficult)
***
Accurate pointing was (1: very easy – 5: very difficult)
***
Object selection (clicking) was (1: very easy – 5: very difficult)
**
Mental effort required for operation was (1: very low – 5: very high)
***
Physical effort required for operation was (1: very low – 5: very high)
***
Finger fatigue (1: none – 5: very high)
**
Neck fatigue (1: none – 5: very high) ** p < 0.01, *** p < 0.001
23
Figure 1. Sample screen with large targets and medium distance between targets. The current target (in the lower left), was red while the other objects were light blue.
24
(c) Speed
(a) Logged cursor positions
Start
Pixels/second
1500
Target
1000
500
0 0
500
1000
1500
Time (ms)
(b) Distance from start
(d) Acceleration 300
Pixels/second/second
400
Pixels
300
200
100
200
100
0 0
500
1000
1500
-100
0 0
500
1000
1500
-200 Time (ms)
Time (ms)
Figure 2. Example of young participant pointing with the touchpad: (a) logged cursor positions for movement across large distance to large target; (b) distance moved away from start, dashed lines indicating boundaries between reaction, movement, and selection times; (c) movement speed, dashed lines indicating submovement boundaries; (d) movement acceleration, dashed lines indicating submovement boundaries.
25
Figure 3. Learning effects for mouse and touchpad in terms of error rates (N = 27242 trials) and trial completion times (N = 24497 trials); error bars show standard error of the mean.
26
Mouse Touchpad
N 15%
NW
10%
NE
5%
W
SW
SE S
Figure 4. Error rates (N = 13650 trials); error bars show standard error of the mean.
27
E
0%
Mouse Touchpad
N 2500 2000
NW
NE
1500 1000 500
W
SW
SE S
Figure 5. Trial completion times (N = 12338 trials); error bars show standard error of the mean.
28
E
0
Mouse 3500 3000
Time (ms)
2500
Elderly
2000
Adult ( )
1500
Young ( ) 1000 500 0 2
3
4
5
6
7
ID
Touchpad 3500
Elderly
3000
Young
Time (ms)
2500 2000
Adult
1500 1000 500 0 2
3
4
5
ID
6
7
Figure 6. Regression lines for index of difficulty versus time (movement and selection phases).
29
Angle (degrees)
40
30
20
Mouse
10
Touchpad 0 10
20
30
40
50
60
70
80
90
100
Percent of inter-target distance away from start Figure 7. Angle between cursor trajectory and direction to target after the cursor had moved different percentages of the inter-target distance away from its position at the beginning of a trial (N = 12338 trials); error bars show standard error of the mean.
30