How Can We Predict Performance in Tertiary Level Economics?
Lemin Zhang Dan Marsh
Department of Economics University of Waikato Private Bag 3105 Hamilton New Zealand,
[email protected],
Summary The New Zealand Qualification Authority (NZQA) started to introduce a new qualification; the National Certificate of Educational Achievement (NCEA) in 2002. NCEA level 3 replaced the University Bursary Examinations in 2004. The main purpose of this paper is to investigate the relationship between the number and quality of credits gained at NCEA level 3 by students and their academic performance in a first year economics course – Business Economics and the New Zealand Economy at Waikato University. Other factors that could affect student performance are also investigated. Our analysis suggests that several factors can have an impact on student’s performance in ECON100. These factors include nationality, semester, total number of NCEA level 3 credits and the quality of credits at level 3 in NCEA economics and mathematics. Keywords: Qualification, Education, Testing
1
Introduction The National Certificate of Education Achievement (NCEA) is New Zealand’s main national qualification for secondary school students and is part of the national qualifications framework (NQF). In 2002 NCEA level 1 replaced School Certificate as the new national secondary school qualification. In 2003, NCEA level 2 replaced 6th Form Certificate. Finally, NCEA level 3 replaced the University Bursary Examinations in 2004 (New Zealand Qualification Authority, 2002). In the new system, learning is assessed using national standards, which describe what a student should know or be able to do for certain topics. Each subject is defined by a series of these standards, and a student is then assessed against these standards. Assessment is done by external examination and/or in the classroom by internal assessment. Every time a student achieves a standard he/she earns a certain amount of credits towards a qualification. A student may be able to do courses either at school, in a workplace or at another provider that will be assessed by qualified assessors from outside school. These credits all count towards his/her NCEA and/or other National Certificates.
Motivation The new qualification system has generated much debate. One area of concern has been the ability of the new qualification system to measure secondary school students’ abilities accurately. Employers are concerned with whether the new qualification can be used as a standard to hire the right graduates for the job while universities want to know which students are qualified for further study at university and how the best students can be identified. This paper was initially motivated by the desire to understand how NCEA qualifications data can be used to identify ‘good1’ economics students. Under the old bursary system, students who scored at least 75% in bursary economics were regarded as ‘good’ students who should skip introductory economics and move straight on to intermediate papers. The NCEA provides a wealth of information about students’ educational achievements but does not provide any simple metric that allows the identification of top students in a particular subject. The main purpose of this paper is to investigate the degree to which students’ NCEA qualifications data can be used predict academic performance in an introductory economics paper (ECON100) at the University of Waikato. The results of this analysis are then used to draw conclusions on the extent to which NCEA qualifications data can be used to identify ‘good’ students.
1 In this context, ‘good’ may be taken to mean ‘students who would have achieved a mark of at least 75% in bursary economics i.e. the top 10-20% of students who have studied economics to a senior level at high school.
2
Literature Review It is the fourth year since NZQA started to replace the old qualification system by NCEA. But, so far, there has been no research to study the correlation between students’ NCEA level 3 credits and their performance in university. This is because the first students with NCEA level 3 credits finished their first year of university study at the end of 2005. Hence, the data used to measure their performance in university was not available until the end of 2005. However, the literature on factors affecting student performance in universities can help to identify the factors that might impact their performance in ECON100. Those factors can be divided into three groups. The first group is related to students’ characters, such as gender (Bagamery, Lasik & Nixon, 2005; Myatt & Waddell, 1990; Borg & Stranahan, 2002), age (Didia & Hasnat, 1998; Reid, 1983), and attitude (Myatt & Waddell, 1990). The second group is the environment in which students live and study, such as family background (Jaggia & Kelly-Hawke, 1999) and school inputs (Arias & Walker, 2004; Jaggia & Kelly-Hawke, 1999). The last group is the stock of knowledge related to economics courses, such as the stock of economics knowledge before taking economics courses (Myatt & Waddell, 1990; Lopus & Maxwell, 1994) and the stock of mathematics knowledge (Myatt & Waddell, 1990; Ballard & Johnson, 2004).
Students’ Characteristics and Their Performance Didia and Hasnat (1998) examined the determinants of student performance in an introductory finance course. They found that age, as a measure of maturity, had a significant influence on performance. Reid (1983) focused his study on an introductory university economics course and also found that age was a significant variable with older students performing better than younger ones. Although these studies indicate that age can affect academic performance, age is not included in this study because students who entered Waikato University after taking NCEA had very similar ages. Baqamery, Lasik and Nixon (2005) examined a large set of variables to identify predictors of student performance on the Educational Testing Service Major Field Exam in Business. They found that males performed better than females in the exam. Myatt and Waddell (1990) based their study on university economics courses and also found that males performed better than females in economics courses. In Borg and Stranahan’s (2002) study, they gave a biological explanation to this gender effect. “Females mature more rapidly than males causing them to develop higher verbal skills but lower spatial and numerical skills relative to males. Since the latter skills are more useful in the types of multiple choice tests that are used to measure economic knowledge, males appear to have an advantage in acquiring economic knowledge. This explanation may be the reason that the gender differential is smaller in the studies that used essay and other types of questions to measure economic knowledge (p.590)”
3
Family Background and School Environment The question of whether school inputs, such as class-size, student-teacher ratio and teacher salaries matter for student performance has been argued for at least 30 years. Arias and Walker (2004) conducted an experiment to test the relationship between classsize and student performance. They controlled for variation in instruction, lecture material, and topic coverage by using the same instructors. They also accounted for variation in student abilities. They found statistically significant evidence that small class size had a positive impact on student performance. One problem with Arias and Walker’s study is that they did not include any information about student’s family background. Jaggia and Kelly-Hawke (1999) included variables on school inputs and student’s family background in order to test whether these two kinds of variables influence student performance. They found that higher levels of spending did not have any consistent relationship with student performance. However, family background was clearly very important in explaining differences in achievement.
Students’ Knowledge of Economics and Mathematics Myatt and Waddell (1990) investigated the relationship between student performance and prior study of economics and mathematics. They found that students who took economics and had high economics marks in high school performed better in economics courses in university. They found the same relationship for student’s prior study of mathematics. Ballard and Johnson (2004) attempted to identify more specifically what types of mathematics skills were important for student success in introductory microeconomics. They specified whether the student had taken a calculus course and the student’s score in the mathematics portion of the Assessment Test (ACT). They also defined mathematics skills by whether the student had been required to take a remedial mathematics class and by the student’s score on an in-class test of very basic mathematic skills. These basic mathematic skills included the ability to calculate the slope of a line, to calculate the area of a triangle, or to divide by a fraction. They found that student performance in introductory microeconomics courses depended on mastery of basic mathematics skills rather than sophisticated mathematics skills like calculus. The literature reviewed above identifies several factors that might influence student performance in university economics courses. These include age, gender, family background, student attitude and stock of mathematics and economics knowledge. These factors are included, where possible, in the regression analysis reported below.
Data Student data was obtained from the Economics Department and the Management Information Unit (MIU). Three categories of variables were provided by MIU; personal information e.g. ID, gender, citizenship; academic information e.g. paper occurrence, final grade, final grade status, final result status and NCEA information e.g. approved level three credits, economic approved credits, mathematic approved credits, etc. this
4
data is summarized in Table 1 using an example. Table 1:
Example of MIU Record
Personal Information ID
Gender Code Date Of Birth Citizenship Code
2024785
F
9/Oct/86
NZ
Academic Information at Waikato University Admission Prog - Abbr Waikato 1St Reason BMS
Paper Final Occurrence Grade
ECON100University 05B Entrance (NCEA) 2004- (HAM)
2005
Final Grade Status
B-
C
Grade Result Status Final
NCEA Information Approved All Level Level Three Three Credits - A Credits - Outcome US Level Level
112
112
Economic Maths Economic Economic Maths Credits Approved Credits Approved Credits E M old code - A E M Credits - Outcome Credits - Outcome Outcome US Level Level US Level Level Level
15 2
7
24
24
8 6 10
24
Notes: 1. Care was taken to protect student confidentiality. Names and ID numbers were removed from the dataset. Each record was identified using a serial number only. 2. Maths Approved Credits are the sum of the credits from NCEA level 3 statistics and calculus.
5
The most commonly used measure of NCEA attainment is ‘number of NCEA credits achieved’. The problem with this measure is that it provides no quality information beyond the fact that they have achieved the required standard. Some NCEA standards (achievement standards) can be achieved, achieved with merit, or achieved with excellence. Information from these standards was used to create two new variables, quality adjusted number of NCEA economic level 3 credits (ECQ) and quality adjusted number of NCEA mathematic level 3 credits (MAQ). The process of creating ECQ and MAQ is shown below: 1. The grade a student earns for each achievement standard is assigned a numerical grade value. These values were obtained from NZQA website. (New Zealand Qualification Authority, 2004) and are used by NZQA to calculate ‘grade averages’. Standards that a student has not achieved are not included. Results
Grade value
Excellence Merit Achieved the standard
4 3 2
2. For each standard achieved, the student's grade value is multiplied by the number of credits set for that standard. This generates a raw score for each achievement standard. 3. The raw scores for individual achievement standard are added together to obtain a total raw score. For example, a student achieves 19 credits ‘Achieved’, 6 credits with ‘Merit’ and 5 credits with ‘Excellence’. Their total raw score is (19×2)+(6×3)+(5×4)=76.
Analysis and Results Student Characteristics Six hundred and eighteen (618) students studied ECON100 in A or B semester in 2005, of these 38% (234) were reported to have gained university entrance based on their achievements in NCEA. Some of the key characteristics of these students are summarised in Table 2. Although 234 students entered university after taking NCEA (NCEA Students), 19 had no NCEA level 3 credits, 1 student had no ECON100 final mark, 2 students failed the paper in A semester and re-took it in B semester. Only their ECON100 final marks in A 6
semester were counted. As a result, only 212 students were used in the regression analysis. Table 2:
Characteristics of Students Taking ECON100 in 2005
Characteristics
All Students NCEA Students
Number of students
618
234
17-46
17-27
Number of males
296 (47.9%)
104 (44.4%)
Number of females
322 (52.1%)
130 (55.6%)
Number of New Zealanders
364 (58.9%)
177 (75.6%)
36 (5.8%)
11 (4.7%)
Number of overseas students
218 (35.3%)
46 (19.7%)
Number of students enrolled in A semester
341 (55.2%)
128 (54.7%))
Number of students enrolled in B semester
277 (44.8%)
106 (45.3%)
Number of students to whom ECON100 was a compulsory paper
538 (87.1%)
222 (94.9%)
Number of students to whom ECON100 was an elective paper
80 (12.9%)
12 (5.1%)
Age range
Number of PR
Note: the percentages in ( ) are the proportion of students in the group of either all students or NCEA students.
NCEA Credits – All Subjects NCEA students taking ECON100 gained between 4 and 125 NCEA level 3 credits. The average number of credits was 78 with a standard deviation of 23.1. The frequency distribution of approved NCEA level 3 credits per student is shown in Figure 1. There was a strong positive correlation (0.7) between students’ approved NCEA level 3 credits and their ECON100 final marks. ECON100 final mark per student against approved NCEA level 3 credits per student is plotted in Figure 2
7
Figure 1:
Frequency Distribution of Approved NCEA Level 3 Credits
40
34
35 Number of students
33
16.0%
15.6%
27
30
24
12.7%
25
20
20
9.4%
9.4%
11.3%
23 21
10.8%
9.9%
20 15 10
10 4.7%
5
>1 09
10 010 9
90 -
99
89
79
80 -
60 -
70 -
69
59 50 -
42 -
29
Credits range
Note: the percentages are proportion of students with certain credits range in 212 NCEA students.
The quality adjusted variable (ECQ) ranged from 0 to 80 with a mean of 21 and a standard deviation of 21.3. The frequency distribution of ECQ is shown in Figure 4. The correlation between students’ ECQ and their ECON100 final marks was 0.33, which was slightly higher than that between approved NCEA economic level 3 credits and ECON100 final marks (0.29). ECON100 final mark per student against ECQ is plotted in Figure 5.
9
Figure 4:
Frequency Distribution of ECQ
Number of students
100 90
79
80
37.3%
70 60 50
37
40
17.5%
23
30
17 8.0%
20
21
10.8%
11
15
9.9%
7.1%
6
5.2%
10
3
2.8%
1.4%
0 0
1~10
11~20
21~30
31~40
41~50
51~60
61~70
71~80
ECQ units range
Note: the percentages are proportion of students with certain ECQ units range in 212 NCEA students.
Figure 5:
ECON100 Final Mark per Student vs. ECQ per Student y = 0.51x + 43.54 2
R = 0.29
100 90 ECON final mark
80 70 60 50 40 30 20 10 0 0
10
20
30
40
50
60
70
80
90
ECQ
Note: the equation shows the linear relationship between ECON100 final marks (y) and ECQ (x).
10
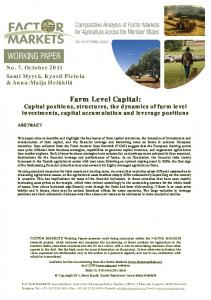
NCEA Mathematics Credits Several authors (Myatt & Waddell, 1990; Ballard & Johnson, 2004) found that the stock of student’s mathematic knowledge can affect performance in economics courses. In this study, two variables were used to measure student’s mathematic background – approved NCEA mathematic level 3 credits and MAQ (the process of creating MAQ was described above). Approved NCEA mathematic level 3 credits per student ranged from 0 to 55 with a standard deviation of 14.1. The average amount of credits was 21. About 18% students did not have any credits in NCEA level 3 mathematic. The frequency distribution of approved NCEA mathematic level 3 credits per student is shown in Figure 6. It can be seen that more than 40% of students had between 16 and 25 mathematic credits. Figure 6:
Frequency Distribution of NCEA Mathematic Level 3 Credits
60
Number of students
21.2% 21.7%
39 40
46
45
50 18.4%
30 16
14
20
7.5%
6.6%
6~10 11~15 16~20 21~25 26~30 31~35 36~40 41~45
>45
6.6% 4
10
14 10 4.7%
6 2.8%
9
9
4.2%
4.2%
1.9% 0 0
1~5
Credits range Note: the percentages are proportion of students with certain credits range in 212 NCEA students.
The quality adjusted variable (MAQ) used to measure the stock of student’s mathematics knowledge ranged from 0 to 174 with a standard deviation of 37.9. The average MAQ of students was 51.The frequency distribution of MAQ is shown in Figure 7. The correlation of students’ MAQ and their ECON100 final marks was 0.42, which was higher than that between approved NCEA mathematic level 3 credits and ECON100 final marks (0.31). ECON100 final mark per student against MAQ is plotted in Figure 8.
11
Figure 7: Frequency Distribution of MAQ 70
62 29.2%
Number of students
60 50
39
39 18.4%
40
18.4%
30 14.2%
30
14 6.6%
20 8
9 6 2.8%
3.8%
10
4.2% 2 0.9%
3 1.4%
0 0
1~20
21~40
41~60
61~80
81~100 101~120 121~140 141~160 161~180
MAQ units range
Note: the percentages are proportion of students with certain MAQ units range in 212 NCEA students.
Figure 8:
ECON100 Final Mark per Student vs. MAQ per Student y = 0.20x + 49.47 2
R = 0.17
120
ECON100 final mark
100 80 60 40 20 0 0
20
40
60
80
100
120
140
160
180
200
MAQ
Notes: the equation shows the linear relationship between ECON100 final marks (y) and MAQ (x).
12
Selection of Regression Model The relationships between ECON100 final mark and various independent variables (NCEA level 3 credits, NCEA economic level 3 credits/ECQ and NCEA mathematic level 3 credits/MAQ) have been described and plotted above. Scatter plots reveal that the relationship between ECON100 final mark and each of these variables tends to be linear so the multiple linear regression model was selected for use in this study. Variable descriptions and statistics are summarised in Table 3 and the results of alternative formulations of the regression model are summarized in Table 4. The regression in the first column in Table 4, labelled 1, includes the independent variables (MALE, NZ, A and COMP) used to describe students’ characteristics with respect to gender, nationality, semester and whether or not the paper was compulsory and each student’s approved NCEA level 3 credits (L3C). In this regression, only the coefficients for COMP (whether or not ECON100 was compulsory) and L3C (number of level 3 credits) are significant at the 1% level. The negative sign of COMP suggests that, holding other variables constant, a student would achieve a lower mark in ECON100 if ECON100 is one of his/her compulsory paper. In regression 2, L3C was replaced by ECON (number of level 3 economics credits). The coefficient of ECON is significant at the 1% level, which indicates that the stock of student’s economic knowledge can affect performance in ECON100. The adjusted R2 falls to 0.196 and standard error increases to 14.5 indicating that the regression suffers some omitted variable bias. In regression 3, MATH (number of level 3 maths credits) was added to see whether the stock of student’s mathematic knowledge has an impact on their performance in ECON100. Both the coefficients of ECON and MATH are significant at the 1% level, which indicates that both the stock of student’s economic and mathematic knowledge can affect their ECON100 final marks. In regressions 4 and 5, different variables were used to indicate the stock of student’s economic and mathematic skills in order to identify which variables are more accurate in predicting student’s ECON100 final marks. In regression four, the coefficients of L3C and MATH are significant at the 1% level and ECON is significant at the 5% level. In regression five, the coefficients of L3C, ECQ and MAQ are all significant at the 1% level. The adjusted R2 increases to 0.55. In order to identify which regression (4 or 5) should be used to predict student’s ECON100 final mark, 40 observations were randomly pulled out from 212 students 3000 times to calculate the discrepancy between the predicted values and actual values. At each quantile, the mean absolute error of regression 5 is smaller than that of regression 4, which indicates that regression 5 is more accurate in predicting student performance in ECON100.
13
dummy variable. If a student is New Zealander, NZ=1. If not, NZ=0
NZ
14
a variable created to measure the quality of NCEA economics level 3 credits
approved NCEA mathematics level 3 credits per student
a variable created to measure the quality of NCEA mathematics level 3 credits
ECQ
MATH
MAQ
51
21
21
9
78
0.57
0.95
0.79
0.43
60.1
Mean
2. "Correlation" is the correlation between each independent variable and ECON100 final mark
Notes: 1. total number of observations is 212
approved NCEA economics level 3 credits per student
approved total NCEA level 3 credits per student
ECON
L3C
A
dummy variable. If ECON100 is a compulsory parper for a student, COMP=1. If not, COMP=0 dummy variable. If a student took ECON100 in A semester in 2005, A=1. If B semester, A=0
dummy variable. If a student is male, MALE=1. If female, MALE=0
MALE
COMP
dependent variable. The final mark of ECON100 in 2005 per student
Description
MARK
Variable
Table 4.5.1 Variable Description and Statistics
3 174
55
80
37
125
1
1
1
1
99
Max
0
0
0
0
4
0
0
0
0
10
Min
37.9
14.1
21.3
9.1
23.1
--
--
--
--
16.0
Standard Deviatioin
0.42
0.31
0.33
0.29
0.70
-0.03
-0.11
0.28
0.05
--
Correlation
Table 4
Regression Results Comparison
Dependent variable: ECON100 final mark per student in Waikato University in 2005 Regressor
1
2
3
4
5
MALE
1.862 (1.145)
4.041 (1.931)*
1.295 (0.679)
1.058 (0.657)
0.726 (0.458)
NZ
1.631 (0.773)
10.894 (4.286)***
16.498 (6.879)***
4.975 (2.088)**
5.141 (2.289)**
-9.783 (-2.755)***
-12.556 (-2.723)***
-9.122 (-2.199)**
-9.369 (-2.677)***
-8.449 (-2.443)**
-2.476 (-1.580)
-2.577 (-1.266)
-3.082 (-1.693)*
-2.882 (-1.876)*
-2.868 (-1.900)*
0.395 (9.167)***
0.358 (8.089)***
COMP A L3C
0.479 (13.202)***
ECON
0.509 (4.542)***
0.436 (4.330)***
0.194 (2.184)**
ECQ
0.103 (2.725)***
MATH
0.505 (7.276)***
0.192 (2.824)***
MAQ C
0.094 (3.760)*** 31.520 (7.113)***
58.417 (11.601)***
42.503 (8.494)***
29.854 (6.722)***
30.630 (7.079)***
Ajusted R2
0.509
0.196
0.342
0.532
0.548
SER
11.194
14.501
12.959
10.933
10.747
212
212
212
212
212
n
Notes: 1. * coefficient is significant at 10% level; ** coefficient is significant at 5% level; *** coefficient is significant at 1% level. 2. the number in ( ) is t-value. 3. SER is standard error of regression. 4. n is the number of observations.
15
Characteristics of Students with NCEA Economics Credits Many students (37%) did not have any approved NCEA economic level 3 credits, either because they did not take level 3 economics at high school or because they did not achieve the required standard. This may cause some bias in the results reported above because a student with a high number of approved NCEA level 3 credits who does not take economics at high school may achieve a high grade after studying ECON100. In order to reduce this bias, model 5 was used to repeat the regression for the group of students who had at least one economic credit. The characteristics of this sub-group are summarized in Table 5 with the regression results for both groups being shown in Table 6.
Table 5:
Characteristics of Students with at least one Economics Credit
Number of Students: 133 Variables
Mean
Max
Min
Standard Deviatioin
Correlation
MARK
61.3
91
10
15.4
--
MALE
0.44
1
0
--
0.003
NZ
0.82
1
0
--
0.045
COMP
0.97
1
0
--
-0.11
A
0.61
1
0
--
-0.06
L3C
79
125
37
22.2
0.68
ECON
15
37
2
7.0
0.51
ECQ
33
80
4
17.5
0.56
MATH
19
50
0
12.7
0.24
MAQ
47 152 0 32.4 0.36 Notes: 1. the description of each variable is shown in Table 4.5.1 2. "Correlation" is the correlation between each independent variable and ECON100 final marks.
16
Table 6:
Regression Results (Dependent Variable=MARK)
Variable Constant MALE (dummy) NZ (dummy) COMP (dummy) A (dummy) L3C ECQ MAQ Ajusted R2 Number of students
Coefficient All NCEA students 30.630 (7.078)*** 0.726 (0.457) 5.141 (2.289)** -8.449 (-2.443)** -2.868 (-1.899)* 0.358 (8.089)*** 0.103 (2.725)*** 0.094 (3.760)*** 0.548
Coefficient Students who have more than 0 economics credits 38.428 (5.989)*** 0.718 (0.371) 11.621 (3.554)*** -12.853 (-2.345)** -3.493 (-1.844)* 0.212 (2.817)*** 0.189 (2.570)** 0.099 (2.703)*** 0.532
212
133
Notes: 1. * coefficient is significant at 10% level; ** coefficient is significant at 5% level; *** coefficient is significant at 1% level. 2. the number in ( ) is t-value.
Results Gender and Citizenship Regression results for ‘all students’ and for those who had achieved credits in level 3 economics (Table 6) indicate that gender has no significant effect on students’ final marks in ECON100, this is in contrast to the results from several previous studies (Myatt & Waddell, 1990; Borg & Stranahan 2002; Baqamery, Lasik & Nixon, 2005). In both regressions, the NZ coefficient had a positive sign, indicating that New Zealand students performed better than permanent residents and overseas students. This may be because some permanent residents and overseas students suffer language or/and cultural barriers. In the first regression (all students), holding other variables constant, the final mark of New Zealand students was 5.1 percent higher than that of overseas students.
17
Is ECON100 Compulsory or Elective? The COMP coefficient had a negative sign in both regression and was significant at the 5% level. In the first regression (all students), the final mark of a student for whom ECON100 was a compulsory paper was 8.5 percent lower than that of a student for whom ECON100 was an elective paper. One possible explanation is that students who choose to take ECON100 based on their interest in economics put more effort into the paper or are more able. Difference between Semesters ECON100 is taught in both A and B semester in 2005. Exams and assessment items were very similar in both semesters, bu they were taught by different lecturers. The coefficients of variable A had a negative sign and were significant at the 10% level. Holding other variables constant, the final mark of a student enrolled in B semester was about 3 percent higher than that of one enrolled in A semester in both regressions. Number, Type and Quality of NCEA Level 3 Credits It was found that performance in ECON100 was positively and significantly related to the number of approved NCEA level 3 credits (L3C). In both regressions the coefficients for L3C were significant at the 1% level. In the first regression (all students), holding other variables constant, if a student increases his/her approved NCEA level 3 credits by 10 units, his/her final mark in ECON100 would increase by 3.6 percent. In the second regression (students with at least one L3 economics credit), the effect of an increase of approved NCEA level 3 credits by 10 units was a 2.1 percent increase in a student’s final mark in ECON100. The second regression only included students who had at least one economics credit. This reduced the bias caused by students who did not take economic in high school but had high marks in ECON100. Most NCEA level 3 economics topics are covered in ECON100, hence a strong and positive relationship between students’ performance in ECON100 and approved NCEA economics level 3 credits was expected. The regression results confirmed this relationship. The coefficient of ECQ was significant at the 1% level in the first regression. Holding other variables constant, a student’s ECON100 final mark increased by 1 percent if his/her ECQ increases by 10 units. In the second regression (students with at least one L3 economics credit) the effect of ECQ on final marks was 2 percent per 10 units of ECQ. In both regressions, the coefficients for MAQ were significant at the 1% level, which indicates that students’ mathematic background is important to their performance in ECON100. Holding other variables constant, an increase of 10 units in MAQ raises the final mark by around 1 percent in both regressions.
18
Conclusions This paper has described the relationship between student performance in an introductory economics paper at the University of Waikato and the quality, type and quantity of NCEA level 3 credits. The analysis is based on data from 212 students who took the course in A or B semester 2005 and gained university entrance based on their achievements at NCEA level 3. A regression model was developed that is able to predict student performance in ECON100 based on a range of independent variables that can be extracted from the information students provide at enrolment. Performance was affected both by variables indicating quality and stock of knowledge (NCEA data) and by other characteristics. The other characteristics affecting performance can be summarised as follows: • New Zealand students gain higher marks than international students (+5 %) • Gender had no significant effect on student performance. • Students who take ECON100 as an elective gain higher marks (+8%) • Students taking the paper in semester B gained higher marks (+3%) NCEA data, including number and type of credits and whether they were achieved, with merit or with excellence, can also be used to predict student performance. Main findings include: • The total number of NCEA level 3 credits (in all approved subjects) is a good predictor of performance in ECON100. ECON100 results are highly correlated with this variable (0.7). • Students who have studied economics at NCEA level 3 and who gain more results with merit of with excellence, perform better in ECON100. • Students who have studied mathematics/statistics at NCEA level 3 and who gain more results with merit of with excellence, perform better in ECON100. • A quality adjusted measure of NCEA level 3 credits in economics and mathematics/statistics provides a better indication of student performance compared to a simple count of the number of credits achieved. NCEA provides far more information on student achievement than was provided under the old bursary system. However it provides less information that enables the easy identification of ‘top students’. A quality adjusted measure of number of credits achieved is better at identifying students who will perform well, but is still inferior to the old measure e.g. ‘percentage mark in bursary economics’. The accuracy of the quality adjusted measure is affected by the incentives faced by schools and students. Some schools encourage students to take achievement standards, while others favour unit standards (where merit and excellence cannot be achieved). There is also considerable variation in the number of different standards (and hence potential number of credits) offered to students. There is anecdotal evidence that factors associated with the design and implementation of NCEA may discourage able students from attempting to achieve standards with credit or with excellence. The NCEA system is still young and continues to be developed and refined. If employers or universities make more use of data on achievement ‘with merit’ and ‘with excellence’, in selecting top students, then this will provide a strong incentive to schools and students to try to achieve these standards. 19
References Arias, J. J & Walker, Douglas M., (2004). Additional Evidence on the Relationship between Class Size and Student Performance. Journal of Economic Education, 35, (4), 311-329. Bagamery, Bruce D, Lasik, John J & Nixon, Don R., (2005). Determinants of Success on the ETS Business Major Field Exam. Journal of Education for Business. 81, (1), 55-64. Ballard, Charles L. & Johnson, Marianne F, (2004). Basic Math Skills and Performance in an Introductory Economics Class. Journal of Economic Education, 35, (1), 3-24. Borg, Mary O’Malley & Stranahan, Harriet, (2002). The Effect of Gender and Race on Student Performance in Principles of Economics.Applied Economics, 34, (5) Didia, Dal & Hasnat Baban, (1998). The Determinants of performance in the University Introductory Finance Course. Journal of Financial Practice and Education, 8, (1), 102-107. Jaggia, Sanjiv & Kelly-Havke, Alison, (1999). An Analysis of the Factors That Influence Student Performance: A Fresh Approach to An Old Debate. Contemporary Economic Policy, 17, (2), 189-198. Lopus, Jane S. & Maxwell, Nan L., (1994). Beyond High School: Does the High School Economics Curriculum Make a Difference? American Economist, 38, (1), 62-69. Myatt, Anthony & Waddell, Charles, (1990). An Approach to Testing the Effectiveness of the Teaching and Learning of Economics in High School. Journal of Economic Education, 21, (3), 355-363. New Zealand Qualification Authority, (2002). Two Qualifications for the Work of One. Retrieved January 9, 2006, from New Zealand Qualification Authority Website: http://www.nzqa.govt.nz New Zealand Qualification Authority, (2004). How Grade Averages Are Calculated. Retrieved March 7, 2006, from New Zealand Qualification Authority Website: www.nzqa.govt.nz/ncea/results/gradeaverages.html New Zealand Qualification Authority, (2005). NCEA Level 3 Economics. Retrieved December 3, 2005, from New Zealand Qualification Authority Website: http://www.nzqa.govt.nz/ncea/assessment/ New Zealand Qualification Authority, (n.d.). Secondary School Qualifications – A Guide for Students. [Brochure]. Wellington: New Zealand Qualification Authority. New Zealand Qualification Authority, (n.d.). Secondary School Qualifications Today. [Brochure]. New Zealand Qualification Authority. Reid, Roger, (1983). A Note on the Environment as a Factor Affecting Student Performance in Principles of Economics. Journal of Economic Education, 14, (4), 18-22. Stock, James H. & Watson, Mark W., (2003). Introduction to Econometrics. Boston: Addison Wesley. Waikato Management School, (2006). ECON100-Business Economics and the New Zealand Economy. Retrieved June 6, 2006, from Waikato Management School Website: https://www.mngt.waikato.ac.nz/education/papers 20