Journal of Experimental Psychology: Learning, Memory, and Cognition 2010, Vol. 36, No. 1, 37–53
© 2010 American Psychological Association 0278-7393/10/$12.00 DOI: 10.1037/a0017683
Thinking About the Weather: How Display Salience and Knowledge Affect Performance in a Graphic Inference Task Mary Hegarty and Matt S. Canham
Sara I. Fabrikant
University of California, Santa Barbara
University of Zurich
Three experiments examined how bottom-up and top-down processes interact when people view and make inferences from complex visual displays (weather maps). Bottom-up effects of display design were investigated by manipulating the relative visual salience of task-relevant and task-irrelevant information across different maps. Top-down effects of domain knowledge were investigated by examining performance and eye fixations before and after participants learned relevant meteorological principles. Map design and knowledge interacted such that salience had no effect on performance before participants learned the meteorological principles; however, after learning, participants were more accurate if they viewed maps that made task-relevant information more visually salient. Effects of display design on task performance were somewhat dissociated from effects of display design on eye fixations. The results support a model in which eye fixations are directed primarily by top-down factors (task and domain knowledge). They suggest that good display design facilitates performance not just by guiding where viewers look in a complex display but also by facilitating processing of the visual features that represent task-relevant information at a given display location. Keywords: graphics comprehension, eye fixations, attention, inference, display design
display design and knowledge interact in graphical comprehension.
Suppose you are about to travel to San Francisco and consult a weather map to decide which clothes to pack. When you first view the map, is your attention guided by knowledge of the location of San Francisco, or is it automatically grabbed by prominent features, such as a bright red area of particularly hot temperature over Arizona? Recent developments in scientific and information visualization make it easy to create complex visual displays, such as weather maps, in which multiple visual variables are superimposed on the same space (Card, Mackinlay, & Schneiderman, 1999; J. J. Thomas & Cook, 2005). Yet, perhaps one of the most fundamental facts about human cognition is that attention is capacity limited, such that objects in the world, or in a visual display, compete for our attention (e.g., Desimone & Duncan, 1995). In this situation, how is the selection of goal-relevant information influenced conjointly by the design of the display and by knowledge? In this article, we examine effects of display design and domain knowledge on a graphical comprehension task in which people make inferences from maps. We demonstrate that display design has significant effects on graphical comprehension and show that display effects interact with knowledge. We examine patterns of task performance and eye fixations to elucidate models of how
Perception and Comprehension of Visuo-Spatial Displays Our research is informed by, yet differs from, two different research traditions concerned with how people perceive and comprehend visuo-spatial displays: research on scene perception (Henderson & Ferreira, 2004) and research on comprehension of graphical displays (Shah, Freedman, & Vekiri, 2005). Recent research on scene perception has examined the extent to which overt attention to scenes, as revealed by eye fixations, is influenced by stimulus factors, such as visual salience (bottom-up influences) or the viewer’s goals and knowledge (top-down influences). Effects of stimulus factors are studied by allowing free viewing of a scene and then analyzing the visual properties of regions that receive the most fixations (Parkhurst, Law, & Niebur, 2002; Tatler, Baddeley, & Gilchrist, 2006); these effects are also studied by developing computational models of visual salience based on known properties of the visual system and by examining how the salience of different regions of a scene predicts eye fixations (Itti & Koch, 2000). Although some studies found that people fixate more on salient regions of simple displays (e.g., displays showing one red target among green distractors) and fixate on salient regions of scenes when viewers are not given a specific task to perform (Itti & Koch, 2000; Parkhurst et al., 2002), more recent studies have suggested that this influence is relatively weak (e.g., Tatler et al., 2006), and salience is not predictive of eye fixations on more meaningful displays when the viewer is given a specific task, such as visual search (Foulsham & Underwood, 2007; Henderson, Brockmole, Castelhano, & Mack, 2007; Underwood & Foulsham, 2006).
Mary Hegarty and Matt S. Canham, Department of Psychology, University of California, Santa Barbara; Sara I. Fabrikant, Department of Geography, University of Zurich, Zurich, Switzerland. This research was funded by Office of Naval Research Grants N000140310119 and N000140610163. We thank Tiffany Werner for assistance with data collection and coding; Jerome Tietz for assistance with the eye tracking analysis; and Alinda Friedman, Peter Hegarty, and Rich Mayer for comments on an earlier version of the article. Correspondence concerning this article should be addressed to Mary Hegarty, Department of Psychology, University of California, Santa Barbara, Santa Barbara, CA 93106. E-mail:
[email protected] 37
38
HEGARTY, CANHAM, AND FABRIKANT
When participants are shown pictures of meaningful scenes, eye fixations are primarily directed by (a) top-down influences, such as long- and short-term episodic and semantic knowledge of the scene being viewed (e.g., Friedman, 1979; Hollingworth & Henderson, 2003); (b) scene schema knowledge, such as where different objects are likely to be in the scene (e.g., Biederman, Mezzanotte, & Rabinowitz, 1982); and (c) task-related knowledge (Henderson, 2003). Moreover, when performing everyday activities with real objects, eye fixations are highly task directed. People depend on visually accessing the external world as needed by their current task (Hayhoe, Bensinger, & Ballard, 1997; Land & Hayhoe, 2001) and, importantly for the present context, their eye fixations are not significantly affected by visual salience (Rothkopf, Ballard, & Hayhoe, 2007; Turano, Geruschat, & Baker, 2003). Domain knowledge and skill also affect scanning behavior. For example, expert drivers scan the road more widely than novices, especially on roads with more lanes and traffic; trained police drivers show this effect even more than other experienced drivers (Underwood, 2007), and novices can be induced to scan more widely with a brief training intervention (Chapman, Underwood, & Roberts, 2002). In this article, we examine how bottom-up influences of salience and top-down influences of task and domain knowledge affect comprehension of weather map displays. Several inherent differences between graphic displays, such as weather maps and pictures of scenes (or views of the real environment), suggest that results in the scene perception literature cannot necessarily be generalized to graphics comprehension. First, in contrast to scenes, graphic displays are symbolic representations in which visual variables, such as color and line orientation, can represent any measureable variable (whether visible or invisible). Second, whereas scenes display objects at human scale (cf. Henderson & Ferreira, 2004), that is, the scale at which we view objects in the real world, graphics can display objects at scales that we do not normally encounter (e.g., a continent or a molecule). Third, each location in a scene is either empty or contains a single object; however, in a graphic display (such as the weather maps studied here), multiple visual variables (color, line orientation) representing different conceptual variables (e.g., temperature, pressure) can be displayed at each location. Objects in scenes are certainly multidimensional, but the dimensions are not normally in conflict with respect to the task at hand. In contrast, for graphic displays, task performance often involves selecting between task-relevant and task-irrelevant variables at the same location in space. Fourth, the tasks performed with graphic displays are often quite complex, involving reasoning and problem solving, so that research on graphics comprehension affords an opportunity to study the effects of visual display attributes on more complex tasks than visual search, in which performance is usually accurate. Current models of graphics comprehension propose the following three component processes in understanding a graphical display, such as a map (Bertin, 1983; Carpenter & Shah, 1998; Herrmann & Pickle, 1996; Pinker, 1990). First, users must encode the visual features of the display (e.g., areas of different colors). Next, they must map these onto the conceptual relationships that they convey (e.g., color indicates temperature). Finally, they need to relate these conceptual relationships to the referents of the graphs (e.g., a patch of red covering a portion of Arizona indicates that the temperature there is in the 90s). These current models
propose that graphics comprehension, like scene perception, involves an interaction between bottom-up perceptual processes that encode information from the display and top-down processes that apply graph schemas and domain knowledge to the task at hand. However, because of their inherent differences, maps may not invoke the same processes that scenes do. Different ways of displaying the same information can dramatically affect problem-solving performance (Larkin & Simon, 1987; Zhang & Norman, 1994). In graph comprehension, people interpret the same data differently, depending on (a) whether they are presented in pie charts or bar graphs (Simkin & Hastie, 1986), (b) whether they are presented in bar graphs or line graphs (Shah, Mayer, & Hegarty, 1999), and (c) which variables are assigned to the x- and y-axes (Gattis & Holyoak, 1996; Peebles & Cheng, 2003; Shah & Carpenter, 1995). In map comprehension, different color or intensity values make the different variables displayed on the map more or less visually distinct (Yeh & Wickens, 2001). Display format can also affect problem solving with more abstract relational graphics (Novick & Catley, 2007) or even equations (Landy & Goldstone, 2007). These studies all provide evidence for bottom-up influences of display format on task performance. In addition to bottom-up information, performance with graphical displays is also influenced by knowledge. Skill acquisition facilitates the ability to focus on task-relevant information while ignoring irrelevant information (Haider & Frensch, 1996, 1999) so that experts attend to thematically relevant aspects of displays regardless of their visual salience, whereas novices’ attention is captured by the most salient features of displays (Lowe, 1993, 1994, 1996). Experts in chess have a perceptual encoding advantage when looking at chessboards, such that their visual spans are larger (Reingold, Charness, Pomplun, & Stampe, 2001). Displaybased problem solving is also enhanced by knowledge of graphic conventions, for example conventional mappings between visual variables and conceptual variables (color indicates temperature) or knowledge that a given mapping will be indicated by the axes labels and legend (Shah et al., 2005). This conventional knowledge has been referred to as a graph schema (Pinker, 1990; Ratwani & Trafton, 2008). Although there is no doubt that graphics comprehension is influenced by both knowledge and display format, our understanding of graphics comprehension is limited in several ways. First, there is less certainty about “the precise mechanisms by which prior knowledge and display characteristics are integrated” (Shah et al., 2005, p. 461). Pinker (1990) has suggested that initial perception of a graphic is a bottom-up process of constructing a visual representation of the display (the visual array). In his model, top-down processes, such as the application of graph schemas and answering specific questions, occur later in comprehension and operate on propositional representations that are derived from this visual array representation. In contrast, Freedman and Shah (2002) proposed a more interactionist account in which initial encoding of visual chunks from the external display automatically activates domain knowledge and expectations, which can even cause people to “see” what they expect rather than what is shown. Second, models of graphics comprehension have been applied primarily to comprehension of relatively simple displays, such as bar or line graphs showing two or three variables and fewer than a dozen data points (Carpenter & Shah, 1998; Simkin & Hastie, 1986). In these cases, it is plausible for viewers to attend to all the
COMPREHENSION OF COMPLEX VISUAL DISPLAYS
39
information in the graphic during the time allotted. As a result, the models are generally vague about the processes by which information in complex visual displays is attentionally selected (Lewandowsky & Behrens, 1999); for example, the extent to which this selection is determined by visual properties of the display or by knowledge of the task, domain, or graphic conventions. To date, research on graphics comprehension has focused more on how top-down and bottom-up factors affect performance (e.g., accuracy) than how they affect eye fixations. Preliminary eye tracking studies suggest that eye fixations are primarily directed by the viewer’s task and graph schemas (Carpenter & Shah, 1998; Lohse, 1993; Peebles & Cheng, 2003), but studies with more complex displays are needed. Third, most previous studies of graphics comprehension have been limited to simple tasks in which people read off values from the graph or described trends in the displayed data, so they cannot address situations in which new information must be inferred from the information shown in the display, as pointed out by Trafton and Trickett (2001; Trickett & Trafton, 2006). Studying inference from graphics raises questions of what knowledge is required to be able to make an inference from a complex graphic or to selectively attend to the relevant information therein. In this article, we test a specific principle of display design from cartographic theories (Bertin, 1983; Dent, 1999), which we refer to as the salience principle. Specifically, cartographic theories suggest that the visual variables (e.g., color, line orientation) that represent different variables in the data (e.g., temperature, wind direction) should be ordered so that important thematic information is visually salient. This principle is echoed in cognitive analyses of visual displays. Pinker (1990) has proposed that visual salience is an important determinant of what is eventually encoded from a graphical display. Similarly, Kosslyn (1989) has prescribed that in designing a graphic, visual information that results in a large contrast difference with surrounding areas will automatically draw attention and should therefore be used to depict the most important information. Interestingly, although principles such as this are widely held by cartographers, cognitive scientists, and designers, they have received very little empirical testing (MacEachren, 1995). Thus, it is an open question whether the salience principle will stand up to empirical test.
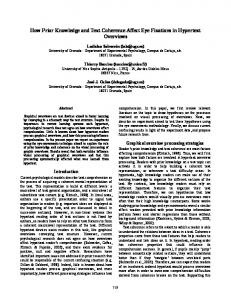
mation (see, e.g., Figure 1). We used weather maps as stimuli because they are familiar from everyday life and are frequently used to make inferences (i.e., predict the weather). In the experimental trials, an arrow on the map indicated a possible direction of wind in one region (see Figure 1). The task was to judge whether this arrow showed the actual direction in which the wind would be blowing in that region. Wind direction can be inferred from knowledge of the pattern of surface pressure in an area, shown by black lines indicating locations of equal pressure (isobars) in the map. Wind direction is unrelated to temperature, shown by color. Thus, pressure is task-relevant, and temperature is task-irrelevant. Moreover, the wind direction in an area is most influenced by the closest pressure systems (centers of high or low pressure), so that the most relevant locations to look on a weather map when inferring the wind direction in a region are the pressure systems closest to that region. Inferring wind direction from the surface pressure in an area is based on two meteorological principles: the pressure gradient principle and the Coriolis phenomenon. Because of the combination of these principles, and because of friction at the surface of the earth, air moves clockwise and outward around high-pressure areas and counterclockwise and inward around lowpressure areas. Therefore, the arrows in Figure 1 are correct because they point in a counterclockwise direction and slightly inward relative to their adjacent low-pressure systems. An informal task analysis of efficient performance of the wind inference task is summarized in Figure 2. The first step is to locate the arrow in the display because the task is to verify the direction of the arrow. The next steps are to locate the closest pressure system(s) to the arrow indicated by the concentric black isobar circles (Step 2) and encode whether they are high- or low-pressure systems, indicated by the “H” or “L” symbols at their centers (Step 3). Next, the problem solver has to encode the angle of the isobars in the region of the arrow. Fifth, the solver has to encode the angle of the arrow relative to these isobars. Sixth, he or she has to activate relevant knowledge to infer how wind should be flowing in the target area (from the encoded information about pressure). Finally, the problem solver can compare the inferred direction of wind to that shown by the arrow and respond. Although we describe the steps in order, task performance may involve going back and forth between these steps.
The Experimental Task
Overview of Experiments and Predictions
In our experiments, participants viewed weather maps of North America displaying superimposed pressure and temperature infor-
In three experiments, we examined how the relative visual salience of task-relevant information (pressure) versus task-
Figure 1.
Examples of (a) a temperature-salient map and (b) a pressure-salient map in Experiment 1.
40
HEGARTY, CANHAM, AND FABRIKANT
Figure 2. Informal task analysis of the wind inference task. In the case of each process, the information source (whether display or knowledge) and the location of eye fixations (part of display inspected, if relevant) are specified.
irrelevant information (temperature) across different weather maps affected participants’ eye fixations on the maps and their performance of the wind inference task. Participants performed the task before and after receiving instruction in meteorology, which provided the declarative knowledge necessary to infer wind direction from pressure but did not teach a procedure for how to do the task (see Canham & Hegarty, in press). In Experiment 1, we manipulated the salience of different variables across different displays, as verified by a manipulation check. In Experiment 2, we manipulated the salience of both variables and locations in the displays, as verified by a computational model of visual salience. Finally, in Experiment 3, we independently manipulated the displays viewed before and after participants learned the meteorological principles. If eye fixations are directed by top-down influences, the task requirements should induce participants to view the arrow both before and after meteorology instruction (because the task is to verify the direction of the arrow), and knowledge of the meteorology principles should induce participants to spend more time viewing the pressure systems and less time viewing the temperature scale1 after meteorology instruction. A previous study that used this paradigm has established that accuracy on the wind
inference task increases as a result of acquiring task-relevant declarative knowledge (Canham & Hegarty, in press). The salience principle predicts that performance will also be enhanced when the task-relevant information (pressure) is relatively more visually salient in the display and when task-irrelevant information (temperature) is relatively less salient (Bertin, 1983;
1
Note that when participants are looking at a location within the map of North America, it is not possible to tell whether they are attending to the pressure information or the temperature information at that location. However, fixations on the temperature scale unambiguously indicate that a participant is attending to temperature. Although the temperature scale is at the periphery of the display, this is typical of map legends, and it is therefore part of the map schema to know that one should look for this information in the periphery of the display. Furthermore, one might argue that viewing of the temperature scale might not be necessary because of common conventions to show warm temperatures in red, cold temperatures in blue, and so forth. However, our data indicate that participants did in fact view it; furthermore, in this research, we are less interested in the absolute amount of time spent viewing the temperature scale than in differences in the time spent viewing the scale in the different experimental conditions.
COMPREHENSION OF COMPLEX VISUAL DISPLAYS
Dent, 1999; Kosslyn, 1989). We propose two possible accounts of how the salience principle might work in the wind inference task. One account (the spatial selection hypothesis) proposes that salience affects performance by guiding where the viewer looks in the display. The other account (the feature selection hypothesis) proposes that salience affects performance by influencing what visual features a person attends to at a given location. The accounts also differ in the relative importance of display salience versus knowledge in directing gaze to the task-relevant locations of the weather maps, with the spatial selection hypothesis proposing a greater role for display salience in directing gaze. The spatial selection hypothesis proposes that making the taskrelevant information in a display visually salient enhances performance by guiding viewers’ gaze to the task-relevant locations (i.e., Steps 1 and 2 of the model in Figure 2). According to this hypothesis, directing gaze is the primary mechanism by which salience enhances task performance, so that effects of salience on task performance should be correlated with effects of salience on eye fixations. A recent study supports the plausibility of this hypothesis. Grant and Spivey (2003) challenged participants with Duncker’s (1945) classic tumor problem, which they solved while viewing a simple diagram of an outline of a person’s body with the tumor inside. Successful problem solvers made more eye fixations on the outline of the body (the skin) compared with unsuccessful solvers. In a later experiment, people were more likely to solve the problem when shown a display in which the skin was made more visually salient by animating it. Grant and Spivey argued that making the relevant information visually salient literally led the eyes to the task-relevant information. The feature selection hypothesis proposes that making taskrelevant information visually salient facilitates the process of filtering task-relevant from task-irrelevant information at a given location in the display. The plausibility of this hypothesis is supported by research indicating that attention can be directed selectively to visual features or to different objects at the same location in space (Desimone & Duncan, 1995; Rock & Gutman, 1981; Triesman & Gelade, 1980; Vecera & Farah, 1994). This type of selective attention is necessary in our map displays because there is both pressure information and temperature information at each location of the map, but only the pressure information is task relevant. If visual attention is viewed as a set of competitive interactions between different features or objects in the visual field (Desimone & Duncan, 1995), making the task-relevant visual features salient may give them a competitive advantage and therefore increase the efficiency of processing of the task-relevant information and reduce the need to actively suppress taskirrelevant features. In summary, according to the spatial selection hypothesis, visual salience of the task-relevant information affects performance by drawing attention, and the eyes, to the task-relevant locations and should be reflected in earlier fixations and a greater proportion of eye fixations on the task-relevant locations. According to the feature selection account, salience affects performance by influencing what visual features a person attends to at a given location, and enhancement of performance by display salience might not be reflected in different patterns of eye movements. For example, the feature selection account allows for the possibility that two participants might be looking at the same region of a map; however, the participant viewing a map in which pressure is salient might be
41
attending to the pressure isobars in that region of the map, whereas the participant viewing a map in which temperature is salient might be attending more to the colors showing temperature at that location. Of course, it is possible that salience affects performance in both of these ways. If this is true, some aspects of eye fixations may be affected by salience, but enhancement of performance by display salience does not necessarily need to be reflected in different patterns of eye fixations. Moreover, salience might have greater effects on the locations of eye fixations when people have less domain knowledge to guide their search for relevant information (in our experiment, before instruction on the meteorology principles) than when they have more knowledge (after instruction).
Experiment 1 Method Participants. Forty students in an introductory psychology class at the University of California, Santa Barbara, participated. None of the participants had prior formal training in meteorology or atmospheric sciences. Twenty were randomly assigned to the each of the two conditions. Design. The experiment had a 2 ⫻ 2 ⫻ 3 design with type of map (pressure-salient, temperature-salient) as a between-subjects variable, performance before and after learning as a withinsubjects variable, and arrow type (correct, pressure, or opposite) as a within-subjects variable. Materials. The materials used in Experiment 1 consisted of the following. Experimental images. We created the weather maps using the Environmental Systems Research Institute (ESRI) ArcMap from actual data from the National Oceanic and Atmospheric Administration’s hourly National Centers for Environmental Prediction (NCEP)/National Center for Atmospheric Research (NCAR) reanalysis data composites for 10 different dates in the last 10 years. The displays consisted of full color weather maps including temperature and surface pressure. In one version of the 10 weather maps (the “pressure-salient” maps), the task-relevant information (pressure) was shown by thick black isobar lines, and the task-irrelevant information (temperature) was shown in muted colors (see the example in Figure 1b). In the other version—the “temperature-salient” maps—the task-relevant isobar lines were narrower, and the task-irrelevant information (temperature) was indicated by brighter, more saturated colors (see Figure 1a). As a manipulation check, we gave both versions of the 10 maps to a group of 16 students who did not participate in these experiments and asked them to indicate on a scale ranging from 1 to 5 how much the pressure and temperature information “stood out” on each map. A score of 5 indicated that the information stood out a lot, and a score of 1 indicated that it was barely noticeable. Across the 10 pressure-salient maps, they rated the pressure information as 4.71 (SD ⫽ 0.18) and the temperature information as 2.16 (SD ⫽ 0.41), t(15) ⫽ 21.67, p ⬍ .001. Across the 10 temperature-salient maps, they rated the pressure information as 2.01 (SD ⫽ 0.53) and the temperature information as 4.57 (SD ⫽ 0.26), t(15) ⫽ ⫺16.93, p ⬍ .001. Each map contained one of three types of target arrow (each of the 10 maps was shown with each of the three arrow types for a
42
HEGARTY, CANHAM, AND FABRIKANT
total of 30 trials, which were viewed both before and after instruction). Correct arrows were consistent with the predicted direction of surface winds (angling 20° inward and in a counterclockwise direction for a low-pressure system and 20° outward and clockwise for a high-pressure system). Opposite arrows indicated exactly the opposite direction to the correct arrows. Pressure gradient arrows pointed directly into a low-pressure area or directly out of a high-pressure area. Pressure gradient arrows were also incorrect as they accounted for the pressure differential principle but did not take account of the Coriolis effect.2 Meteorology tutorial. An instructional presentation was adapted from the description of the pressure gradient and Coriolis principles in the Weather World 2010 Project online tutorial (University of Illinois, 2000). It explained how these factors influence wind movement, and it provided three examples of arrow verification trials with feedback (see Canham & Hegarty, in press). Knowledge of Principles Questionnaire. A questionnaire was used to assess participants’ knowledge of the meteorological principles after they studied the tutorial. This included two verbal multiple choice questions about the pressure gradient and Coriolis principles and two questions in which participants responded by drawing arrows indicating the wind directions on diagrams. Apparatus. Participants viewed images presented on a computer screen while resting their chins on a chin rest, set 30 in. (76.2 cm) from a 19-in. (48.26-cm) monitor. The screen resolution was set to 800 ⫻ 600 screen pixels, with a refresh rate of 75 Hz. We monitored eye movements using an SMI EyeLink I head-mounted, eye-tracking system, which was spatially accurate to within 0.5° and had a sampling rate of 250 Hz. An eye movement was classified as a saccade if acceleration exceeded of 9,500°/s2 and velocity exceeded 30°/s. A nine-point display was used for calibration and validation prior to the beginning of each block of trials. Procedure. A preliminary calibration of the eye tracker was performed. Then participants were shown examples of the weather maps, familiarized with their graphic conventions (e.g., the use of color to show temperature and black lines to show isobars, i.e., lines of equal pressure), and given instructions for the experimental task. On each trial, they saw a weather map, with an arrow indicating the possible wind direction at one location on the map. The task was to determine whether the arrow showed the correct (true) or the incorrect (false) wind direction. After six practice trials (without feedback), the participants completed the first block of 30 trials using a button box to indicate their responses. Between trials, an asterisk was shown in the center of the screen, and the next trial was not initiated until the tracker detected that the participant was viewing the asterisk. Then participants were shown the meteorology tutorial, which they studied at their own pace. Next, they completed the Knowledge of Principles Questionnaire to assess how well they had learned the pressure-gradient and Coriolis principles, and they were given feedback on their answers. If a participant missed any of the Knowledge of Principles Questionnaire questions, he or she was asked to review the presentation to find the correct answer. Then participants were given three practice problems, received feedback on their answers, and were allowed the opportunity to ask questions again. Finally, the eye tracker was recalibrated, and the participants repeated the same set of 30 trials. Coding of eye fixations. To analyze the eye fixations, we defined areas of interest on the maps that were either relevant or
irrelevant to inferring the wind direction. The first relevant area on each map was a circular region containing the arrow to be verified, with a diameter of 50 pixels (1.8° of visual angle) corresponding to 0.4% of the area of the display. The second and third relevant areas corresponded to the two closest pressure systems to the arrow, and each was a circular region centered on the “H” or “L” in the center of the pressure system with a diameter of 100 pixels (3.5° of visual angle; 1.6% of the area of the display). The final area analyzed was the temperature legend, which was a rectangular region of 100 ⫻ 600 pixels and took up 12.5% of the area of the display. This was irrelevant, as wind direction does not depend on temperature. We measured the time prior to the first fixations on the taskrelevant areas, the number of fixations, and the amount of time in each of the regions of interest. Measures of the number of fixations and the amount of time were highly correlated (minimum correlation ⫽ .81, median correlation ⫽ .90 across all variables computed) and showed the same patterns, so we only report the analyses for total fixation duration. Because response time was quite variable across participants and trials, fixation time on the different areas of interest was expressed as a proportion of total fixation time (Cohen, Cohen, West, & Aiken, 2003). To correct for the number of dependent measures, we adopted an alpha level of .01 (Bonferroni correction). Two participants (one in each experimental group) were dropped from the eye fixation analyses because of poor calibration of the eye tracker.
Results and Discussion Knowledge of Principles Questionnaire. The pressuresalient and temperature-salient experimental groups performed similarly on the four-item test of meteorological principles (Ms ⫽ 2.80 and 2.95, respectively), t(38) ⫽ 0.50, p ⫽ .62. Response times. Individual trials with response times of more than three standard deviations from the mean (3.3% of trials) were not included in either the response time or eye fixation analyses. Mean response times were shorter (5.16 s, SD ⫽ 2.65) before instruction in meteorology compared with after instruction (6.11 s, SD ⫽ 2.38), F(1, 38) ⫽ 7.02, p ⬍ .05, 2p ⫽ .15 (see Table 1), most likely because some participants simply guessed before learning. Map type did not significantly affect response times, and there was not a significant interaction between map type and learning. Effects of knowledge and display design on accuracy. We predicted that accuracy on the wind inference task would improve as a result of instruction in meteorology and that accuracy would be higher with the pressure-salient maps, because of the salience principle. The measure of performance was the proportion of trials 2
In all three experiments, there were significant differences in accuracy and response times between the different arrow trials, such that performance on the pressure-only arrow was less accurate after instruction, and trials involving the opposite arrow took less time after participants had learned the meteorological principles. These results probably reflect the fact that the opposite arrow can be rejected by considering the pressure differential principle alone, but judging the correct and pressure-only arrows involves considering both meteorological principles. We do not discuss these results further, as they are not central to the main theoretical concerns in this article.
COMPREHENSION OF COMPLEX VISUAL DISPLAYS
on which the correct response was given (i.e., the response was “true” for the correct trials and “false” for the opposite and pressure gradient arrows). As predicted, performance improved from before instruction (M ⫽ 0.50, SD ⫽ 0.09) to after instruction (M ⫽ 0.72, SD ⫽ 0.15), F(1, 38) ⫽ 66.13, p ⬍ .001, 2p ⫽ .64 (see Figure 3). The main effect of map type was not significant, F(1, 38) ⫽ 1.80, p ⫽ .19. Critically, there was a significant interaction of map type with instruction, F(1, 38) ⫽ 5.51, p ⬍ .05, 2p ⫽ .13. Consistent with the salience principle, the pressure-salient group was more accurate than the temperature-salient group, F(1, 38) ⫽ 4.44, p ⬍ .05, 2p ⫽ .11, after instruction in meteorology, whereas there was no difference between the groups before instruction, F(1, 38) ⫽ 0.59, p ⫽ .45, when performance was close to chance (see Figure 3).3 Effects of knowledge and display design on eye fixations. If eye fixations are guided by the salience of variables in a display, participants who received pressure-salient maps should view the pressure systems earlier, spend more time viewing these systems, and spend less time viewing the temperature scale compared with those who received temperature-salient maps, even before they are instructed about the relevance of the different variables. In contrast, if eye fixations are directed by task and domain knowledge, participants should look primarily at the arrow and its closest pressure systems regardless of which maps they received, time spent viewing the pressure systems should increase after meteorology instruction, and time spent viewing the temperature scale should decrease after instruction. Figure 4 shows the locations of the eye fixations of all participants in each group on a sample pressure-salient map and the corresponding temperature-salient map before and after instruction. It can be seen that a large proportion of eye fixations were close to the arrow and its closest pressure systems, particularly after instruction. This pattern was typical. Across all trials, participants spent 58% of their time viewing either the arrow or its two closest pressure systems before instruction, and this increased to 77% after instruction, although these areas of interest together occupied less than 4% of the area of the display. Time prior to the first fixation on task-relevant regions. Table 2 shows the mean time prior to the first fixation on the pressure systems and the arrow as a function of map type and Table 1 Mean Response Times in Seconds (Standard Deviations in Parentheses) for the Different Experimental Conditions in the Three Experiments, Before and After Participants Received Instruction in the Meteorological Principles Experiment Experiment 1 Temperature salient Pressure salient Experiment 2 Temperature salient Pressure salient Experiment 3 Temperature salient, temperature salient Temperature salient, pressure salient Pressure salient, temperature salient Pressure salient, pressure salient
Before instruction
After instruction
5.0 (2.5) 5.3 (2.8)
6.3 (2.1) 5.9 (2.6)
3.2 (1.4) 3.0 (1.2)
3.4 (1.3) 3.6 (1.6)
4.2 (1.6) 3.3 (1.1) 3.5 (1.6) 4.1 (2.2)
4.3 (1.1) 3.6 (0.8) 4.6 (1.4) 4.3 (1.7)
43
Figure 3. Mean accuracy before and after instruction (error bars show standard errors) in Experiment 1.
instruction. The closest pressure system to the arrow was fixated sooner on pressure-salient maps than on temperature-salient maps, F(1, 38) ⫽ 5.17, p ⫽ .03, 2p ⫽ .12, and there was a nonsignificant trend for it to be fixated sooner after instruction in meteorology, F(1, 38) ⫽ 3.08, p ⫽ .09. The interaction of these factors was not significant, F(1, 38) ⬍ 1. Neither map type nor instruction had significant effects on time prior to the first fixation on the arrow or the second closest pressure system to this arrow. Proportion of time spent viewing task-relevant regions. As Figure 5 shows, the proportion of time spent viewing the combined task-relevant regions was not significantly affected by map type, F(1, 36) ⬍ 1. However, the time on these regions increased significantly from before to after instruction, F(1, 36) ⫽ 78.03, p ⬍ .001, 2p ⫽ .68. The interaction of map type with instruction approached statistical significance, F(1, 36) ⫽ 3.99, p ⫽ .06. We decomposed time on the relevant regions into time spent viewing the two closest pressure systems and time spent viewing the arrow and analyzed these separately. Note that these regions sometimes partially overlapped, as the closest pressure systems are by definition next to the arrow. Participants should spend more time viewing the pressure systems after instruction, but the task requirements should induce them to view the arrow both before and after instruction. As Figure 5a shows, participants spent a significantly greater proportion of their time viewing the two closest pressure systems to the arrow after meteorology instruction (M ⫽ 0.58, SD ⫽ 0.05) than before instruction (M ⫽ 0.41, SD ⫽ 0.06), F(1, 36) ⫽ 88.52, p ⬍ .001, 2p ⫽ .71. The main effect of map type on this variable was not significant, F(1, 36) ⬍ 1, and the interaction of map and instruction was also not significant, F(1, 36) ⫽ 3.24, p ⬎ .10. In 3 To confirm that the improvement was due to instruction and not merely because of practice, we conducted a control study in which 30 students performed two blocks of the 30 inference trials from Experiment 1 without instruction in between. Sixteen participants viewed the pressure-salient maps, and 14 participants viewed the temperature-salient maps. In all cases, there were no significant effects of practice, map type, or their interaction, F(1, 28) ⬍ 2.3, p ⬎ .10; furthermore, in all cases, performance of the two groups did not significantly differ from chance in either the first or the second block of trials, t(29) ⬍ 1, p ⬎ .30. Therefore, we can conclude that the improvement in performance in Experiment 1 was due to meteorology instruction and not to practice.
44
HEGARTY, CANHAM, AND FABRIKANT
Figure 4. Plots showing the fixations of all participants in each map condition on four different trials: a temperature-salient trial (a) before instruction and (b) after instruction, and a pressure-salient trial (c) before instruction and (d) after instruction.
contrast, as shown in Figure 5b, the proportion of time spent viewing the arrow did not significantly differ as a function of meteorology instruction, F(1, 38) ⫽ 2.60, p ⫽ .12; map type, F(1, 38) ⫽ 1.60, p ⫽ .21; or the interaction of these variables, F(1, 38) ⬍ 1. If display design affects performance primarily by directing participants’ attention to the relevant areas of the display (spatial selection hypothesis), performance after instruction should be related to the relative amount of time spent on these areas. Performance on the inference task after instruction was not significantly related to time spent on the combined relevant areas of the display (r ⫽ ⫺.138). Proportion of time spent viewing task-irrelevant regions. We also examined whether inspection of the task-irrelevant temperature scale was affected by instruction and by visual salience of temperature on the map. Participants viewed the temperature scale on a minority of trials. These data did not meet the normality and homogeneity of variance assumptions of analysis of variance, so they were analyzed with nonparametric statistics. The proportion of time spent on the temperature scale was greater before instruction (M ⫽ 0.05, SD ⫽ 0.08) than after instruction (M ⫽ 0.004, SD ⫽ 0.01; Wilcoxon signed-ranks test, Z ⫽ 4.08, p ⬍ .001). At the level of trials, participants viewed the temperature scale on more trials before instruction (M ⫽ 7.3 of the 30 trials, SD ⫽ 6.48) than after instruction (M ⫽ 1.7 trials, SD ⫽ 2.53; Z ⫽ 3.79, p ⬍ .001). Although the temperature-salient group tended to view the
temperature scale more often than the pressure-salient group (see Figure 4), this effect was not statistically significant either before instruction (Mann–Whitney U ⫽ 132, Z ⫽ 1.46, ns) or after instruction (Mann–Whitney U ⫽ 169, Z ⫽ 0.36, ns). In summary, Experiment 1 provided evidence for the salience principle of graphics design, such that the pressure-salient group performed more accurately than the temperature-salient group. However, display design interacted with knowledge, such that salience affected accuracy only after participants learned the meteorology principles and not before. This experiment also provided preliminary information regarding the mechanisms by which salience affects performance. Participants who received pressuresalient maps viewed the pressure systems earlier, providing some support for the spatial selection hypothesis. However, eye fixations were primarily directed by task and domain knowledge, and there was a dissociation between factors that affected eye fixations and those that affected task accuracy. For example, the pressure-salient group was more accurate than the temperature-salient group after instruction, although the eye fixations of these groups showed very similar patterns at this stage of the experiment. Furthermore, the proportion of time spent on task-relevant regions increased more for the temperature-salient group from before to after instruction (see Figure 5), but task accuracy improved more for the pressuresalient group (see Figure 3). These results argue against spatial selection as the only mechanism by which the salience principle operates. It is possible that visual salience also enhances attention
COMPREHENSION OF COMPLEX VISUAL DISPLAYS
45
to task-relevant visual features and suppression of task-irrelevant features after the eyes have been directed to the task-relevant locations of the display by top-down knowledge of the task and domain (feature-selection hypothesis).
Experiment 2 The effects of display salience on eye fixations were weak in Experiment 1. In interpreting these results, it is important to note that the maps in Experiment 1 were designed to make the different weather variables (pressure and temperature) more or less salient; however, because these variables are shown in all locations of the map, this did not necessarily make the task-relevant locations more or less salient, and it is salient locations that have been shown to influence eye fixations in previous studies (e.g., Itti & Koch, 2000; Parkhurst et al., 2002). In Experiment 2, we replicated Experiment 1 but with a stronger manipulation of map design that amplified differences between pressure-salient and temperature-salient maps and that also made the centers of the pressure systems more salient by enlarging and coloring the “H” and “L” symbols indicating high or low pressure. To ensure that we created maps in which the task-relevant locations differed in objective salience, we used Itti & Koch’s (2000) salience model to guide the design of the displays. This model considers three component visual features of a visual display: color, intensity, and orientation. Values for each of these features are computed independently, and a feature map is calculated comparing both local and global differences. The feature maps for the different features are then combined to produce a single salience map for the whole image. This salience map is the basis for
Table 2 Mean Time (in Milliseconds) Prior to the First Fixations on the Arrow and Its Closest Pressure Systems Before and After Learning the Relevant Meteorological Principles in Experiments 1 and 2 Area of interest
Before instruction
Experiment 1 Arrow Temperature salient 945 (367) Pressure salient 1,143 (481) Closest pressure system Temperature salient 832 (321) Pressure salient 678 (197) Second closest pressure system Temperature salient 1,462 (942) Pressure salient 1,201 (497) Experiment 2 Arrow Temperature salient 892 (368) Pressure salient 622 (154) Closest pressure system Temperature salient 781 (399) Pressure salient 534 (132) Second closest pressure system Temperature salient 1,068 (753) Pressure salient 913 (376) Note. Standard deviations are shown in parentheses.
After instruction
876 (379) 979 (365) 728 (187) 632 (147) 1,520 (598) 1,170 (568)
681 (204) 652 (218) 617 (121) 485 (110) 1,082 (419) 989 (470)
Figure 5. Mean proportion of fixation time on (a) the closest pressure system and (b) the arrow, before and after meteorology instruction in Experiment 1. Error bars show standard errors.
predictions about the locations of fixations on a display, assuming that viewers fixate the most salient regions of the display, which in this model are defined as regions that differ maximally from their neighboring regions on the analyzed visual features. To redesign the pressure-salient maps, we applied cartographic principles (Bertin, 1983) to make the temperature colors less saturated, to make the pressure systems more salient by adding color to the H and L symbols at their centers, and to make these symbols larger (see Fabrikant & Goldsberry, 2005). We iteratively applied these principles and tested the resulting maps by applying the salience model until the arrow and pressure systems were identified as the most salient display regions by the model. Figure 6c shows an example of one of the redesigned maps and indicates the four most salient regions identified by the salience model for this map, which are the task-relevant regions.4 We also applied the salience model to the two versions of the maps used in Experiment 1. Note that the four most salient regions for these maps (see the examples in Figures 6a and 6b) are not task-relevant regions and that in fact the same four regions are identified as salient in the two maps. We reasoned that if our redesign of the pressure-salient maps for Experiment 2 had made the task-relevant areas more salient, the distance between the salient and relevant regions should be shorter for these redesigned pressuresalient maps (see, e.g., Figure 6c). As Table 3 shows, for all comparisons, the distance between task-relevant and salient areas for these 4 Choice of four salient areas in this analysis is somewhat arbitrary; however, this is based on the fact that we defined four regions of interest in our analyses of task-relevant and task-irrelevant areas (i.e., the two relevant pressure systems, the wind direction arrow, and the irrelevant temperature scale).
HEGARTY, CANHAM, AND FABRIKANT
46
Figure 6. Predicted locations of the first four fixations (i.e., four most salient regions of the map) according to Itti, Koch, and Niebur’s (1998) model for (a) a sample temperature-salient map, (b) the corresponding pressure-salient map in Experiment 1, and (c) the corresponding pressure-salient map in Experiment 2.
maps was very short and significantly shorter than for the maps used in Experiment 1, t(9) ⬎ 4.0, p ⬍ .002. In contrast, the distance from the salient regions to the irrelevant temperature scale was longer, t(9) ⫽ 4.25, p ⫽ .002. In Experiment 2, we compared the redesigned pressure-salient maps with the temperature-salient maps used in Experiment 1. We predicted significant effects of map design on eye fixations with the stronger manipulation of this variable in Experiment 2, and we examined whether these led to larger effects on task performance (accuracy) compared with Experiment 1. In Experiment 2, we also examined the possibility that the salience principle impedes performance in the temperature-salient maps by making task-irrelevant locations salient (rather than facilitating performance in the pressure-salient maps by making task-relevant regions salient). For example, it is possible that the task-irrelevant but salient regions of the temperature maps capture attention, drawing the
eyes to these locations and away from the task-relevant regions. Although suddenly appearing stimuli can capture attention and eye fixations in this way (e.g., Brockmole & Henderson, 2005; Theeuwes, Kramer, Hahn, & Irwin, 1998), visual features—such as luminance and color—are less demanding of attention (Irwin, Colcombe, Kramer, & Hahn, 2000), and salient regions of a simple display or scene do not typically capture attention when they are not task relevant (Simons, 2000; Yantis & Egeth, 1999). To examine whether the same is true of graphic displays, we examined whether people were likely to fixate the most salient, but task-irrelevant, regions of the temperature-salient maps.
Method Participants. Participants were 40 students from introductory and experimental design classes in psychology at the University of
Table 3 Mean Minimum Distance in Pixels (Standard Deviations in Parentheses) Between Task-Relevant Areas of the Map (the Arrow and Pressure Systems) and Task-Irrelevant Areas (the Temperature Scale) and the Four Most Salient Areas, as Defined by Itti, Koch, and Niebur’s (1998) Model Area of interest
Temperature salient (Experiments 1 and 2)
Pressure salient (Experiment 1)
Pressure salient (Experiment 2)
Arrow Closest pressure system Second closest pressure system Temperature scale
176 (98) 188 (109) 96 (52) 83 (106)
119 (83) 173 (112) 97 (59) 49 (63)
24 (22) 9 (6) 14 (20) 281 (106)
Note.
The size of each image was 800 ⫻ 600 pixels.
COMPREHENSION OF COMPLEX VISUAL DISPLAYS
California, Santa Barbara. None of the participants had any formal training in meteorology or atmospheric sciences. Twenty were randomly assigned to view each of the map types (temperaturesalient vs. pressure-salient). Because of procedural and calibration errors, data from four participants in the temperature-salient group were not usable, so the analyses are based on data from the other 36 participants. Materials and design. This experiment had the same design as Experiment 1. The only difference was the use of the redesigned pressure-salient maps. The temperature-salient maps were identical to those used in Experiment 1. In this experiment, we included a measure of background knowledge of meteorology, made up of 14 multiple choice questions in addition to the Knowledge of Principles Questionnaire. Procedure. The experimental procedure was identical to Experiment 1 except that participants took the background knowledge questionnaire before the first set of wind prediction (pretest) trials.
Results and Discussion Knowledge of meteorology. Background knowledge of meteorology was comparable for the temperature-salient map group (M ⫽ 5.38 out of 14, SD ⫽ 1.85) and the pressure-salient map group (M ⫽ 5.23, SD ⫽ 1.81, t ⬍ 1). The Knowledge of Principles Questionnaire indicated that the temperature-salient group had somewhat better knowledge of the relevant meteorological principles after their first time reading the meteorology tutorial (M ⫽ 3.40, SD ⫽ 0.59) than the pressure-salient group (M ⫽ 2.80, SD ⫽ 0.84), t(34) ⫽ 2.46, p ⬍ .05. Response times. Trials with response times of more than three standard deviations from the mean (3.5% of trials) were not included in either the response time or eye fixation analyses. Neither instruction, F(1, 34) ⫽ 2.35, p ⫽ .14; map design, F(1, 34) ⬍ 1; nor their interaction, F(1, 37) ⬍ 1, had significant effects on response times in this experiment (see Table 1).5 Effects of knowledge and display design on accuracy. As in Experiment 1, accuracy on the wind verification task increased from before (M ⫽ 0.54, SD ⫽ 0.13) to after (M ⫽ 0.72, SD ⫽ 0.09) meteorology instruction, F(1, 34) ⫽ 38.73, p ⬍ .001, 2p ⫽ .53. Critically, there was a significant interaction of map design with instruction, F(1, 34) ⫽ 5.51, p ⬍ .05, 2p ⫽ .14. As shown in Figure 7, the pressure-salient group performed better after learning meteorology than the temperature-salient group, F(1, 34) ⫽ 8.02,
Figure 7. Mean accuracy before and after instruction (error bars show standard errors) in Experiment 2.
47
p ⫽ .01, 2p ⫽ .19; there was no difference between these two groups before instruction, F(1, 34) ⫽ 0.03, p ⫽ .86. The main effect of map type was not significant, F(1, 34) ⫽ 3.10, p ⫽ .08. As in Experiment 1, performance after instruction was enhanced by pressure-salient maps, but salience had no effects on performance before instruction. Effects of knowledge and display design on eye fixations. Time prior to the first fixation on task-relevant regions. Table 2 shows the mean time prior to the first fixation on the pressure systems and the arrow as a function of map type and instruction. In this experiment, both the arrow, F(1, 34) ⫽ 7.76, p ⬎ .01, 2p ⫽ .19, and its closest pressure system, F(1, 34) ⫽ 13.16, p ⬍ .001, 2p ⫽ .28, were fixated sooner on pressure-salient maps than on temperaturesalient maps. Time prior to viewing the arrow was not affected by learning meteorology, although there was a marginal interaction of map type with instruction, F(1, 34) ⫽ 3.84, p ⫽ .06. Participants viewed the closest pressure system earlier after learning the meteorological principles than before, F(1, 34) ⫽ 4.48, p ⬍ .05, 2p ⫽ .12. The interaction of map with instruction was not significant, and there were not any significant effects on time to view the second closest pressure system to the arrow. Proportion of time spent on task-relevant regions. As in Experiment 1, participants spent proportionally more time fixating the relevant pressure systems (M ⫽ 0.58, SD ⫽ 0.08) after instruction compared with before (M ⫽ 0.48, SD ⫽ 0.07), F(1, 34) ⫽ 34.01, p ⬍ .001, 2p ⫽ .50. In contrast with Experiment 1, there was a significant main effect of map design on time spent viewing the relevant pressure systems in this experiment, F(1, 34) ⫽ 16.48, p ⬍ .001, 2p ⫽ .33. As Figure 8a shows, participants in the pressure-salient group spent more time viewing the relevant pressure systems than those in the temperature-salient group both before and after instruction. The interaction of instruction with map type approached significance, F(1, 34) ⫽ 3.81, p ⫽ .06, suggesting that the effects of salience before instruction were partially overwritten by knowledge acquired during instruction. The highly significant increase in time on the pressure systems after instruction was not just due to viewing the arrow (which sometimes overlapped with the pressure systems, and which should be viewed both before and after instruction, because of task knowledge). Figure 8b shows that the proportion of time spent viewing the arrow did not differ significantly before and after instruction, F(1, 34) ⫽ 3.37, p ⫽ .08, and the interaction of instruction and map type was not significant, F(1, 34) ⬍ 1. In this experiment, the pressure-salient map group tended to spend a greater proportion of time viewing the arrow (M ⫽ 0.42, SD ⫽ 0.09) than the temperature-salient map group (M ⫽ 0.35, SD ⫽ 0.08), F(1, 34) ⫽ 5.43, p ⫽ .03, 2p ⫽ .14. Proportion of time spent on task-irrelevant regions. The proportion of fixation time spent on the temperature scale decreased from 0.06 (SD ⫽ 0.13) before instruction to 0.01 (SD ⫽ 0.04) after instruction (Z ⫽ 2.4, p ⬍ .05, Wilcoxon signed ranks test). Participants viewed this scale on more pre-instruction trials (M ⫽ 5 Response times were shorter in this experiment, possibly reflecting the fact that participants performed another meteorology task (the background knowledge questionnaire) before the inference task or that the participants were more advanced students (students in an experimental design class) who had more test-taking and experimental experience.
48
HEGARTY, CANHAM, AND FABRIKANT
Figure 8. Mean proportion of fixation time on (a) the closest pressure systems and (b) the arrow, before and after meteorology instruction in Experiment 2. Error bars show standard errors.
5.13 of the 30 trials, SD ⫽ 9.98) than post-instruction trials (M ⫽ 2.16 trials, SD ⫽ 4.98; Z ⫽ 1.99, p ⬍ .05). Before meteorology instruction, the temperature-salient group tended to spend a greater proportion of time viewing the temperature scale (M ⫽ 0.11, SD ⫽ 0.17) than the pressure-salient group (M ⫽ 0.01, SD ⫽ 0.02), Mann–Whitney U ⫽ 106, Z ⫽ 1.92, p ⫽ .09. The type of map (temperature-salient vs. pressure-salient) did not significantly affect viewing of the temperature scale after instruction (Mann– Whitney U ⫽ 121, Z ⫽ 1.31), again suggesting that effects of salience were overwritten by knowledge. There was no evidence that participants were drawn to visually salient areas of the maps, as defined by Itti and Koch’s (2000) model when these areas were not task-relevant. We defined circular areas of interest, each with a diameter of 100 pixels (1.6% of the display area), corresponding to the four most visually salient regions of each temperature-salient map (see Figure 6), and we computed the proportion of time spent in these four regions. Time spent on the four most salient regions of the display was negligible. Participants spent an average of 0.035 (SD ⫽ 0.06) of their fixation time on these regions before learning meteorology, and they spent an average of 0.016 (SD ⫽ 0.01) of their fixation time on these regions after learning meteorology, t(15) ⫽ ⫺0.18, p ⫽ .85; this is less time than would be predicted by chance, which is 0.064 (the proportion of the display area occupied by these areas of interest). This analysis shows that salient locations do not automatically capture attention when they are not task-relevant, consistent with research on simple visual search tasks (Yantis & Egeth, 1999) and scene and event perception (Simons, 2000). Post hoc comparison of accuracy in Experiments 1 and 2. The differences in eye fixations by the pressure-salient and temperature-salient groups in Experiment 2 prompted us to ask
whether the accuracy of the pressure-salient group was higher than in Experiment 1 (in which there were no effects of display design on eye fixations). We conducted a post hoc analysis of variance of the combined accuracy data from Experiments 1 and 2, which included experiment as a factor. The difference in performance between the two experiments was not significant, F(1, 70) ⬍ 1, and the interactions of experiment with map design or instruction were also not significant (all Fs ⬍ 1.3, ps ⬎ .28). Thus, although increasing the relative visual salience of the relevant information in the pressure-salient maps in Experiment 2 led to more eye fixations on task-relevant information for these maps, this difference did not produce more accurate performance compared with Experiment 1 (in which salience did not significantly affect the distribution of eye fixations). Comparing across experiments reveals a dissociation between factors that affect eye fixations and those that affect task accuracy. That is, the manipulation of salience in Experiment 2 had greater effects on eye fixations than the manipulation of salience in Experiment 1, but salience had similar effects on accuracy of performance in the two experiments. These results argue against the spatial selection hypothesis as the main mechanism by which salience enhances performance on the wind inference task, given that this hypothesis states that salience enhances performance by drawing attention, and the eyes, to the task-relevant locations. These results are consistent with the feature selection hypothesis, which states that salience facilitates the filtering of relevant from irrelevant information at task-relevant locations. There is one more possible account of the salience principle. It is possible that the effects of map display in Experiments 1 and 2 reflected a cognitive set produced by the maps viewed during the pretest phase. This is related to a possible pragmatic function of map design (cf. Kosslyn, 1989) that design implicitly communicates to the viewer which variable is likely to be relevant to the task. Participants do not know how to infer wind direction at the beginning of our experiments—they perform at chance before they learn the meteorological principles. Under these circumstances, Schwartz and Bransford (1998) have argued that presenting students with contrasting examples before teaching them about relevant concepts can help them notice features and dimensions of variance that prepare them for learning. If we view the pretest trials as contrasting examples, it is possible that viewing pressure-salient maps before learning about meteorological principles caused participants to notice relations between the pressure systems and the arrows to be verified, preparing them to learn how wind can be inferred from pressure. In contrast, those who viewed temperaturesalient maps may have paid more attention to variations in temperature, which in fact are task irrelevant, a type of garden-path effect. Consequently, those who viewed pressure-salient maps may be more prepared to learn from the meteorology tutorial and to gain a better understanding of how to infer wind from pressure. According to this account, which we call the priming hypothesis, map design affects the quality of the declarative knowledge that people acquire from the tutorial and not just the process of map comprehension. Preliminary evidence in Experiments 1 and 2 argues against this explanation, in that there was no difference in acquired knowledge of the meteorological principles between the two groups in Experiment 1, and Experiment 2 actually showed a difference in favor of the temperature-salient group. We examine the priming hypothesis more directly in Experiment 3.
COMPREHENSION OF COMPLEX VISUAL DISPLAYS
Experiment 3 In Experiments 1 and 2, participants viewed either pressuresalient maps or temperature-salient maps both before and after instruction in meteorology. With this design, it is not possible to determine whether the improved performance in the pressuresalient map conditions was due to priming by what is visually salient in the maps viewed before instruction or facilitation of the inference process by the maps viewed after instruction. Experiment 3 was designed to evaluate these alternative explanations by independently varying the type of maps that were seen before and after instruction. If the improved performance of the pressuresalient groups in the previous experiments was due to a priming effect, then participants who view pressure-salient maps before they learn the meteorology principles should have superior performance, regardless of which maps they view after learning. In contrast, if the improved performance is due to facilitation of the inference process once the relevant knowledge has been acquired, participants who view pressure-salient maps after learning should have superior performance, regardless of which map they viewed before learning. An unexpected result in Experiments 1 and 2 was that participants spent a large proportion of time viewing the relevant pressure systems before learning the meteorology principles, even though their task performance was at chance before learning. To better understand this result, we also included an additional questionnaire in Experiment 3, which asked participants to state which variables they believed to be task relevant before and after instruction. This questionnaire provided information about what general knowledge of meteorology participants brought to the experiment and provided information about whether the relative visual salience of pressure and temperature on the maps affected which variables they believed to be relevant.
Method Participants. Eighty students in an introductory psychology class at the University of California, Santa Barbara, participated. None of the participants had formal training in meteorology or atmospheric sciences. Materials and design. This experiment had a 2 (type of map viewed before instruction) ⫻ 2 (type of map viewed after instruction) ⫻ 3 (arrow type) ⫻ 2 (before or after instruction) design. Participants were randomly assigned to one of four conditions, such that 20 participants viewed pressure-salient maps before and after instruction, 20 received pressure-salient maps before instruction and temperature-salient maps after instruction, 20 received temperature-salient maps before and after instruction, and 20 received temperature-salient maps before instruction and pressuresalient maps after instruction. All participants completed the same 30 trials before and after instruction. The weather maps and questionnaires were identical to those used in Experiment 2. Participants in this experiment completed a post-task questionnaire in which they were asked which weather variables they considered to be task relevant, both before and after instruction. The specific questions were “what did you think were the most important variables for predicting wind direction before instruction?” and “after instruction, what did you think were the most important variables for the task?”
49
Procedure. Up to three students participated at a time. They first completed the Background Knowledge of Meteorology Questionnaire and were given instructions and practice trials for the arrow verification task. Their response times were then measured as they completed the 30 pretest trials. Then participants were shown the meteorology tutorial, which they studied at their own pace, and they completed the Knowledge of Principles Questionnaire; the participants were then given feedback on their answers. All participants then reviewed the presentation and were instructed to find the correct answer to any question that they had missed. Then they were shown the three practice problems, completed the 30 posttest trials, and finally completed the post-task questionnaire.
Results and Discussion Meteorology knowledge. Performance on the Meteorology Knowledge Questionnaire (M ⫽ 6.3 out of 14, SD ⫽ 0.13) was similar to Experiment 2 and did not differ between the four experimental groups, F(3, 76) ⫽ 1.47, p ⫽ .22. There was also no difference between the groups on the Knowledge of Principles Questionnaire, F(3, 75) ⫽ 0.76, p ⫽ .51, (M ⫽ 3.35 out of 4, SD ⫽ 0.89), providing no evidence that the maps viewed before instruction affected participants’ acquisition of declarative knowledge of the meteorology principles. Response times. Trials with response times of more than three standard deviations from the mean (2.3% of trials), or less than 100 ms (0.4% of trials), were not included in the analyses. As in Experiment 1, mean response times increased significantly from before instruction (M ⫽ 3.78 s, SD ⫽ 1.64) to after instruction (M ⫽ 4.22 s, SD ⫽ 1.31), F(1, 76) ⫽ 6.65, p ⬍ .05, 2p ⫽ .08. Map type did not significantly affect response times, and there was not a significant interaction of map type and instruction for this variable. Effects of knowledge and display design on accuracy. If the improved performance of the pressure-salient groups in the previous experiments was due to a priming effect, then the groups who viewed pressure-salient maps before instruction in meteorology should have superior performance (after instruction) regardless of which map they viewed after instruction. In contrast, if the improved performance is due to facilitation of the inference process once the relevant knowledge has been acquired, the groups that viewed pressure-salient maps after instruction should have superior performance, regardless of which map they viewed before. Accuracy data are presented in Figure 9. As in Experiments 1 and 2, performance before instruction was close to chance (M ⫽ 0.54, SD ⫽ 0.11) and improved significantly after instruction (M ⫽ 0.68, SD ⫽ 0.14), F(1, 76) ⫽ 75.97, p ⬍ .05, 2p ⫽ .50. There was no significant effect of the type of map viewed before instruction, F(1, 76) ⬍ 1, and this variable did not interact significantly with any other factor ( p ⬎ .05 in all cases). In contrast, the effect of the type of map viewed after instruction was marginally significant, F(1, 76) ⫽ 3.93, p ⫽ .05, 2p ⫽ .05. Critically, there was a significant interaction of this variable with instruction, F(1, 76) ⫽ 16.73, p ⬍ .001, 2p ⫽ .18, such that performance was better with pressure-salient maps after instruction, F(1, 76) ⫽ 12.59, p ⫽ .001, 2p ⫽ .14, but (not surprisingly) not before instruction, F(1, 76) ⬍ 1. Thus, the results clearly indicate that performance is
50
HEGARTY, CANHAM, AND FABRIKANT
General Discussion
Figure 9. Mean accuracy for the four different experimental conditions in Experiment 3, before and after meteorology instruction. Error bars show standard errors. Temp ⫽ temperature; Press ⫽ pressure.
affected by the design of the map that is viewed after learning meteorology, but the map viewed before learning has no effect. We coded whether participants listed pressure and temperature as relevant to predicting wind direction, both before and after instruction. Two researchers (one of whom was blind to the hypotheses) independently coded participants’ answers, and interrater agreement was high ( ⫽ .96). If the type of map viewed before instruction subtly communicates to the viewer which variable is relevant, the pressure-salient group should be more likely to believe that pressure is the relevant variable than the temperaturesalient group. In fact, there were no differences between these groups on the variables listed as relevant to the task, either before or after instruction. Before instruction, 43 of the 80 participants listed pressure as relevant, and this number increased significantly to 75 after instruction: McNemar test, 2(1) ⫽ 30.03, p ⬍ .001. In contrast, only 13 participants considered temperature to be important before instruction, and this number decreased significantly to four after instruction: McNemar test, exact significance ⫽ .035 on the basis of the binomial distribution. Participants were more likely to list pressure than temperature as relevant both before instruction, 2(1) ⫽ 17.52, p ⬍ .001, and after instruction, 2(1) ⫽ 67.12, p ⬍ .001. However, before they were instructed on how to infer wind from pressure, knowing that pressure was the relevant variable was not sufficient to improve performance. In summary, in Experiment 3 we independently manipulated the type of maps participants viewed before and after learning the meteorology principles. This manipulation produced no evidence that the maps viewed before learning subtly communicated which variable was relevant or primed participants to learn better from the meteorology tutorial. In contrast, the map that participants viewed after instruction had a significant effect on performance, with the pressure-salient groups outperforming the temperaturesalient groups, as in Experiments 1 and 2. The post-task questionnaire indicated that over half of the participants knew at the beginning of the experiment that pressure was the relevant variable, whereas only 16% thought that temperature was relevant. This pre-experimental knowledge probably explains why participants in Experiments 1 and 2 looked a lot at the pressure systems and very little at the temperature scale, even before learning the meteorology principles.
We examined effects of map design and knowledge on inferences from complex visual displays and eye fixations during this inference process. In all three experiments, map design enhanced performance such that participants were more accurate when they viewed maps in which task-relevant variables were relatively salient than when they viewed maps in which these variables were relatively less salient. These effects interacted with knowledge, such that salience affected performance only after participants had acquired the declarative knowledge necessary to perform the task. Examination of eye fixations indicated that the effects of display design on task performance were largely independent of whether map design affected eye fixations. Map design affected the proportion of time spent on task-relevant locations of the display with the strong manipulation of visual salience in Experiment 2 but not with the more subtle manipulation in Experiment 1. However, the effects of map design on accuracy were equivalent in the two experiments. In Experiment 3, when we manipulated which type of map was viewed both before and after instruction, it was the type of map viewed after instruction that was critical to enhancing performance on the wind verification task; the type of map viewed before instruction had no effect. Furthermore, even though it is likely that participants in all three experiments knew that pressure was more important than temperature for predicting wind direction, this declarative knowledge did not facilitate performance until after they learned the meteorological principles to apply to the task.
The Salience Principle Our research provides evidence for one principle of cartography and graphics design more generally (Bertin, 1983; Dent, 1999; Kosslyn, 1989): Good displays should make task-relevant information salient in a display. Beyond providing evidence for this salience principle, our research also begins to elucidate the mechanisms by which display design enhances performance. We considered three possible accounts. The first is that visual salience enhances performance by guiding participants’ eye fixations to the task-relevant locations of the display (spatial selection hypothesis). The second was that salience improves participants’ ability to attend to the visual features that represent task-relevant information (feature selection hypothesis). The third was that making the task-relevant information in a display visually salient subtly communicated to participants what is relevant so that they were better prepared to learn from the meteorology tutorial (priming hypothesis). Experiment 3 argued against the priming account in showing that performance was unaffected by the maps viewed before instruction. Moreover, there was no evidence in any of the three experiments that viewing the pressure-salient maps before instruction enhanced learning of the meteorological principles. It is also unlikely that the spatial selection hypothesis can account for all of our results. In Experiment 1, performance was enhanced with maps that made the task-relevant variables more salient (as verified by a manipulation check), but it did not necessarily make task-relevant locations more salient (as indicated by an objective model of visual salience). In this experiment, performance was enhanced with the pressure-salient maps, even though map design had no effect on the proportion of time spent viewing
COMPREHENSION OF COMPLEX VISUAL DISPLAYS
the task-relevant pressure systems (although it did affect how early participants viewed the pressure systems in a trial and in this sense supports spatial selection as one mechanism of the salience effect). In Experiment 2—in which we used maps that made both taskrelevant variables and the task-relevant locations more salient (as verified by an objective model of visual salience)—there were larger and statistically significant effects on eye fixations. However, there was no enhancement of performance, relative to Experiment 1. The results of Experiment 2 also argue against an alternative version of the spatial selection hypothesis, that attention and eye fixations are captured by salient but task-irrelevant locations of temperature-salient maps. Our research supports a model in which eye fixations in this task are primarily affected by top-down knowledge, and map design affects performance primarily by facilitating processing of the visual features that represent task-relevant information (feature selection hypothesis). There were strong top-down influences on eye fixations such that even before learning the meteorological principles, participants spent most of their time looking at the task-relevant locations (the arrow and closest pressure systems), and the proportion of time on these relevant areas increased significantly after learning. In terms of our task analysis (see Figure 2), we therefore propose that Steps 1 and 2 (locating the arrow and pressure system) are largely influenced by top-down knowledge of the task and domain. However, once participants fixate the task-relevant locations, they still have to attend to the visual features that show the task-relevant variables (i.e., attend to the isobars and suppress the color cues showing temperature). We propose that increasing the visual salience of the isobars in the pressure-salient maps and decreasing the visual salience of the colors showing temperature allowed participants to better filter the relevant from the irrelevant visual features, and this, in turn, facilitated the processes of encoding the direction of the arrow relative to the isobars (Step 5) and comparing this with the inferred wind direction (Step 7). If visual attention is viewed as a set of competitive interactions between different features or objects in the visual field (Desimone & Duncan, 1995), we argue that making the task-relevant visual features salient biases the competition in favor of these features, so that they are processed more efficiently, and the need to actively suppress task-irrelevant features is minimized. Our results contrast with those of Grant and Spivey (2003), who proposed a stronger influence of spatial selection, namely that making the most task-relevant information in a diagram of Duncker’s (1945) tumor problem more visually salient improves performance by guiding people’s eyes to the relevant information. However, in their research, successful participants did not just direct attention to the relevant locations of the display; they also showed a characteristic pattern of looking back and forth between the inside and outside of the depicted skin, a pattern that actually embodied the solution to the problem. L. E. Thomas and Lleras (2007) later showed that drawing attention to task-relevant locations of the display without inducing this eye movement pattern was not sufficient to enhance performance. Duncker’s tumor problem does not provide any top-down information about where to look in the display, and the salience manipulation in the studies of this problem involved motion, which is known to have stronger effects on attentional capture than the variables manipulated in our study, such as color and intensity (Irwin et al., 2000). The research
51
of Grant and Spivey and others (L. E. Thomas & Lleras, 2007) suggests that low-level visual cues can have greater effects on eye fixations, and consequently task performance, when there are no strong top-down influences on eye fixations.
Effects of Knowledge Providing participants with explicit declarative knowledge about relevant meteorological principles increased their attention to the most task-relevant areas of the displays and decreased their attention to task-irrelevant areas. Whereas previous studies have shown effects of expertise (Charness, Reingold, Pomplun, & Stampe, 2001; Haider & Frensch, 1996, 1999; Reingold et al., 2001; Underwood, 2007) and training (Chapman et al., 2002) on eye fixations, what is new about our results is that they show that attention to a visual display can be altered with just a brief amount (10 –15 min) of verbal instruction that provided task-relevant declarative knowledge but did not teach participants a procedure for doing the task or tell them where to look (see Canham & Hegarty, in press). These results are strong evidence that domain knowledge, not just knowledge of graphics conventions or a specific task, can affect eye fixations in graphics comprehension. Research in scene perception has pointed to the importance of short-term episodic knowledge, scene schema knowledge, and task-related knowledge in directing eye fixations (Henderson, 2003). Scene perception relies on general knowledge rather than knowledge of a specific domain. Our research (and that of Chapman et al., 2002) shows that specific domain knowledge can also affect eye fixations, and this can result from just a short amount of verbal instruction.
Implications for Research on Visual Cognition Consistent with recent research in scene perception and everyday tasks (e.g., Foulsham & Underwood, 2007; Henderson et al., 2007; Rothkopf et al., 2007; Turano et al., 2003), our research indicates that eye fixations during a graphics comprehension task are primarily directed by top-down influences of task instructions and knowledge. However, it also indicates that by studying relatively simple tasks, on which accuracy is usually high, we might underestimate the influence of display factors on performance. By examining a challenging inference task, typical of graphics comprehension, we have shown that display factors such as salience can have large effects on task performance, even when they have smaller effects on eye fixations. Thus, display variables can affect the accuracy and not just the efficiency of task performance. In general, designers of graphical displays have a lot of freedom in how they assign visual variables such as color, intensity, and line orientation to conceptual variables. As a result, graphic comprehension offers an interesting venue in which to study effects of salience and other visual variables on task performance.
Implications for Theories of Graphics Comprehension This research contributes to theories of graphics comprehension by providing new information regarding how knowledge and design interact in the comprehension of graphics, how people select task-relevant information from complex displays, and how people make inferences from graphics. There is now considerable evi-
HEGARTY, CANHAM, AND FABRIKANT
52
dence that display design can enhance performance in more basic tasks of encoding and interpreting visual displays (e.g., Peebles & Cheng, 2003; Shah et al., 1999; Simkin & Hastie, 1986). In the more complex inference tasks studied here, display factors enhanced task performance only after instruction in the domain and not before, suggesting that in more complex inference tasks, display design becomes irrelevant if the viewer does not have the pertinent knowledge to make the necessary inferences. Moreover, we have shown that display design is functional, both in early stages of directing a viewer’s attention to task-relevant locations of a display and in later stages of filtering relevant from irrelevant information at those locations. As a result, we have not just provided evidence for the salience principle of display design but have elucidated the mechanisms by which display design interacts with knowledge to influence comprehension of complex visual displays.
References Bertin, J. (1983). Semiology of graphics: Diagrams networks maps (W. Berg, Trans.). Madison, WI: University of Wisconsin Press. Biederman, I., Mezzanotte, R. J., & Rabinowitz, J. C. (1982). Scene perception: Detecting and judging objects undergoing relational violations. Cognitive Psychology, 14, 143–177. Brockmole, J. R., & Henderson, J. M. (2005). Object appearance, disappearance, and attention prioritization in real-world scenes. Psychonomic Bulletin & Review, 12, 1061–1067. Canham, M., & Hegarty, M. (in press). Effects of knowledge and display design on comprehension of complex graphics. Learning and Instruction. Card, S. K., Mackinlay, J. D., & Schneiderman, B. (1999). Readings in information visualization: Using vision to think. San Francisco, CA: Morgan Kaufmann. Carpenter, P. A., & Shah, P. (1998). A model of the perceptual and conceptual processes in graph comprehension. Journal of Experimental Psychology: Applied, 4, 75–100. Chapman, P., Underwood, G., & Roberts, K. (2002). Visual search patterns in trained and untrained novice drivers [Special issue: Eye movements, visual attention, and driving behaviour]. Transportation Research Part F: Traffic Psychology and Behaviour, 5, 157–167. Charness, N., Reingold, E. M., Pomplun, M., & Stampe, D. M. (2001). The perceptual aspect of skilled performance in chess: Evidence from eye movements. Memory & Cognition, 29, 1146 –1152. Cohen, J., Cohen, P., West, S. G., & Aiken, L. S. (2003). Applied multiple regression/correlation analysis for the behavioral sciences (3rd ed.). Mahwah, NJ: Erlbaum. Dent, B. D. (1999). Cartography: Thematic map design (5th ed.). Duboque, IA: Brown. Desimone, R., & Duncan, J. (1995). Neural mechanisms of selective visual attention. Annual Review of Neuroscience, 18, 193–222. Duncker, K. (1945). On problem solving. Psychological Monographs, 58(Whole No. 270). Fabrikant, S. I., & Goldsberry, K. (2005, July 9 –16). Thematic relevance and perceptual salience of dynamic geovisualization displays. Proceedings of the 22nd ICA/ACI International Cartographic Conference, Corun˜a, Spain. Foulsham, T., & Underwood, G. (2007). How does the purpose of inspection influence the potency of visual salience in scene perception? Perception, 36, 1123–1138. Freedman, E. G., & Shah, P. (2002). Toward a model of knowledge-based graph comprehension. In M. Hegarty, B. Meyer, & N. H. Narayanan (Eds.), Diagrammatic representation and inference (pp. 8 –31). Berlin, Germany: Springer-Verlag.
Friedman, A. (1979). Framing pictures: The role of knowledge in automatized encoding and memory for gist. Journal of Experimental Psychology: General, 108, 316 –355. Gattis, M., & Holyoak, K. J. (1996). Mapping conceptual to spatial relations in visual reasoning. Journal of Experimental Psychology: Learning, Memory, and Cognition, 22, 231–239. Grant, E., & Spivey, M. (2003). Eye movements and problem solving: Guiding attention guides thought. Psychological Science, 14, 462– 466. Haider, H., & Frensch, P. A. (1996). The role of information reduction in skill acquisition. Cognitive Psychology, 30, 304 –337. Haider, H., & Frensch, P. A. (1999). Eye movement during skill acquisition: More evidence for the information-reduction hypothesis. Journal of Experimental Psychology: Learning, Memory, and Cognition, 2, 172– 190. Hayhoe, M., Bensinger, D. G., & Ballard, D. H. (1997). Task constraints in visual working memory. Vision Research, 38, 125–137. Henderson, J. M. (2003). Human gaze control during real-world scene perception. TRENDS in Cognitive Sciences, 7, 498 –504. Henderson, J. M., Brockmole, J. R., Castelhano, M. S., & Mack, M. (2007). Visual saliency does not account for eye movements during visual search in real-world scenes. In R. van Gompel, M. Fischer, W. Murray, & R. Hill (Eds.), Eye movements: A window on mind and brain (pp. 537–562). Oxford, England: Elsevier. Henderson, J. M., & Ferreira, F. (2004). Scene perception for psycholinguists. In J. M. Henderson & F. Ferreira (Eds.), The interface of language, vision, and action (pp. 1–58). New York, NY: Psychology Press. Herrmann, D., & Pickle, L. W. (1996). A cognitive subtask model of statistical map reading. Visual Cognition, 3, 165–190. Hollingworth, A., & Henderson, J. M. (2003). Testing a conceptual locus for the inconsistent object change detection advantage in real-world scenes. Memory & Cognition, 31, 930 –940. Irwin, D. E., Colcombe, A. M., Kramer, A. F., & Hahn, S. (2000). Attentional and oculomotor capture by onset, luminance, and color singletons. Vision Research, 40, 1443–1458. Itti, L., & Koch, C. (2000). A saliency-based search mechanism for overt and covert shifts of visual attention. Vision Research, 40, 1489 –1506. Itti, L., Koch, C., & Niebur, E. (1998). A model of saliency-based visual attention for rapid scene analysis. IEEE Transactions on Pattern Analysis and Machine Intelligence, 20, 1254 –1259. Kosslyn, S. (1989). Understanding charts and graphs. Applied Cognitive Psychology, 3, 185–225. Land, M. F., & Hayhoe, M. (2001). In what way do eye movements contribute to everyday activities? Vision Research, 41, 3559 –3565. Landy, D., & Goldstone, R. L. (2007). How abstract is symbolic thought? Journal of Experimental Psychology: Learning, Memory, and Cognition, 33, 720 –733. Larkin, J., & Simon, H. (1987). Why a diagram is (sometimes) worth ten thousand words. Cognitive Science, 11, 65–99. Lewandowsky, S., & Behrens, J. T. (1999). Statistical graphs and maps. In F. T. Durso, R. S. Nickerson, R. W. Schvaneveldt, S. T. Dumais, D. S. Lindsay, & M. T. H. Chi (Eds.), Handbook of applied cognition (pp. 513–549). Hoboken, NJ: Wiley. Lohse, G. L. (1993). A cognitive model for understanding graphical perception. Human Computer Interaction, 8, 353–388. Lowe, R. K. (1993). Constructing a mental representation from an abstract technical diagram. Learning & Instruction, 3, 157–179. Lowe, R. K. (1994). Selectivity in diagrams: Reading beyond the lines. Educational Psychology, 14, 467– 491. Lowe, R. K. (1996). Background knowledge and the construction of a situational representation from a diagram. European Journal of Psychology of Education, 11, 377–397. MacEachren, A. (1995). How maps work: Representation, visualization, and design. New York, NY: Guilford Press. Novick, L. R., & Catley, K. M. (2007). Understanding phylogenies in
COMPREHENSION OF COMPLEX VISUAL DISPLAYS biology: The influence of a Gestalt perceptual principle. Journal of Experimental Psychology: Applied, 13, 197–223. Parkhurst, D., Law, K., & Niebur, E. (2002). Modeling the role of salience in the allocation of overt visual attention. Vision Research, 42, 107–123. Peebles, D., & Cheng, P. C.-H. (2003). Modeling the effect of task and graphical representation on response latency in a graph-reading task. Human Factors, 45, 28 – 46. Pinker, S. (1990). A theory of graph comprehension. In R. Freedle (Ed.), Artificial intelligence and the future of testing (pp. 73–126). Hillsdale, NJ: Erlbaum. Ratwani, R. M., & Trafton, J. G. (2008). Shedding light on the graph schema: Perceptual features vs. invariant structure. Psychonomic Bulletin & Review, 15, 757–762. Reingold, E. M., Charness, N., Pomplun, M., & Stampe, D. M. (2001). Visual span in expert chess players: Evidence from eye movements. Psychological Science, 12, 48 –55. Rock, I., & Gutman, D. (1981). The effect of inattention on form perception. Journal of Experimental Psychology: Human Perception and Performance, 7, 275–285. Rothkopf, C., Ballard, D., & Hayhoe, M. (2007). Task and scene context determines where you look. Journal of Vision, 7, 1–20. Schwartz, D. L., & Bransford, J. D. (1998). A time for telling. Cognition & Instruction, 16, 475–522. Shah, P., & Carpenter, P. (1995). Conceptual limitations in comprehending line graphs. Journal of Experimental Psychology: General, 124, 337– 370. Shah, P., Freedman, E. G., & Vekiri, I. (2005). The comprehension of quantitative information in graphical displays. In P. Shah & A. Miyake (Eds.), The Cambridge handbook of visual spatial thinking (pp. 426 – 476). New York, NY: Cambridge University Press. Shah, P., Mayer, R. E., & Hegarty, M. (1999). Graphs as aids to knowledge construction: Signaling techniques for guiding the process of graph comprehension. Journal of Educational Psychology, 91, 690 –702. Simkin, D. K., & Hastie, R. (1986). An information-processing analysis of graph perception. Journal of the American Statistical Association, 82, 454 – 465. Simons, D. J. (2000). Attentional capture and inattentional blindness. Trends in Cognitive Sciences, 4, 147–155. Tatler, B. W., Baddeley, R. J., & Gilchrist, I. D. (2006). Visual correlates of fixation selection: Effects of scale and time. Vision Research, 45, 643– 659. Theeuwes, J., Kramer, A. F., Hahn, S., & Irwin, D. E. (1998). Our eyes do
53
not always go where we want them to go. Psychological Science, 9, 379 –385. Thomas, J. J., & Cook, K. A. (2005). Illuminating the path: Research and development agenda for visual analytics. Richland, WA: IEEE Press. Thomas, L. E., & Lleras, A. (2007). Moving eyes and moving thought: On the spatial compatibility between eye movements and cognition. Psychonomic Bulletin & Review, 14, 663– 668. Trafton, J. G., & Trickett, S. (2001). A new model of graph and visualization usage. In J. D. Moore & K. Stenning (Eds.), Proceedings of the 23rd Annual Conference of the Cognitive Science Society (pp. 1048 – 1053). Mahwah, NJ: Erlbaum. Trickett, S. B., & Trafton, J. G. (2006). Toward a comprehensive model of graph comprehension: Making the case for spatial cognition. In D. Barker-Plummer, R. Cox, & N. Swaboda (Eds.), Diagrammatic representation and inference (pp. 286 –300). Berlin, Germany: Springer. Triesman, A., & Gelade, G. (1980). A feature integration theory of attention. Cognitive Psychology, 12, 97–136. Turano, K. A., Geruschat, D. R., & Baker, F. H. (2003). Oculomotor strategies for the direction of gaze tested with a real-world activity. Vision Research, 43, 333–346. Underwood, G. (2007). Visual attention and the transition from novice to expert driver. Ergonomics, 50, 1235–1249. Underwood, G., & Foulsham, T. (2006). Visual saliency and semantic incongruency influence eye movements when inspecting pictures. Quarterly Journal of Experimental Psychology, 59, 1931–1949. University of Illinois. (2000). Weather World 2010 Project. Retrieved from http://ww2010.atmos.uiuc.edu/(Gh)/wx/surface.rxml Vecera, S. P., & Farah, M. J. (1994). Does visual attention select objects or locations? Journal of Experimental Psychology: General, 123, 146 –160. Yantis, S., & Egeth, H. E. (1999). On the distinction between visual salience and stimulus-driven attentional capture. Journal of Experimental Psychology: Human Perception and Performance, 25, 661– 676. Yeh, M., & Wickens, C. D. (2001). Attentional filtering in the design of electronic map displays: A comparison of color coding, intensity coding, and decluttering techniques. Human Factors, 43, 543–562. Zhang, J., & Norman, D. A. (1994). Representations in distributed cognitive tasks. Cognitive Science, 18, 87–122.
Received June 17, 2008 Revision received July 16, 2009 Accepted July 23, 2009 䡲