Magazines such as this, together with many journals are filled with articles presenting findings, new methods, tools ... analysis (that is statistical tech- niques to ...
HOW DO I KNOW WHETHER TO TRUST A RESEARCH RESULT? MARTIN SHEPPERD, BRUNEL UNIVERSITY LONDON, UK
Magazines such as this, together with many journals are filled with articles presenting findings, new methods, tools and all kinds of software engineering advice. But how can we know if we can trust a research result? Or to put it another way, should the research influence decision making? For practitioners these are important questions. And it will come as no kind of surprise in a column such as this that the role of evidence is emphasised. It helps us decide whether the research can indeed be trusted. It is gratifying therefore to see that empirical evaluation is increasingly becoming a tool for modern software engineering researchers. So that should be the end of the matter. Look at the eviInconsistent Results in Software Engineering dence. Unfortunately it would The following are three examples of systematic literaseem not to be quite that simture reviews that have failed to find ‘conclusion stabilple. In many situations the ity’ [9] followed by a large experiment comprising many evidence may be contradictory individual tests. or at least equivocal. FurJørgensen [5] reviewed 15 studies comparing modelthermore, this can happen even based to expert-based estimation. Five of those studies when one examines the body supported expert-based methods, five found no differof evidence using a systematic ence, and five supported model-based estimation. literature review to identify all Mair and Shepperd [8] compared regression to analogy relevant studies and then metamethods for effort estimation and similarly found conanalysis (that is statistical techflicting evidence. From a total of 20 primary studies, niques to combine multiple reseven supported regression, four were found no differsults by some means or other ence and nine favoured analogy. into a single answer). Kitchenham et al. [7] identified seven primary studies This lack of consistency sugof which three found cross-company models were not gests that it’s not just a matter significantly worse than using within-company models, of seeking replications of results and four found that cross-company models were signif— although this is obviously icantly worse. important — as the results may Zimmermann et al. [11] learned defect predictors from not accord (see the Side Bar en622 pairs of projects hP 1, P 2i In only 4% of pairs did titled “Inconsistent Results in defect predictors learned in P1 predicted effectively for Software Engineering”). HowP2. ever, the problem doesn’t stop there. In other fields such as medicine there is “strong evidence of an association between significant results and publication; studies that report positive or 1
2
MARTIN SHEPPERD, BRUNEL UNIVERSITY LONDON, UK
significant results are more likely to be published and outcomes that are statistically significant have higher odds of being fully reported.” Dwan et al. [1]. In a classic, though controversial, paper entitled “Why most published research findings are false” John Ioannidis states that there is “increasing concern that in modern research, false findings may be the majority or even the vast majority of published research claims” [4]. Rejecting the explanation that most scientists are charlatans why then might this be so? One issue is the expedient but open to debate tendency of claiming conclusive findings solely on the basis of a single study assessed by formal statistical significance, typically for a p-value less than 0.05 that that the null hypothesis of no effect is true. This is fine but it neglects consideration of the prior probabilities. As an example, if I conduct an experiment and announce to the world that I have developed a working anti-gravity machine (p = 0.049, α = 0.05) I shouldn’t be surprised if this not accepted as compelling evidence by the wider community. The reason being that my p = 0.049 is dominated by the a priori probability that such a result is extremely unlikely. Of course this example is foolishness but some fields are vulnerable. Ioannidis suggests that this is most likely to occur when (i) there is little theory so the primary research methods are experimental, (ii) where such methods, protocols and analysis techniques are still evolving, (iii) where effect sizes are not expected to be large and (iv) the prior probability of the research finding being false is high. He highlights machine learning as being particularly vulnerable. Another difficulty derives from selective reporting of reTypes of Bias sults. Researchers may have researcher bias: this is the combination of research preference for some results over design, analysis and reporting factors that tend to others, for example positive reproduce research findings when they should not be prosults may be perceived as more duced leading to distortions in a particular direction. useful or acceptable. Other reThis is different from the natural probability of Type I sults may simply be more in acand II errors arising from the settings of α and β. cord with the researchers prior publication bias: this is the tendency of the peer beliefs. The likely bias arising review system to be more likely to accept positive than from selective outcome reportnegative results and to publish them more rapidly. ing is to “overestimate the efThis impacts a study in its entirety. fect of the experimental treatselection bias: this is selective reporting of some but ment.” [3] not all experimental results within a study on the basis So do all these problems octhat some results are more ‘interesting’ than others. cur in computer science? To answer this question I along with co-researchers Tracy Hall and David Bowes conducted a meta-analysis to understand why different studies that looked at the same or overlapping questions might come up with different answers [10]. We focused on software defect prediction because there has been a good deal of research activity and we could capitalise upon a prior systematic review by Hall et al. [2]. To do this we performed a meta-analysis of all the published studies we could find that provided sufficient information for our purposes. This came to 42 individual primary studies that contained a total of 600 separate experimental results where each experiment tries to compare the predictive performance of a particular classifier, e.g. logistic regression, support vector machines, etc. for a
HOW DO I KNOW WHETHER TO TRUST A RESEARCH RESULT?
3
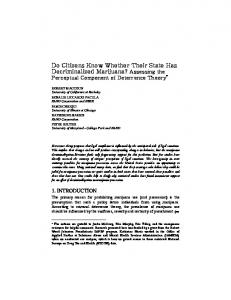
given data set. Typically an experiment compares multiple classifiers across multiple data sets using what is formally known as a repeated measures design. By a certain amount of reverse engineering we were able to extract a common response variable of prediction performance for all studies which was the Matthews correlation coefficient (MCC). This ranges from +1 for a perfect classifier through 0 for a random classifier to -1 for a perfectly perverse classifier. Figure 1 shows the distribution of predictive accuracy grouped by the type or family of classifier as a side by side boxplots. The horizontal lines within the boxes indicate the median prediction accuracy and the shaded area the 95% confidence limits. The chart shows considerable overlap between the methods with only the na¨ıve benchmarks clearly performing worse than the majority of other classifier families. Effectively the variation within a type of classifier is greater than the variation between the classifiers. This is awkward as it suggests that the thing researchers want to know, i.e., what’s the best way to predict software defects is being swamped by variation from other sources.
Figure 1. Boxplots Showing the Comparative Performance (MCC) of Defect Prediction Systems by Classifier Family. Key: ANN = artificial neural network; CBR = case-based reasoning; DecTree = decision tree including random forests; Search = metaheuristic search; SVM = support vector machine.
To better understand what was happening we modelled the results (predictive performance measured by MCC) using the type of classifier family and three other moderators (which are variables that can interact on the relationship between the variable of interest (choice of classifier) and the response variable. We used: data set: this was introduced since we might reasonably expect some data set characteristics (e.g., size, presence of categorical features, noise, etc) to favour some classifiers over others.
4
MARTIN SHEPPERD, BRUNEL UNIVERSITY LONDON, UK
input metrics: the classifiers can use quite different sets of inputs some based on process measures, others on the changes between releases and others using static code analysis so perhaps this was impacting results. research group: was added as we wondered whether different groups might have access to different types of expertise. Groups were determined using co-authorship links and agglomerative clustering leading to 23 clusters containing 1-10 authors. In addition our model allowed for higher order interactions between any of the factors. The results were quite startling. Table 1 shows the results. We see that by itself the choice of classifier is scarcely significant and contributes a little over 1%. In contrast the research group dominate and contributes more than 30%. What this means is that the main factor that influences our research results is not the thing we’re investigating (how to predict defects) but who does the work. Table 1. Proportion of total variance in predictive accuracy (MCC) ‘explained’ Factor % Research Group 31.0% Data set 11.2% Research Group:Classifier 6.6% Input metrics 5.2% Classifier Family 1.3% ResearcherGroup:Dataset 1.0%
So it would seem that at least some areas of computer science are not immune to researcher bias either. In support of this position a separate meta-analyis of experimental results by Magne Jørgensen and co-workers has also uncovered evidence of researcher bias, in that statistically significant results occurred approximately twice as frequently as might be expected from modelling the base rates [6]. Although there is an element of speculation it would seem contributory reasons include varying levels of expertise, comparing highly optimised versions of some classifiers with ‘vanilla’ versions of others and selective reporting. This might seem highly pejorative about us researchers but it must be stressed this isn’t an attack on anyone’s integrity but merely to progress an important area of scientific research. After all the ultimate aim of scientific methods is to reduce bias. Consequently we have made three recommendations that researchers should (i) conduct blind analysis, (ii) improve reporting protocols and (iii) conduct more intergroup studies in order to mitigate expertise problems. So returning to the original question, I would suggest rather than mistrust all scientific research we need to pose the following questions. • How likely is the finding to be true based on a priori scientific knowledge? • To what extent has blinding been used as part of research methods? For example, blind analysis might protect against selection bias. • Have appropriate benchmarks, in particular na¨ıve and random methods, been used? • Are there independent replications? In the meantime we researchers need to give serious considerations to these concerns.
HOW DO I KNOW WHETHER TO TRUST A RESEARCH RESULT?
5
References [1] K. Dwan, D. Altman, J. Arnaiz, J. Bloom, A.-W. Chan, E. Cronin, E. Decullier, P. Easterbrook, E. Von Elm, C. Gamble, D. Ghersi, J. Ioannidis, J. Simes, and P. Williamson. Systematic review of the empirical evidence of study publication bias and outcome reporting bias. PLoS ONE, 3(8):e3081, 2008. [2] T. Hall, S. Beecham, D. Bowes, D. Gray, and S. Counsell. A systematic literature review on fault prediction performance in software engineering. IEEE Transactions on Software Engineering, 38(6):1276–1304, 2012. [3] J. Hutton and P. Williamson. Bias in meta-analysis with variable selection within studies. Applied Statistics, 49(3):359–70, 2000. [4] J. Ioannidis. Why most published research findings are false. PLoS Medicine, 2(8):e124, 2005. [5] M. Jørgensen. A review of studies on expert estimation of software development effort. J. of Systems & Software, 70(1-2):37–60, 2004. [6] M. Jørgensen, T. Dyb˚ a, K. Liestøl, and D. Sjøberg. Incorrect results in software engineering experiments: How to improve research practices. J. of Systems and Software, under review, 2014. [7] B. Kitchenham, E Mendes, and G. Travassos. Cross versus within-company cost estimation studies: A systematic review. IEEE Transactions on Software Engineering, 33(5):316–329, 2007. [8] C. Mair and M. Shepperd. The consistency of empirical comparisons of regression and analogy-based software project cost prediction. In 4th Intl. Symp. on Empirical Softw. Eng. (ISESE). IEEE Computer Society, 2005. [9] T. Menzies and M. Shepperd. Editorial: Special issue on repeatable results in software engineering prediction. Empirical Software Engineering, 17(1-2):1–17, 2012. [10] M. Shepperd, D. Bowes, and T. Hall. Researcher bias: The use of machine learning in software defect prediction. IEEE Transactions on Software Engineering, 40(6):603–616, 2014. [11] T. Zimmermann, N. Nagappan, H. Gall, E. Giger, and B. Murphy. Cross-project defect prediction: a large scale experiment on data vs. domain vs. process. In Joint Meeting of the European Software Engineering Conference and the ACM SIGSOFT Symposium on The Foundations of Software Engineering, pages 91–100. ACM, 2009.