In particular, program understanding tools are designed to help programmers understand software during maintenance. These tools are developed to facilitate ...
How Do Program Understanding Tools Affect How Programmers Understand Programs? �
M.-A.D. Storey
�
K. Wong
�
H.A. M¨uller
�
School of Computing Science Simon Fraser University Burnaby, BC, Canada Abstract In this paper, we explore the question of whether program understanding tools enhance or change the way that programmers understand programs. The strategies that programmers use to comprehend programs vary widely. Program understanding tools should enhance or ease the programmer’s preferred strategies, rather than impose a fixed strategy that may not always be suitable. We present observations from a user study that compares three tools for browsing program source code and exploring software structures. In this study, 30 participants used these tools to solve several high-level program understanding tasks. These tasks required a broad range of comprehension strategies. We describe how these tools supported or hindered the diverse comprehension strategies used. Keywords: Program comprehension, program understanding tools, reverse engineering, software maintenance, software visualization, user study.
1
Introduction
It is widely accepted that time spent understanding existing programs is a significant proportion of the time required to maintain, debug and reuse existing code. In particular, programs which have evolved over a number of years are very difficult to understand. These programs have been maintained by various programmers with different programming styles and may be unnecessarily complex and large in size. To make matters worse, the source code of legacy systems may be the only source of information that is complete and up to date. A variety of techniques have been proposed to assist programmers in the difficult task of program comprehension. In particular, program understanding tools are designed to help programmers understand software during maintenance. These tools are developed to facilitate the comprehension
Department of Computer Science University of Victoria Victoria, BC, Canada strategies used by programmers to achieve specific maintenance tasks. However, there are a wide variety of comprehension strategies that programmers use. For a major task, maintainers may need to switch among a number of strategies. Unfortunately, tool designers may only have an intuitive notion of what features are beneficial. A tool may impose strategies that are unsuitable because of the type of program, because of the kind of task, or because of the individual user. What is needed are experimental observations that study the influence of program understanding tools on their users when solving realistic maintenance tasks. Only then can we be sure that these tools enhance how programmers understand programs. One of our research goals is to develop more effective tools for program understanding. Although many program understanding tools already exist, we have noticed that the majority of these tools have not been adopted by industrial maintainers. In general, the testing of the effectiveness of many tools has been seriously lacking. The value of many research ideas have not been adequately substantiated through empirical studies. In addition, by not evaluating existing tools and approaches, we are unable to discover which approaches are effective and efficient, and more importantly, which ones are not. For these reasons, we are currently evaluating several program understanding tools through a series of user studies, as well as using naturalistic observation techniques [10] to study software maintainers to investigate requirements for effective tool support during program comprehension. This paper describes an experiment in which 30 participants were observed performing a variety of program understanding tasks using three tools: Rigi, SHriMP, and SNiFF+. Rigi [22] is a reverse engineering system that presents software subsystem structures using an interactive, multi-window graph editor and displays the source code through separate text editor windows. The Simple Hierarchical Multi-Perspective (SHriMP) tool [37] displays software architectural diagrams using nested graphs. This
bottom-up, using application-domain knowledge to produce a hierarchy of functional abstractions.
interface embeds source code inside the graph nodes and integrates a hypertext metaphor for following low-level dependencies with animated panning, zooming, and fisheye-view actions for viewing high-level structures. The SNiFF+ system [31] is a commercial, integrated development environment for C and C++ that provides source code browsing and cross referencing features. Before our experiment, we suspected that each tool primarily supported a specific set of comprehension strategies. To gain some insight, we focused on observing the strategies used by the participants as they performed a set of highlevel program understanding tasks. We discuss how well these implicit strategies, embodied by the tools’ features, supported the set of strategies preferred by the users. As a result of our observations, we conjecture that to effectively support software maintenance, program understanding tools need to: support a combination of comprehension strategies;
Top-down. Brooks [5] suggested that programs are understood top-down, by reconstructing knowledge about the application domain and mapping that to the source code. This strategy begins with a global hypothesis about the program. This initial hypothesis is refined into a hierarchy of secondary hypotheses. Verifying or rejecting a hypothesis depends heavily on the presence or absence of beacons (cues). Soloway and Ehrlich [32] observed that a top-down strategy is used when the program or type of program is familiar. They also observed that expert programmers recognized program plans and exploited programming conventions during comprehension. Knowledge-based. Letovsky [18] theorized that programmers are opportunistic processors capable of exploiting either bottom-up or top-down cues. This theory has three components: a knowledge base that encodes the programmer’s application and programming expertise; a mental model that represents the programmer’s current understanding of the program; and an assimilation process that describes how the mental model evolves using the programmer’s knowledge base and program information. Inquiry episodes are a key part of the assimilation process. Such an episode consists of a programmer asking a question, conjecturing an answer, and then searching through the code and documentation to verify or reject the conjecture.
�
provide ways to easily enter and effortlessly switch between strategies while solving a task; and �
�
reduce cognitive overhead as the program is explored.
Section 2 outlines several cognitive models of program comprehension that have been proposed. Section 3 describes the evaluated tools and Section 4 details the experiment design. Section 5 reports on a number of observations that arose as the users tried to solve several comprehension tasks with the tools. Section 6 interprets the observations and discusses how well the tools supported various comprehension strategies. Finally, Section 7 concludes the paper.
2
Systematic and as-needed. Littman et al. [20] observed that programmers use either a systematic approach, reading the code in detail and tracing through control and data flow, or they use an as-needed approach, focusing only on the code related to the task at hand. Soloway et al. [33] combined these two theories as macro-strategies aimed to understand the software at a more global level. In the systematic macro-strategy, the programmer traces the flow of the whole program and performs simulations as all of the code and documentation is read. However, this strategy is less feasible for larger programs. In the more commonly used as-needed macro-strategy, the programmer looks at only what they think is relevant. However, more mistakes could occur since important interactions might be overlooked.
Program Comprehension
Researchers have conducted many studies to observe how programmers understand programs. As a result, several cognitive models of program comprehension strategies have been proposed to describe the behavior of these programmers.
2.1 Strategies Bottom-up. Shneiderman [30] proposed that programs are understood bottom-up, by reading source code and then mentally chunking low-level software artifacts into meaningful, higher-level abstractions. These abstractions are further grouped until a high-level understanding of the program is formed. Pennington [23] also observed programmers using a bottom-up strategy initially gathering statement and controlflow information. These micro-structures were chunked and cross-referenced by macro-structures to form a program model. A subsequent situation model was formed, also
Integrated approaches. Von Mayrhauser and Vans [41] combined the top-down, bottom-up, and knowledge-based approaches into a single metamodel. They proposed that understanding is built concurrently at several levels of abstractions by freely switching between the three comprehension strategies. 2
to improve the navigability of the software [24]. Typography plays a significant role in the usefulness of these textual visualizations. Many tools present relevant information in the form of a graph where nodes represent software objects and arcs show the relations between the objects. This method is used by PECAN [27], Rigi [22], VIFOR [26], Whorf [16], CARE [19], Hy+ [21] and Imagix 4D [14] tools. Other tools use additional pretty printing techniques or other diagrams to show structures or information about the software. For example, the GRASP tool uses a control structure diagram to display control constructs, control paths and the overall structure of programming units [9]. This section describes three program understanding tools in detail that we studied in the user experiment.
Von Mayrhauser and Vans [41] combined Soloway’s topdown model with Pennington’s program and situation models. In their experiments, they observed that some programmers frequently switched between all three of these models. They formulated an integrated metamodel where understanding is built concurrently at several levels of abstractions by freely switching between the three comprehension strategies.
2.2 Factors affecting comprehension strategies Most researchers realize that certain factors will influence the comprehension strategy adopted by a programmer [35, 39]. These factors also explain the apparently wide variation in the comprehension strategies discussed above. The variations are primarily due to:
3.1 Rigi
differences among programs, �
aspects of the task at hand, and �
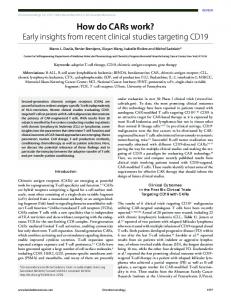
Rigi is a program understanding tool that supports a reverse engineering approach consisting of parsing and discovery phases [22]. Parsing the subject source code results in a flat resource-flow graph that is manipulated and explored using a graph editor. The subsequent discovery phase is semi-automatic and involves pattern-recognition skills and domain knowledge, where the reverse engineer identifies subsystems in the flat graph that form meaningful abstractions. These subsystems can be recursively collapsed to build a layered hierarchy. This hierarchy serves as a backbone for navigational purposes in the tool. In Rigi, a subsystem containment hierarchy is presented using individual, overlapping windows that each visually display a specific slice of the hierarchy. Overview windows show the subsystem hierarchy in a tree-like form, with arcs between levels to show containment. Children windows show the children nodes contained in a subsystem. Projection windows flatten a (sub)hierarchy into a single view. Nodes and arcs in these windows can be filtered by type, and they can be selected by name and highlighted using a search dialog. However, Rigi does not directly support searching through the source code text. Node and arc information windows provide a detailed report of local dependencies and neighboring nodes. Text editor windows can be opened for certain low-level nodes to show the relevant source file, positioned to the start of the appropriate code fragment. The windows are all distinguished by labels in their title bars. Figure 1 shows some of the window types and tools in Rigi. Rigi’s main focus is its support for uncovering subsystem abstractions and the creation of subsystem hierarchies This information can be used as a form of documentation for subsequent program understanding during software maintenance. In the experiment described in this paper, we considered how Rigi could be used for browsing previously composed hierarchies of subsystem abstractions.
varied characteristics of programmers. To appreciate how programmers understand programs, these factors must be considered [35]. These factors are further explored in Section 4 within the context of our experiment. With experience, programmers “know” which strategy is the most effective for the given program and task. A change of strategy may be needed because of some anomaly of the program or some peculiarity of the requested task. Program understanding tools should enhance or ease the programmer’s preferred strategies, rather than impose a fixed strategy that may not always be suitable. The next section describes three tools which can be used to browse source code for program understanding and software maintenance purposes. �
3
Program Understanding Tools
Understanding a software program is often a difficult process because of missing, inconsistent, or even too much information. The source code often becomes the sole arbiter of how the system works. Many software visualization and browsing tools provide information that is useful for program understanding. Software visualization tools use graphical and textual representations for the navigation, analysis and presentation of software information to increase understanding [25]. For instance, several software visualization tools show animations to teach widely used algorithms and data structures [2, 7, 6, 8, 29, 34, 36]. Another class of tools shows the dynamic execution of programs for debugging, profiling and for understanding run-time behavior [15, 28]. Other software visualization tools mainly focus on showing textual representations, some of which may be pretty printed to increase understanding [1, 13] or use hypertext in an effort 3
Figure 1: The Rigi System.
4
Figure 2: A SHriMP View.
5
3.2 SHriMP views
variables, etc. These symbols can be filtered by name in the lists. The Source Editor window displays a view of the source code with coloring of some syntactic constructs. The Cross Referencer window displays a dependency tree of what a symbol refers to or is referred by. The Retriever window displays the result of a textual search through the source code. To manage the many windows, a user can reuse an existing window; to avoid reusing a window, the user can “freeze” its contents by clicking a checkbox on the window. The windows are all distinguished by labels in their title bars and differences in interior layout. Figure 3 shows some of the window types and tools available in SNiFF+.
For exploring software, the SHriMP visualization technique [37] uses a nested-graph formalism [12] to present the structure of a software system in a single window. A nested graph has composite nodes that contain other nodes, forming a hierarchical structure that can be navigated. These composite nodes typically represent software subsystems and are opened to show their children by double clicking them. In a nested graph, a composite arc represents one or more arcs between lower-level nodes in the hierarchy. A composite arc can be opened by double clicking it to show the constituent arcs (some of which may also be composite). The SHriMP technique integrates fisheye-view [11] and pan+zoom [3] approaches for magnifying nodes of interest in the graph. A fisheye view simultaneously displays both context and detail, with objects of interest magnified and less relevant objects demagnified. The pan+zoom approach allows the user to pan and zoom around the view without distortion, but critical information might be panned off the edge of the view. Then again, some tasks may not need much for contextual cues as the programmer focuses on a welllocalized fragment of program code. As with Rigi, certain low-level software artifacts are tied to specific fragments of source text (e.g., a function body). For SHriMP, however, these code fragments are displayed within the nodes of the nested graph. Moreover, function calls, data type references, and variable references are presented as clickable hypertext links in the fragments. SHriMP integrates this hypertext metaphor for following low-level dependencies with animated panning, zooming, and fisheyeview actions over the nested graph. Consequently, following a link to another function pans and zooms the view so that this function’s code is presented within its node. Alternatively, the user can view the hypertext code using the Netscape Navigator web browser. SHriMP currently lacks a searching tool, has no filtering capability, and is still somewhat unreliable. Figure 2 shows a SHriMP view of a Monopoly program (the test program used in our experiments).
4
User Study
This section describes a user study to evaluate the effectiveness of three program understanding tools on typical, high-level program understanding tasks. This study was conducted at the University of Victoria in Spring 1997.
4.1 Goals We had four main goals in mind. 1. Study the factors affecting the participant’s choice of comprehension strategy (see Section 2.2). 2. Observe whether the three tools would effectively enhance the participant’s preferred comprehension strategies while solving the tasks. 3. Devise a framework for characterizing the more effective tools. 4. Provide feedback for the developers of these and other similar tools.
4.2 Participants For the experiment, 30 participants were recruited from a computer science course on human-computer interaction at the University of Victoria. Five of the participants were graduate students and 25 were senior undergraduate students. Prior to the actual experimental sessions, we asked each participant to complete a questionnaire about their programming experience and relevant domain knowledge.
3.3 SNiFF+ SNiFF+ is a commercial software development environment that provides project management, source code browsing, cross referencing, and searching features [31]. These features are accessed through several integrated tools, each with a window containing menus of options. These tools operate on a symbol table that is generated by SNiFF+ from parsing the source code. The Project Window lists the header and implementation files of the program. The llllll Browser accesses the symbol table to display lists of functions, constants, macros,
4.3 Experimental design Three program understanding tools, Rigi, SHriMP, and SNiFF+ were compared. Each tool interface was tested by asking the participants to complete a series of program understanding tasks under controlled and supervised conditions. The 30 participants were randomly assigned to the three tools. 6
Figure 3: The SNiFF+ Software Development Environment.
7
A two-hour session with each of the participants contained six time-limited phases: orientation (5 min), training tasks (20 min), practice tasks (20 min), formal tasks (50 min), post-study questionnaire (15 min), and post-study interview and debriefing (10 min).
and the experimenter recorded observations. The participant was encouraged to “think-aloud” as they did the tasks. The formal tasks were designed to be typical of what a maintenance programmer would be asked to do. Also, these tasks were distinctly different and somewhat broader than the training and practice tasks. We did not want the participant to merely mimic a similar solution from a previous task. After all, we were interested in observing how the participant would choose to solve these tasks with the assigned tool. These observations are reported in Section 5.
Orientation The experimenter began the experiment by briefly orienting the participant. Each participant was reminded of the purpose of the experiment—to evaluate the effectiveness of a program understanding tool. The participant would also learn some basic features of a tool to help understand software. The different phases of the session were outlined and the participant was assured that the collected information would remain anonymous. Also, we mentioned that the participant should not feel undue pressure to produce the “right” answer or feel rushed to finish all the tasks in the limited time. We were more interested in observing how the given tool was used to solve a particular task.
Questionnaire Upon finishing the formal tasks, the participant was asked to complete a brief usability questionnaire. The questionnaire consisted of 15 questions in five sets of three. The questions in a set were actually subtle rewordings of each other, a commonly used technique to offset the chance that a subject might misinterpret a question and supply an erroneous answer. All the questions were randomly ordered. The sets were designed to gather opinions on:
Training During the training phase, the experimenter demonstrated a predefined subset of the tool’s features—minimal, but enough for the upcoming tasks. Defining a suitable subset of features was necessary. Omitted but available essential features could affect the comprehension strategy of the participant. Too many tool features could overload and disorient the user. We tried to strike a workable tradeoff, taking a flexible approach of explaining convenience features as appropriate to receptive users. Toward the end of training, the experimenter demonstrated how to solve some simple queries such as finding all functions called by main() in a small C program.
1. overall ease of use, 2. pleasantness of use, 3. confidence in results generated, 4. ability to generate results, and 5. ability to find dependency relationships. The questionnaire also provided a space for general comments. Interview and debriefing Finally, an informal interview was conducted to stimulate the participant into revealing thoughts not expressed while answering the questionnaire.
Practice tasks The purpose of the practice tasks was to allow the participant to become familiar with the tool and its finer points in a freestyle setting. The participant was encouraged to explore and ask questions about the tool. The practice tasks involved using the assigned tool to browse a Hangman program written in C. This program contained 300 lines of code in 12 files. These tasks progressed in difficulty to allow the participant to grasp the tool features and combine them appropriately. For example, one practice task required the participant to discover the purpose of a variable called Errors and to find the functions using this variable.
4.4 Experimenter’s handbook A detailed experimenter’s handbook was written for each tool to provide some consistency and control over the running of each experimental session. General instructions (common to all tools) outlined the structure of the experiment, the rules of conduct, and various procedures to be followed by the experimenter. Tool-specific descriptions contained detailed instructions for each of the experimental phases. For example, the descriptions of the training and practice tasks detailed the features to be taught. Attached to the handbook were forms to be filled out by the experimenter (observations and interview questions) and by the participant (formal task questions and usability questionnaire). A fresh copy of the handbook was used for each session.
Formal tasks During the formal part of the session, the participant performed several tasks on a Monopoly game program. These tasks were videotaped (with the participant’s permission) 8
4.5 Experimental variables
In the following section, we report on some observations from the formal tasks in the study.
This subsection explores some of the factors that would affect the participants’ performance and choice of comprehension strategy in our experiment.
5
Results
In this section, we describe some observations from the formal tasks, an analysis of the questionnaires, and some findings from the interviews.
Test program The formal tasks involved understanding a text-based, Monopoly game program, written in C. This program contains 1700 lines of code in 17 files, with only sparse comments. The control flow of this program is fairly complex, due to some gotos and a table of function pointers for most commands in the game. For Rigi and SHriMP, one of the authors created a subsystem hierarchy for Monopoly using the Rigi graph editor. The subsystems were mostly based on the modularization of the source code into files. Higher-level subsystems were formed to gather related modules together and simplify the graph. The selection of meaningful subsystem names was particularly important.
5.1 Formal Tasks Due to the focus on complex tasks, the most interesting results were in observing how the users performed the program understanding tasks with the assigned tool and the Monopoly program. The formal tasks resulted from a brainstorming session among the experimenters. They were designed without detailed knowledge of the code, and were therefore not tailored to suit the code or the program structure. There were seven tasks in three classes: preparatory (Tasks 1 and 2), high-level program understanding (Tasks 3, 4, 7), and maintenance (Tasks 5 and 6). The terms ”some”, ”many” and ”a few” are used to describe patterns of tool usages and behaviours. Exact numbers were not possible because three users requested not to be videotaped.
Task complexity We tried to devise higher-level program understanding tasks for the formal tasks. Some tasks required the participant to understand part of the program to answer a question about its functionality. For example, one task asked the participant to determine if a certain feature was implemented in the program. Other tasks required a deeper understanding, asking the participant to describe how to change the program to implement a new feature. For example, one task asked the participant to describe how to change a rule in the game. However, since the users did not actually need to make the changes, they could take a nonchalant approach to the maintenance tasks and make educated guesses at the solutions. Observations for most of the assigned tasks are detailed in Section 5.
Task 1: Look at the real Monopoly game until you understand the general concept and rules of the game. Have you played Monopoly before? This task queried the amount of Monopoly knowledge that each user had. All users (except one) were familiar with the game. We did not ask this question in the pre-study questionnaire to avoiding giving a hint that Monopoly knowledge would be useful. Task 2: Spend a while browsing the program using the provided software maintenance tool and try to gain a high level understanding of the structure of the program.
User expertise The level of expertise and skill affects a user’s performance by contributing significantly to understanding a program or learning a tool’s interface. A pre-study questionnaire asked about C programming experience, maintenance experience, number of years as a programmer, experience writing games, etc. However, it has been shown that programming experience does not correlate highly with programming proficiency [40]. Domain knowledge about the Monopoly board game could be an asset by providing useful preconceptions. To strive for consistency across participants, we set up a Monopoly board beside each participant and, if needed, explained the rules of the game. We encouraged them to review the rules and use the board throughout the formal tasks.
For this task, we saw a huge variation in approaches. Some users spent as little as two minutes and then asked to continue with the next task, whereas others happily spent 20 minutes or more browsing the program. Users browsing the program in detail set themselves a task or goal for understanding the program. Interestingly, some users predicted tasks that were to follow. In SNiFF+, one typical approach was to use the Symbol Browser and select the main() function from the list of functions. Once found, the users would read the source code of the function and follow calls to other functions, perusing them to varying levels of detail. 9
Most of the Rigi and SHriMP users spent a few minutes viewing the visual display of the subsystem hierarchy before reading any code. In Rigi, many users started by opening an Overview window to display the hierarchy. Two users noticed that the Play subsystem was the deepest in the hierarchy and guessed that this subsystem would be important. Others thought that the GeneralGlobals subsystem would be important. In SHriMP, the visible subsystems were focal points for further exploration. Of particular interest were the Control, Setup, Play, DataStructures and GeneralGlobals subsystems. Some users would jump quickly to the code, read the code for main(), and follow a few hyperlinks to other called functions, referenced data structures, or accessed variables. Some would then return to a high-level view and open other subsystem nodes to explore details in other parts of the hierarchy.
Task 4: Does the program support a “computer” mode where the computer will play against one opponent? From Task 3, many users recalled that the getplayers() function prompted for one to nine players. This led many to believe, incorrectly, that the program supported a computer mode. However, most users (with some prodding) decided to check their hypothesis by studying the code further. In SNiFF+ and Rigi, the main strategy was to search for a string such as “computer,” “auto,” or “AI.” One SNiFF+ user looked in the Symbol Browser for a file that implemented the mode. One Rigi user guessed that there might be strings like “your turn” and “my turn.” Since there was no computer mode, these searches did not yield anything useful. Consequently, most SNiFF+ and Rigi users read the code somewhat systematically by following the control flow and looking for clues. The lack of any beacons to support their hypothesis led the users to conclude the mode did not exist. In SNiFF+, there were several ways to get the definition of a called function (some more convenient than others). Typically, users used the Symbol Browser, Retriever, or Cross Referencer. However, most users preferred a hypertext approach of clicking or double-clicking on a function call and jumping to the called function’s definition. They were perplexed that this did not “work.” Actually, this action can be invoked from a menu but was intentionally (and perhaps unfortunately) left off our minimal feature subset for training. In most instances, we taught this convenience feature later in the experiment to avoid any undue frustration. In Rigi, reading code systematically by following the control flow is quite cumbersome. The users had to use the search dialog, enter the name of the called function, click a button to highlight its node, locate that node visually in a crowded Overview window, and double-click the node to open a text editor on the source file containing the function. Going from an artifact in a graph window to its code in a text editor was hard enough; doing the opposite was not even supported. This lack of integration was very annoying to some users. In SHriMP, the lack of a search feature was frustrating for the users. They could not quickly look for a beacon or cue to verify their belief in a computer mode. These users were forced to browse the code and follow function calls systematically. However, this browsing was fairly easy, aided by clickable hyperlinks in the code from function calls to their function bodies. The animated view seemed to help the users maintain a sense of orientation while browsing the program.
Task 3: In the computer game, how many players can play at any one time? In Monopoly, the main() function calls the getplayers() function, which most users examined. The getplayers() function prompts the player to enter a number between one and nine for the desired number of players. The entered number is then compared to MAX PL (a macro defined in the monop.h header file). In SNiFF+, the users looked for MAX PL using the Symbol Browser. However, they often thought that MAX PL was a constant or variable and did not think to check the list of macros. As a last resort, some users used the Retriever to find the definition of MAX PL. The parser used by Rigi and SHriMP to generate the graphs did not emit information about macros. Consequently, there was no MAX PL node in the graph. In Rigi, some users tried to use its name-based selection feature to find a MAX PL node. Since this node did not exist, most users then resorted to searching for “*.h” nodes and opening the corresponding header files one by one. They skimmed or searched through each file to find the MAX PL macro. Most users had difficulties seeing the highlighted “*.h” nodes in the Overview window, because of the small size of the nodes. Rescaling the nodes larger was a cumbersome action in Rigi. In SHriMP, the users also wanted to search for the definition of MAX PL and thus found the lack of a search tool frustrating. Without a search tool, the users resorted to picking out the nodes that represented header files. This process was feasible since there were only 17 files and a few header files. Some users said that there should have been a hyperlink from the occurrence of MAX PL to its definition. However, the parser could not produce this information for the hypertext generator.
Task 5: There should be a limited total number of hotels and houses; how is this limit implemented and where is it used? If this functionality is not currently implemented, would it be difficult to add? What changes would this enhancement require? 10
jail lose their citizenship. A high-level solution is that when a player lands on a property with houses or hotels, check if the property’s owner is in jail. Therefore, to fulfill this task in more detail, two pieces of code needed to be located:
In the real Monopoly game, there are 32 houses and 12 hotels. The limited total number of houses can be used by seasoned players in their playing strategy. For example, by using up all the houses and not building hotels, other players may be prevented from getting houses for their properties. This task was particularly interesting since these limits were not implemented in the program. Also, hotels were implicitly represented as five houses, making the required changes more difficult than first expected by the users. The participants first looked for some evidence of the total limits. In SNiFF+, this involved searching for strings such as “max,” “house,” and “hotel” in the source text. A few users exploited their Monopoly knowledge and searched for “32” and “12.” In SNiFF+, the Retriever returned 62 matches for “house,” but only one for “hotel” (in a printf() string). The users quickly realized that the hotel limit was likely not implemented. When the search strategy failed to quickly produce an answer, the users switched to looking at header files for possible hints, such as related constants or macros. When no limits were clearly evident, the users resorted to browsing the source code systematically. A similar initial process occurred for the Rigi users. In SNiFF+, the users browsed the houses.c file, which seemed appropriate for finding the house limit since it contained the functions buy houses() and buy h() for buying houses. However, one or two users did not immediately think of browsing houses.c and became frustrated trying to find any relevant code. In Rigi and SHriMP, the subsystem called Buying&Selling was an important cue, which most users noticed. The Rigi users spent a lot of time looking at nodes in the Overview window and opening Children windows, whereas the SHriMP users found the relevant nodes more quickly. This was perhaps due to easier navigation in SHriMP and because Rigi hides node labels by default in Overview windows. The Buying&Selling subsystem contained a House subsystem, which in turn contained the buy houses() and buy h() function nodes. Once the users found the house buying functions, they were easily able to suggest the appropriate changes in fairly general terms. However, most users failed to mention that the code for selling houses (and breaking up hotels) would also need to be considered.
1. code to determine if a player is in jail (and not just visiting), and 2. code to track a player’s position on the board. We saw two basic approaches used to solve this task, with some looking for jail related code first and others looking for player position code first. We suspect the ordering of words in the task or user experience with board game programs had an effect. A common mistake was that many users proposed checking whether the currently active player was in jail (and perhaps checking if other players land on his properties). Some realized this approach was wrong and switched to the highlevel solution above. By this stage in the tasks, most users understood that the program contained a player data structure. Many guessed that there would be a field to record if a player was in jail. There were actually two related fields: in jail and loc. Many users mistakenly suggested that the in jail variable be used. However, this variable counted the number of turns that a player had been in jail and did not accurately reflect whether the player was in jail. The loc field should have been compared to a macro called JAIL to test if a player was truly in jail. Very few users noticed this subtlety. Many users correctly guessed that they needed to find the rent functions, to add a condition for not paying rent to a user in jail. The change needed to be added to the rent() function defined in the rent.c file. The top of this function already has a condition for not paying rent when the owner of the property has the property mortgaged. Some users realized the similarity of this condition with the necessary change. In SNiFF+, the rent.c file was evident in a file listing. In Rigi and SHriMP, however, the Rent subsystem was perhaps poorly placed in the Buying&Selling subsystem (or the latter poorly named). Placing the Rent subsystem higher in the hierarchy might have helped. Interestingly enough, this did not seem to unduly impact these users (perhaps challenging the importance of higher-level subsystems for relatively small programs). In SHriMP, the users browsed the Moving subsystem, zoomed into the show move() function code, then followed a hyperlink to rent(). In Rigi, the users searched for the rent() function by name.
Task 6: Where and what needs to be changed in the code to implement a new rule which states that a player in jail (and not just visiting) cannot collect rent from anyone landing on his/her properties? As people play Monopoly, they may follow popular variations to the official rules [4]. Implementing such a variation in the program would be a realistic maintenance task. This task asks the user to implement a variation where players in
Task 7: Overall, what was your impression of the structure of the program? Do you think it was well written? 11
The answers to this task were varied, partly due to the mixed skill levels of the users. Many Rigi and SHriMP users perceived the subsystem hierarchy as an intrinsic aspect of the program itself (not partly fabricated). They made comments like “everything was where I thought it should be” and “the subsystems had very logical names.” Some users were appalled at the presence of gotos and function pointers and the absence of comments. Without subsystem abstractions, the SNiFF+ users tended to focus on the file structure and coding style.
although the Project Window partly provided this feature in a textual listing. For Rigi, some users said they liked the ability to select nodes by name, but wanted to search through the source code as well. Some liked the various overview and subsystem views for showing a graphical overview of the system and the projection view for seeing low-level dependencies in a single window. However, the overview window of tiny nodes was found too dense; better automatic scaling, highlighting, and layout capabilities were requested. A few users desired better feedback when a view was already open, such as automatically bringing certain windows to the front rather than opening another copy. A few users had difficulties understanding the significance of the different colors used to distinguish node types. One user suggested using icons for nodes and another wished for a color legend for the node types. For SHriMP, several users mentioned that they appreciated the hypertext-style navigation of code fragments, the hierarchical representation of the subsystems, and the arcs for showing dependencies. A few liked the ability to zoom in to see code and zoom out to see a more global picture. However, a few users felt that the large number of visible arcs was overwhelming and a couple users mentioned that some of the animation effects were overdone. Most SHriMP users wished for a search capability of some sort and a few asked for better filtering. There were a few complaints about the choice or placement of user interface controls to activate an operation (e.g., mouse bindings, menu buttons). As with Rigi, a few SHriMP users wanted to see local variables and macro constants as nodes; this problem is due to the parsing technique we used and is not truly a fault of the two tools. Most users said they would try the assigned tool again if it was improved to address their comments and made readily available. The following section further interprets how the tools enhanced program comprehension.
5.2 Questionnaires The usability questionnaire consisted of user opinions, with each answer on a five point scale from strongly disagree, disagree, neutral, agree, to strongly agree. We discarded the answers from the first user (who used Rigi), because we had modified the questionnaire for the subsequent users (i.e., the scale, some wording, and number of questions). Consequently, for each of the five question sets in the usability questionnaire, there was a sample of 27 answers for Rigi and 30 answers for SHriMP and SNiFF+. We compared the tools pairwise in each set using a two-sample, single-tailed Z test. For ease of use, Rigi was deemed worse than SHriMP (P = 0.004) and SNiFF+ (P = 0.02). For pleasantness of use and confidence in results, the differences were not statistically significant. For the ability to generate results, Rigi was judged worse than SHriMP (P = 0.06) and SNiFF+ (P = 0.05). For the ability to find dependencies, Rigi was considered better than SHriMP (P = 0.06) and SNiFF+ (P = 0.08). In general, the questionnaire analysis showed no significant differences between the SHriMP and SNiFF+ tools.
5.3 Interviews The interviews were particularly useful for collecting information about the finer points of the user interfaces and how they could be improved. The interview and questionnaire comments are important in that they were notable impressions still fresh on the minds of the users. These impressions could serve as useful feedback for the tools’ developers and guide the designers of other tools. For SNiFF+, many users commented that they liked the Retriever, Cross Referencer, and Symbol Browser windows and that the tool was intuitive. However, some users had concerns with the confusing multitude of different windows, the management and reuse of these windows, and the dependencies among the windows. Some users wanted to click or double-click on a function name in the editor as an intuitive hypertext-like way to see the body of the function. Some kind of global module overview was desired by a few users,
6
Discussion
We believe that program understanding tools should support a variety of comprehension strategies, facilitate switching among these strategies, and reduce cognitive overhead when browsing a large software system. In this section, we critique the effectiveness of the tools for supporting program comprehension. In addition, we discuss some of the biases that may have influenced the observed behaviors and describe areas of further research.
6.1 Support for comprehension strategies Preferred comprehension strategies not always supported 12
For all three tools, there were times when the users’ preferred comprehension strategies were not adequately supported. For example, SNiFF+ was more suited to bottomup approaches; few facilities were available for showing higher-level information about the program structure. In Rigi, many users had problems trying to systematically read code and follow the control flow. In SHriMP, the biggest problem was the lack of a searching tool, which was often the desired approach for finding cues or beacons to verify hypotheses.
thumbnail images, serving as a history mechanism to indicate previous paths of interest. Although the code was not readable in the smaller nodes, the code layout, length, indentation, and colored hyperlinks all provided important recognition cues.
6.2 Support for switching between comprehension strategies Of crucial importance is the ability to switch from one comprehension strategy to another. These behaviors have been documented by von Mayrhauser and Vans in [42]. We also observed users frequently switching between a variety of comprehension strategies during our experiments.
Rigi and SHriMP communicated a mental map of the program structure From the answers to Task 7 and other observations, the graphical subsystem hierarchy presented by Rigi and SHriMP was effective at conveying a mental map of the program. Many users mentioned that the presented structure was logical and helped them understand the program. However, we also suspect that by imposing a structure on the Monopoly program, the users perceived it as being more modular than it actually was.
Switching between top-down and bottom-up strategies easier in SHriMP We noticed that the SHriMP tool better supports frequently switching between top-down and bottom-up comprehension strategies. We saw users zooming in and out between the low-level code and more abstract subsystem levels. Zooming out to higher-level views was often done when a user paused to rethink a strategy, to obtain more context, or to switch between subtasks. In Rigi, navigating from a text editor view of the source code to the graphical view of the subsystem hierarchy was not well supported. SNiFF+ was lacking in higher-level, subsystem views.
Naming of subsystems critical in Rigi and SHriMP The naming of subsystem nodes was critical to the effectiveness of Rigi and SHriMP. For example, the Buying&Selling subsystem was an important cue when trying to locate the houses and hotel limits for Task 5. However, a better name for this subsystem might have been Transactions, since it also contained the Rent and Mortgage subsystems. The users found rent-related code by other means in Task 6.
Switching between systematic and as-needed strategies supported in SNiFF+
Expressive searching tools lacking in Rigi and SHriMP
SNiFF+ supported both systematic and as-needed approaches to understanding. SNiFF+ listed all program files in the Project Window, which the user could view one-byone or as-needed (e.g., only the header files). SNiFF+ also listed all the defined functions and data types in the Symbol Browser and allowed easy access to the corresponding source code for systematic or as-needed browsing. The Retriever window allowed the user to search the code for cues to verify current hypotheses. The use of a search may have been opportunistic, but the running of the search itself is a systematic scan of the code. By having all these windows easily accessible, a user could switch between systematic and as-needed strategies to suit the task at hand.
In Rigi and SHriMP, the lack of a searching tool to find text strings in the source code definitely hindered the users. In Rigi, some users mistakenly thought they were searching for strings in the code rather than searching for node labels in the graph. However, the ability to search on node labels was very useful. In contrast, the SHriMP users felt constrained when they could not even search for nodes. Some SHriMP users commented that they could probably do better with a searching tool such as grep. “Sightseeing” behaviors observed in SHriMP We noticed that some SHriMP users tended to sightsee when they navigated to a particular part of the program. They would examine nearby nodes and store that knowledge for later use. This sort of information gathering is reflective of the opportunistic behaviors described by Letovsky. In SHriMP, however, these opportunistic behaviors were augmented by a feeling of “flying” because of the animated effects when moving between nodes. Also, previously browsed SHriMP subsystem nodes acted as important navigational cues. In essence, some subsystems became
6.3 Reducing cognitive overhead For larger software systems, the true strength of a program understanding tool lies in its ability to manage the inherently large amounts of information. Although our test program was relatively small, there were several issues related to managing complexity, minimizing disorientation, and reducing cognitive overhead. 13
amount of information displayed in a single window. The biggest concern was with the large number of visible arcs. This concern increased when composite arcs were opened. The disorientation could have been relieved by the judicious use of filters (if they had been available). Indeed, two of the users suggested that all arcs should be hidden by default. Arcs of a given type or connected to a selected set of nodes should be displayed only upon request. This feature might better support an as-needed comprehension strategy. Improving the access to arcs and effectively managing the opening and closing of composite arcs are areas for future research.
Multiple windows disorienting in Rigi and SNiFF+ Both Rigi and SNiFF+ are capable of representing larger software systems. However, the multiple window approach used by these tools often disoriented the users. The users were faced with the difficult task of accurately conceptualizing and integrating the implicit relationships among the contents of individual windows. In SNiFF+, the reuse of existing windows was not well accepted by some users. They preferred to open new windows and wanted windows frozen by default, but often complained about the multitude of windows that the freezing feature would cause. A few mentioned that this aspect of SNiFF+ would be something “to get used to.”
6.4 Experimental biases
Fisheye views infrequently used in SHriMP There were many practical difficulties in running a study of this complexity. Although we did not entirely prevent experimental biases from arising, we tried to realize, control, and minimize them. In carrying out the study, we used five experimenters. We trained the experimenters in advance of the experiments and encouraged them to follow the handbooks. Despite these efforts, inconsistencies among the sessions run by different experimenters affected the observations. There were a few instances where an experimenter forgot to show an essential feature of a tool, thereby significantly altering the comprehension strategies used. The different personalities of the experimenters would have also introduced a bias. The use of the Rigi and SHriMP tool designers as experimenters introduced yet another bias. For example, one SHriMP user knew the SHriMP designer and worked more intensely with the tool than usual. To reduce these biases, we rotated the experimenters among two or three tools, videotaped the formal tasks for most users, and tried not to reveal the tool designer. Videotaping and think-aloud likely affected user performance [23]. A few users were intimidated by the test situation, and three chose not to be videotaped. Participation in the study was also part of a class assignment. However, the students were not required to participate in the study and could read some papers instead. The wording of a task affected the strategies used. For example, if Task 4 had been reworded to ask the user to verify that there is no computer mode, the strategy used may have been initially more systematic. By hinting that there was a computer mode, coupled with the apparent possibility of a single player game, the users took a more ad hoc approach to try to verify that the mode existed.
Fisheye views were thought to be useful, since they provided the ability to view both detail and context at the same time. Some users did occasionally use the fisheye view method in SHriMP, especially when they wanted to see how a node of interest interacted with the rest of the program. However, we noticed that users often would not use the fisheye view feature. Instead, they zoomed in to see detail and then zoomed out when more context was desired. There could be several reasons for this behavior. First, the hypertext code in the nodes already provided some context through the colored hyperlinks to called functions and referenced data types. Second, the pan+zoom method was efficiently implemented and, therefore, contextual information was just one click away. Third, the SHriMP version used in the experiment did not support multiple focal points (a chief advantage of its fisheye algorithm over pan+zoom). Some users wanted to expand multiple, non-adjacent nodes, but were unable to do so. Finally, we suspect that the fisheye view method is more beneficial when creating subsystem hierarchies, rather than browsing existing hierarchies. For this task, more context is needed when assigning nodes to different subsystems in a subsystem hierarchy. Filtering effective in Rigi and SNiFF+ Both Rigi and SNiFF+ provide the ability to filter irrelevant information in their views. These filters were used very effectively and increased the scalability of these tools considerably. In Rigi, the node labels were filtered in the Overview windows. This reduced some visual clutter, but the labels of important subsystem nodes were also filtered. Consequently, the users had to search for nodes by name to highlight the matching nodes in the Overview, or they had to turn off the node label filter for a selected set of nodes. Some users found this awkward.
6.5 Limitations and Future Work We believe that a statistical analysis of the task answers would not serve our particular goals in this study. There is no single right way for performing the tasks, and attaching
Information overload in SHriMP In SHriMP, many users were overwhelmed by the large 14
views and source code was considered a desirable feature. In some instances, however, the tools hindered the users’ progress. The lack of an effective source code searching tool in Rigi and SHriMP caused some users to change their comprehension approach for some of the tasks. In SNiFF+, insufficient high-level information forced some users to adopt a more bottom-up approach for understanding. In a previous paper, we devised a list of cognitive design elements which should be addressed during the design of a program understanding tool [35]. We hope that these design elements, together with our observations from this experiment and future experiments, will form the basis of a framework for characterizing more effective program understanding tools.
a scale to the variety of possible answers would introduce other biases. Timings for the tasks also cannot be analyzed, since the information required to answer one task may have actually been gathered as the user performed a different task. Many users spent considerable time gathering information as part of Task 1 (see Section 5). This information was subsequently used to answer other tasks. A detailed analysis of the videotaped experiments may be useful. Unfortunately, the poor quality of the videotapes makes this difficult. By trying to discreetly place the camera at a distance from the user, the camera did not always pick up the verbal comments made by the user. In retrospect, we should have used two cameras per session, with one camera aimed at the screen and the other capturing the facial expressions and verbal comments of the user. In usability experiments, however, the most useful information is often gathered from watching users and asking for feedback, rather than analyzing videotaped sessions [17]. Videotapes are suitable for verifying details of particular behaviors. The experiment described in this paper followed a pilot study described in [38]. In future experiments, we will study fewer but more experienced participants as they solve broader software maintenance tasks over a longer period of time. So far we have focused on observing users exploring previously prepared documentation and software hierarchies. A reverse engineer (one of the authors) used the Rigi tool to prepare the software abstractions presented in the Rigi and SHriMP views prior to the experiments. We noticed that the naming of subsystem nodes and the depth of the hierarchy were critical. It would therefore be interesting to observe how tools, such as Rigi and SHriMP, are used for creating software documentation rather than merely browsing previously prepared documentation. Meanwhile, the users’ comments together with our observations from this experiment have resulted in useful feedback for the developers of these and other similar tools.
7
Acknowledgments The authors would like to thank all the subjects for participating in this experiment. Jochen Stier, Greg Kacy, Johannes Martin, and Curtis M¨uller helped to organize and run the experiment. Thanks also go to Jim McDaniel for writing the HTML generator. We are grateful to Ben Bederson for suggestions on how to use Pad++ within SHriMP more efficiently. Finally, comments from Harald Gall and the anonymous reviewers were much appreciated and helped to improve the paper.
References [1] R. Baecker and A. Marcus. Human Factors and Typography for More Readable Programs. ACM Press, Addison-Wesley Publishing Company, 1990. [2] R. M. Baecker. Sorting out sorting (16mm film), 1981. ACM SIGGRAPH ’81. [3] B. Bederson and J. Hollan. Pad++: A zooming graphical interface for exploring alternate interface physics. In Proceedings of ACM UIST’94, (Marina del Rey, California), pages 17–26, November, 1994.
Conclusion
This paper reports observations from an experiment to compare three tools (Rigi, SHriMP, and SNiFF+) for browsing program source code and exploring software structure. In this experiment, we considered the factors which affected the participant’s choice of comprehension strategy. Important factors included the program to be understood, characteristics of the tasks to be solved, as well as programming expertise and domain knowledge to be exploited. In general, we noticed that the tools did enhance the users’ preferred comprehension strategies while solving the tasks. For example, the ability to view dependency relationships in all three tools was exploited by most of the users. In SHriMP, the ability to switch seamlessly between high-level
[4] M. Brady. The Monopoly Book: Strategy and Tactics of the World’s Most Popular Game. David McKay Company, Inc., New York, 1974. [5] R. Brooks. Towards a theory of the comprehension of computer programs. International Journal of Man-Machine Studies, 18:543–554, 1983. [6] M. H. Brown. Exploring algorithms using Balsa-II. Computer, May 1988. [7] M. H. Brown. ZEUS: A system for algorithm animation and multi-view editing. In Proceedings of the IEEE 1991 Workshop on Visual Languages, Kobe Japan, pages 4–9, October, 1991.
15
[8] M. H. Brown and M. A. Najork. Algorithm animation using 3d interactive graphics. In UIST, Proceedings of the ACM Symposium on User Interface Software and Technology, pages 93 – 100, November, 1993.
[24] M. Petre, A. Blackwell, and T. Green. Cognitive questions in software visualization. In Software Visualization: Programming as a Multi-Media Experience, pages 453–480. MIT Press, 1997.
[9] J. Cross and S. M. ad T.D. Hendrix. The control structure diagram: An initial evaluation. Empirical Software Engineering, 3(2):131–156, 1998.
[25] B. A. Price, R. M. Baecker, and I. S. Small. A principled taxonomy of software visualization. Journal of Visual Languages and Computing, June 1993.
[10] S. M. Dray. Practical observation skills for understanding users and their work in context. In Presented at CHI (Computer Human Interaction) 1999. May 1999.
[26] V. Rajlich, N. Damaskinos, and P. Linos. VIFOR: A tool for software maintenance. Software–Practice and Experience, 20(1):67–77, January 1990.
[11] G. Furnas. Generalized fisheye views. In Proceedings of ACM CHI’86, (Boston, MA), pages 16–23, April, 1986.
[27] S. Reiss. Pecan: Program development systems that support multiple views. IEEE Transactions on Software Engineering, SE-11(3):276–285, March 1985.
[12] D. Harel. On visual formalisms. Communications of the ACM, 31(5), May 1988.
[28] G.-C. Roman, K. C. Cox, C. D. Wilcox, and J. Y. Plun. Pavane: A system for declarative visualization of concurrent computations. Technical Report WUCS-91-26, Washington University, St. Louis, April, 1991.
[13] T. Hendrix, J.H. Cross II, L. Barowski, and K. Mathias. Tool support for reverse engineering multi-lingual software. In Proceedings of the 4th Working Conference on Reverse Engineering (WCRE’97), Amsterdam, The Netherlands, pages 136–143, October 1997. [14] Imagix 4D. Imagix http://www.imagix.com/index.html.
[29] P. Schorn, A. Brungger, and M. de Lorenzi. The XYZ Geobench: Animation of geometric algorithms. In M. H. Brown and J. Hershberger, editors, Animations for Geometric Algorithms: A Video Review, Palo Alto, California, 1992. Digital Systems Research Center.
Corporation.
[30] B. Shneiderman. Software Psychology: Human Factors in Computer and Information Systems. Winthrop Publishers, Inc., 1980.
[15] S. Isoda, T. Shimomura, and Y. Ono. VIPS: A visual debugger. IEEE Software, May 1987. [16] M. S. K. Brade, M. Guzdial and E. Soloway. Whorf: A visualization tool for software maintenance. In Proceedings 1992 IEEE Workshop on Visual Languages, (Seattle, Washington: Sept 15-18,1992), pages 148–154, 1992.
[31] SNiFF+ 2.3. User’s Guide and Reference, TakeFive Software. http://www.takefive.com, December, 1996. [32] E. Soloway and K. Ehrlich. Empirical studies of programming knowledge. IEEE Transactions on Software Engineering, SE-10(5):595–609, September, 1984.
[17] T. K. Landauer. The Trouble with Computers: Usefulness, Usability, and Productivity. A Bradford Book, MIT Press, 1995.
[33] E. Soloway, J. Pinto, S. Letovsky, D. Littman, and R. Lampert. Designing documentation to compensate for delocalized plans. Communications of the ACM, 31(11):1259–1267, 1988.
[18] S. Letovsky. Cognitive processes in program comprehension. In Empirical Studies of Programmers, pages 58–79. Ablex Publishing Corporation, 1986.
[34] J. T. Stasko. Tango: A framework and system for algorithm animation. IEEE Computer, September, 1990.
[19] P. Linos, P. Aubet, L. Dumas, Y. Helleboid, P. Lejeune, and P. Tulula. Visualizing program dependencies: An experimental study. Software–Practice and Experience, 24(4):387–403, April 1994.
[35] M.-A. Storey, F. Fracchia, and H. M¨uller. Cognitive design elements to support the construction of a mental model during software visualization. In The Proceedings of the 5th International Workshop on Program Comprehension (IWPC’97), Dearborn, Michigan, pages 17–28, May, 1997.
[20] D. Littman, J. Pinto, S. Letovsky, and E. Soloway. Mental models and software maintenance. In Empirical Studies of Programmers, pages 80–98. Ablex Publishing Corporation, 1986.
[36] M.-A. Storey, F. D. Fracchia, and S. Carpendale. A top down approach to algorithm animation. Technical Report CMPT 94-05, Simon Fraser University, Burnaby B.C., Canada, September, 1994.
[21] A. Mendelzon and J. Sametinger. Reverse engineering by visualizing and querying. Software – Concepts and Tools, 16:170–182, 1995.
[37] M.-A. Storey, H. M¨uller, and K. Wong. Manipulating and documenting software structures. In P. Eades and K. Zhang, editors, Software Visualization, pages 244–263. World Scientific Publishing Co., Fall 1996.
[22] H. M¨uller and K. Klashinsky. Rigi — A system for programming-in-the-large. In Proceedings of the 10th International Conference on Software Engineering (ICSE ’10), Singapore; April, 1988, pages 80–86, April 1988.
[38] M.-A. Storey, K. Wong, P. Fong, D. Hooper, K. Hopkins, and H. M¨uller. On designing an experiment to evaluate a reverse engineering tool. In Proceedings of the 3rd Working Conference on Reverse Engineering (WCRE96), Monterey, California, pages 31–40, November, 1996.
[23] N. Pennington. Stimulus structures and mental representations in expert comprehension of computer programs. Cognitive Psychology, 19:295–341, 1987.
16
[39] S. Tilley, S. Paul, and D. Smith. Towards a framework for program understanding. In WPC’96: 4th Workshop on Program Comprehension, Berlin, Germany, pages 19–28, March, 1996. [40] I. Vessey. Expertise in debugging computer programs: A process analysis. International Journal of Man-Machine Studies, 23:459–494, 1985. [41] A. von Mayrhauser and A. Vans. Program comprehension during software maintenance and evolution. IEEE Computer, pages 44–55, August 1995. [42] A. von Mayrhauser and A. Vans. From code understanding needs to reverse engineering tool capabilities. In Proceedings of CASE’93, Singapore, pages 230–239, July, 1993.
17