reader to interpret and gain meaning from the data using only their visual sense. In our research we ... SonicData is a bespoke device that represents the dataset by playing sonic tones at ..... aspects determine a software's appeal. In: Proc. of ...
How Does Representation Modality Affect UserExperience of Data Artifacts? Trevor Hogan and Eva Hornecker Dept. of Computer and Information Sciences, University of Strathclyde, Glasgow G11XH, UK {trevor.hogan, eva.hornecker}@strath.ac.uk
Abstract. We present a study that explores people’s affective responses when experiencing data represented through different modalities. In particular, we are interested in investigating how data representations that address haptic/tactile and sonic perception are experienced. We describe the creation of a number of data-driven artifacts that all represent the same dataset. In taking a phenomenological approach to our analysis, we used the Repertory Grid Technique (RGT) during a group session to elicit participant’s personal constructs, which are used to describe and compare these artifacts. Our analysis examines these, traces the emergence of one exemplary personal construct and highlights other emergent themes. Our findings consist of a number of elicited constructs that illuminate how the affective qualities of data driven artifacts relate to the type of modality in use. Keywords: Data Representation, Modality, Phenomenology, Repertory Grid Technique, User Experience.
1 Introduction In contemporary society, data representations are an important and essential part of many aspects of our daily lives. Representations in the form of demographic statistics, financial reports, environmental data, economic trends and others are being widely distributed by the media, which compete for people’s attention and comprehension. The vast majority of these use the visual modality to represent the data, requiring the reader to interpret and gain meaning from the data using only their visual sense. In our research we examine the user experience, and in particular, the affective responses to data represented using a range of modalities. Our work is motivated by recent literature that emphasizes the felt experience of interaction [1], as well as the re-emergence of phenomenology within the HCI community, as an approach to better understand peoples’ experience of technology (cf. [2]). Phenomenology, from a philosophical perspective, is concerned with people’s lived experience of the phenomena that is being researched. From a methodological perspective, it demands a process that emphasizes the unique subjective experiences of research participants. Don Ihde eloquently defines it as an investigation into “the conditions of what makes things appear as such” [3]. In the context of our research we take a phenomenological approach to capturing the first-hand experience of participants’ engagement with
data-driven artifacts. Our research is inspired by the emergence of data visualisation subfields that include: Information Aesthetics [4], Artistic Visualization [5], Data Art [6] and Casual Visualization [7]. It is based on the assumption that representing identical datasets through different modalities may support a different user experience and affective response. In particular, we are interested in investigating how representations that address haptic/tactile and sonic perception are experienced, and in exploring the particular strengths of these modalities [8]. By representing the data through haptic and auditory feedback we anticipated that this would offer an opportunity to gain insight into people’s experience of feeling and listening to data, in contrast to simply viewing data representations. We here present an explorative user study conducted as part of this larger research agenda. Three data representations were developed, each focusing on different perceptual modalities. We ran a focus group based on the Repertory Grid Technique [9] to assess participants experience and responses to the three data-driven artifacts. We used an inductive and grounded approach for analysing the outcome of the RGT study (participants comparison of the representations along self-chosen categories) as well as the process of the session.
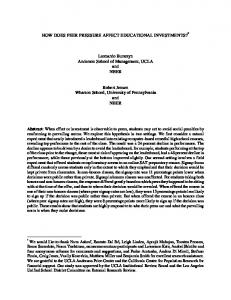
2 Data Artifacts As a first step, we selected a data source to be represented. The main criteria was that it must be socially relevant and from a trustworthy source. A number of datasets were identified that included economic, environmental, demographic and geographical data. From these we selected a dataset that represents the latest global urban outdoor air pollution figures from almost 1100 cities in 91 countries. For our study, the annual mean PM10 ug/m3 for six countries (Greece: 44, Ireland: 15, India: 109, Egypt: 138, United Kingdom: 23 and Turkey: 66) was used and all the data-driven artifacts produced represented this same dataset [10]. Our RGT study utilizes the ‘triad’ technique, which involves participants identifying a quality dimension of three given objects, such that two of the objects are similar in some way and the third is relatively dissimilar [9]. For this reason, three modalities were identified and an artifact was produced for each. These are: SonicData (auditory modality), DataBox (cross-modal (haptic and auditory)) and a Bar Graph (visual modality). Besides using different representational modalities, two of the artifacts (DataBox and SonicData) require active manipulation to elicit information, whereas the Bar Graph only requires the participants to look at it. Also, SonicData and the Bar Graph both use a single modality to represent the data, with SonicData utilizing an alternative modality to the ‘standard’ visual modality. DataBox is defined as employing cross-modal output. Cross-modal output, in the context of this research, uses more than one modality to represent the same data. Its use of the different senses allows the characteristics of one sensory modality to be transformed into stimuli for another sensory modality [11]. SonicData is a bespoke device that represents the dataset by playing sonic tones at certain frequencies through a tactile interface. Users of SonicData are presented with
Fig. 1. Data-driven artefacts. Left: SonicData, Middle: DataBox, Right: Bar Graph
a labelled surface and a small coloured wooden cube. Placing the cube over each label plays a tone in a frequency representing the urban air pollution of this country. The tones’ frequency is mapped to the level of air pollution; high pollution results in a high frequency sound and low pollution will result in a low sound, e.g. 1380 Hertz (Egypt) and 150 Hertz (Ireland). DataBox is a wireless cube device (10cm3) created for this study, which represents the dataset through haptic and auditory feedback. The six faces of the cube represent the six countries of the dataset. When the user hovers each face over a scanning station, an LCD display located within this station shows the name of the selected country. DataBox immediately responds by knocking on the internal walls. The rate of knocks corresponds to the level of air pollution, e.g. 15 times per minute (Ireland) and 138 times per minute (Egypt). DataBox consists of a microcontroller and 12-volt solenoid housed inside a hollow wooden box, and has RFID tags on the inside of each face. When hovering the box over a RFID reader it reads the closest tag, sends a message to the LCD, and wirelessly transmits a message to the microcontroller that controls the knocking. Bar Graph. This representation utilized a common and recognisable format. The graph (42cm x 21cm) was labelled with the names of the six countries on the x-axis and the data was represented using solid black bars on the y-axis. We were conscious that including such a recognisable format may influence the participants responses, especially considering the unique nature of the other artifacts. However, the rationale for including such a standard format was to remind the participants that they were interacting with artifacts that serve the purpose of representing raw datasets.
3 Study Methodology Early on, the RGT method was identified as a useful tool for dealing with userexperience and affective evaluation [12]. Although its use within the HCI research community peaked in the early eighties (for a historical overview, see [12]), recently we have seen a resurgence of interest in this technique [13, 14, 15]. It was initially developed as a clinical psychological method to empirically elicit and evaluate people’s subjective experiences and meaning structures [16], and methodologically extends George Kelly’s Personal Construct Theory (PCT). PCT is based on the assumption that human beings shape their understanding and meaning of
the world by drawing upon past interactions and personal experiences. It states that our view of the objects, people and events we interact with is made up of a collection of bipolar dimensions, referred to as a personal construct [16]. For instance, we may judge an event in our lives as being happy—sad, uplifting—boring, memorable— forgetful and so on. Therefore a personal construct is a bipolar dimension of meaning for a person allowing them to compare two or more elements. Kelly suggested the RGT as a method to systematically elicit these personal constructs. In a traditional application of the RGT the researcher presents participants with elements in groups of three. Once they have become familiar with the elements they must identify where two of the elements are similar (Convergent pole) but dissimilar from the third element (Divergent pole). What emerges is a bipolar dimension (personal construct). Using this bipolar dimension, the participant is asked to rate all the elements on a 5-7 scale (1: Convergent pole, 7: Divergent pole). Due to its flexibility, the RGT has been used in a wide range of fields from clinical psychology to architecture. The RGT has also been proven to be a valuable technique in phenomenological studies to understanding user experience and for understanding the perceived qualities of computational objects [2, 17]. One of the main reasons why the RGT is useful for this purpose, is that it provides an established method for eliciting user’s personal constructs, in distinction to other methods such as semantic differential, which is usually based on predefined, given constructs [18]. The vast majority of published research that has used the RGT method was conducted by individually interviewing a number of participants (normally 8-15) for 1-2 hours each [9]. The approach taken for our study differs by eliciting personal constructs from participants during an open group discussion, which would later be transcribed and analysed. The effort involved for both participants and researcher in individual interviews is one of the main known disadvantages of the RGT [12], and a group study reduces the cognitive workload for all involved. On the other hand, there are well-known problems with group discussions, such as peer influence and smaller sample size. However, we believed that in this particular case, this approach would allow us to observe participants discussing amongst each other in a natural situation where expressing their thoughts would be part of natural social interaction. The participants were all final-year digital media students and members of the same class and already accustomed to discussing topics in front of one another during group critiques. 15 individuals (11 male, 4 female) participated in the study, with a mean age of 22 years (Min = 19, Max = 24). It was a conscious decision to involve a group of participants who know each other well and would feel comfortable discussing their personal experiences in front of the group. The study entailed, firstly, dividing the group into three subgroups. The subgroups then had 15 minutes to engage with each of the data artifacts (45 minutes in total). This was followed by a group discussion, which involved all subgroups and was facilitated by a researcher. The entire study took place in a large room and was recorded using three video cameras directed at each artifact and three digital audio recorders positioned alongside each artifact. Subsequently transcripts were produced from audio files recorded during the familiarisation sessions.
3.1 Procedure As this study adapted the RGT, the following sections briefly describes the steps followed during a typical RGT study, and then highlights the variations to these while conducting our study. For the purposes of this study, three artifacts were pre-selected and created by the researchers, providing the ‘elements’ (RGT terminology) to be examined. Participants are made familiar with the elements before the phase of construct elicitation begins. An RGT study would normally conclude by having the participants rate each of the elements on a 5-7 scale for each construct. Our study did not include this stage, as the main objective was to reveal the emergence of these constructs through an inductive approach to the analysis. Element Familiarization: This stage allows for the participants to become familiar with the elements used in the study. The researcher typically introduces each participant to the elements and allows some time to interact with these. Generally this study stage is quite informal and not treated as of critical importance. However, for the study presented here this stage was central. Following a short introduction to the three data artifacts by the researcher, all participants were allowed 45 minutes to interact with them. The participants were divided into groups of four, spending fifteen minutes interacting with each data artifact before moving on to the next in a roundrobin pattern. All groups were encouraged to openly discuss their perception and experience as well as discussing the pertinent qualities of the artifacts with each other.
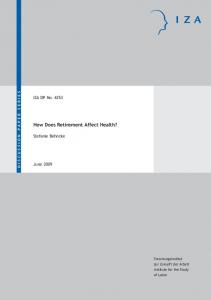
Fig. 2. Group session to elicit personal constructs from individuals.
Construct Elicitation: During this stage, participants are normally interviewed individually to elicit personal constructs. Instead, for our study a group discussion was conducted (fig. 2.) and mediated by the researcher. The method used was the minimum-context triad form of construct elicitation. From a triad of elements the participants are asked to describe how two elements are similar (Convergent pole) but differ from the third (Divergent pole) [9]. This dimension is the personal construct. The session commenced by asking participants to write down as many personal constructs as they could think of. After a few minutes they were asked to explain their constructs aloud and the group openly discussed each of these. This discussion also generated further new constructs. These were elicited by the researcher ‘laddering’ the discussion by asking participants ‘why’ certain constructs are important to them. Constructs were only recorded if the majority of the participants agreed. This process
was repeated until participants could no longer think of meaningful distinctions or similarities among the triad of artifacts.
4 Findings Our analysis went through four steps, from filtering and collapsing the elicited constructs, over classifying them as ergonomic or experience-oriented (hedonic) to tracing their emergence and finally highlighting major themes exposed during the study. Filtering: In total 35 sets of bi-polar constructs were elicited during the group discussion session. For this analysis, the list was shortened to 27 constructs by collapsing those that were semantically related into one construct. For example we collapsed the constructs Novel and Innovative into the one construct (Novel). Table 1. Personal constructs (Hedonic Quality) elicited during the RGT study, the arrows for each artifacts points to the pole of the dimension. A: DataBox, B: SonicData , C: BarGraph
PC1
Novel
PC2
Experimental
PC3
Instinctual
PC4
Fun, Stimulating
PC5
Warm
PC6
Colourful
PC7
Playful
PC8
Immersive
PC9
Sonic
PC10
Sophisticated
PC11
Intensive
PC12
Strong
PC13
Artificial
DataBox
SonicData
BarGraph
⇐ ⇐ ⇐ ⇐ ⇐ ⇐ ⇐ ⇐ ⇐ ⇐ ⇐ ⇐ ⇐
⇐ ⇐ ⇐ ⇐ ⇐ ⇐ ⇐ ⇐ ⇐ ⇐ ⇒ ⇒ ⇒
⇒ ⇒ ⇒ ⇒ ⇒ ⇒ ⇒ ⇒ ⇒ ⇒ ⇒ ⇒ ⇒
Familiar Traditional Cerebral Dull, Boring Cold Black & White Task-orientated Non-immersive Silent Non- Sophisticated Subtle Weak Organic
Classification: As the objective of the study was to examine the users’ affective responses, we focused the analysis on constructs that demonstrate affective or hedonic qualities (cf. [19]) rather than ergonomic qualities (task-orientated and related to traditional usability principles such as efficiency). Hedonic quality (HQ) comprises quality dimensions with no obvious relation to tasks, such as novelty, innovativeness, attractiveness etc [19]. From the list of 26 sets of constructs, 13 were classified as HQ by two researchers (Table 1). Table 1 illustrates the elicited (HQ) personal constructs (PC1-13) It shows, for instance, that the group characterized both DataBox and SonicData as ‘Novel’ but unlike the Bar Graph which was characterized as being ‘Familiar’ (PC1). They also agreed that SonicData and the Bar Graph should be described as ‘Organic’ whereas DataBox was ‘Artificial’ (PC13).
Tracing: The objective at this stage was to trace the emergence of the hedonic constructs in order to better understand the meaning associated with these constructs. This was achieved by examining the transcribed familiarization and group session as well as field notes taking during and after the study. It is important to note that as part of this study these field notes were an integral element and were already “a step toward data analysis” [20]. For reasons of brevity the exemplar construct that we have chosen to trace here is PC3 {Instinctual—Cerebral}. Table 1 shows that the group agreed that DataBox and SonicData should be described as Instinctual whereas the Bar Graph was described as Cerebral. This reliance on instinct was evident during the Familiarisation Session. While interacting with the DataBox and SonicData, the participants were continuously seeking realworld analogies for further insight into the artifacts. On numerous occasions, participants in all four familiarisation sub-groups compared the output from DataBox to the characteristics of living beings. P3: “It’s like a heartbeat”, P2: “It feels like it is dying”, P5: “India is dead”. P7 also remarked that the knocking on the box could be compared to “the pumping of our lungs and the beating of our heart”. The participants also used real-world analogies while using SonicData, however, these tended to be more artificial in nature, for instance in this discussion segment: P3: “Greece sounds like a dialling tone.” P3: “The UK is kind of nice, it sounds like a small ship.” P5 “Yeah, like a sonar”. P2 “No, it sounds like you are dialling a phone.” P1: “Then the high-pitched ones are the highest ones”. During the Construct Elicitation session the group explained this personal construct further by describing the graph as a thing that you have to learn to use. They explained how they have been taught to use bar graphs throughout their education and they see them merely as tools; one remarked “You can tell instantly which is the worst of which is the best - there is no confusion, you do not have to look any further”. The mapping used in the other artifacts, however, were new to the participants. They spoke about not having any prior training in the use of these and having to rely on their instinct to understand what the output represented. Themes. {Linguistic} An interesting theme that emerged from the study was that the language used by participants while interacting with the DataBox and SonicData was, in general, more emotive than with the Bar Graph. There was frequent use of expressive descriptions such as: annoying, hurts, beautiful, healthy, alarming, relaxing, dead, urgent, fun, torture, irritating and intense; used in relation to the DataBox and SonicData that was not evident in the conversations about the Bar Graph. {Consequences verses Implications} It was also found that the three sub-groups discussions of the Bar Graph during the familiarisation session generally related to discussing and speculating about the causes of pollution, whereas discussions around the other artifacts generally related to the effect that poor pollution has on the inhabitants of the countries. This is highlighted in the following extract from the familiarization session: [Bar Graph] P1 …It looks like poorer countries have more pollution than richer countries. P2 yes P3 but why is Egypt more polluted than India? P2 but isn't India poorer P3 that has got nothing to do with the air? P2 but generally poor countries are more polluted as they have so many people there…
[SonicData] P3: “… the sound of each is so annoying” P4: “imagine living in Egypt, it would be pretty annoying to have such pollution also” P5: “as well as India”. P5: “Greece is by far my most favorite one” P2: “No, mine is the United Kingdom”…. [DataBox] P2: “… that could be healthy Ireland?” P1: “Healthy Ireland! No, cause if my heart was beating that slow I would be almost dead.” P3: “Yes, but what we are feeling at the moment is Egypt.” P2: “Yeah, but that feels healthy.” P3: “Yeah, that sounds good, it sounds like progress, it sounds like it’s going well…” {The Felt Dimension} Another theme to emerge was the participants’ way of phrasing how they experienced and interpreted the data artifacts. When using the DataBox they talked about ‘feeling’ the data and associated it with a human-heartbeat. On occasions when the frequency of knocks decreased, the participant holding the DataBox remarked that they felt the country was ‘dying’. Affective responses were also evident with SonicData. Participants described some of the sounds as being ‘annoying’ or ‘painful’ and equated unpleasant sounds with increased pollution. {Rating} Also, in relation to SonicData, the participants spoke about which sound was their favorite, and used this as an attempt to map the least and most polluted countries. The following exchange exemplifies this: P1: “I like that one the best [Greece].” P2: “I like that one [UK].” P1: “What's next, Turkey, India and Egypt.” P3: “Think about it though, what is the nicest to listen to?” P5: “Greece is nice.” P3: “I like the UK.” P2: “The lower ones are nice so the pollution must be low.” P1: “Yes, I like the lower ones.” P5: “My favorite’s Greece.” These behaviors may be interpreted as the participants’ affectively responding to the DataBox and SonicData in a manner that was not evident with the Bar Graph. While we did expect the responses from the DataBox and SonicData to be more extreme than the Bar Graph, given this format does not leave much space for interpretation, the acute difference in the style of language used by the participants to describe their experience was noticeable and somewhat unexpected. The affective response to DataBox and SonicData is furthermore reflected in Table 1, where participants tended to associate these more often with what could be considered the more emotional and fun-related pole of a construct (e.g. primal, fun, warm, playful, immersive). Interestingly, SonicData was considered artificial (and not organic). Other Observations. During the familiarisation session we observed a distinct difference in how the three sub-groups situated themselves and moved around the artifacts. While interacting with DataBox and SonicData the members of a group were continuously switching positions in order to interact with the artifacts but also to observe others interacting with the artifacts. This was not evident with any group at the Bar Graph. In this case, all members of a group stood motionless in front of the graph until they were asked to move to another artifact. We also noted that when a member of the group talked about DataBox and SonicData that the other members sought to maintain eye contact throughout the discussion. This could be described as an attempt to discover more about what others were saying and feeling as they used the artifacts. Conversely, when the groups were viewing the Bar Graph they tended to consistently look at the graph, even when other members were speaking. In this case,
the choice of representation might contribute to this behaviour pattern – the Bar Graph representation has an orientation, and even if it would be on a piece of paper on the table, it would not be as easy for the group to surround it as this was for the other two data artifacts. While there is evidence which supports the case that representing data using nonvisual artifacts evokes more affective responses, we also observed that the participants had some difficulty mapping the data to the artifact output, for example whether frequent knocking (DataBox) represented a high or low rate of pollution. In the early stages of the session participants spent some time discussing this issue. However, once consensus was met, the conversation soon switched to issues related to the source of the dataset. In the future we would consider supplying a legend with the non-traditional data representations in order to allow the users to concentrate on the artifact as opposed to the mapping.
6 Conclusion and Discussion This paper presented a study that investigated users’ affective responses when experiencing data represented through different types and levels of modalities. We explored this by conducting an adapted RGT group study using three data-driven artifacts. During a group session with 15 participants, 35 personal constructs were elicited. For the purpose of analysis this list was shortened to 13 that demonstrated a hedonic quality. It is clear from this list that the participants perceived DataBox and SonicData as being more similar than the Bar Graph. Apart from the obvious novel characteristics of these artifacts over the familiar format of the Bar Graph, we also believe that the interactive quality of these artifacts influenced the participants to see them as more alike. In the analysis we chose one personal construct {Instinctual—Cerebral} and traced its emergence using field notes and transcriptions from the group session. This analysis reveals that the participants relied heavily on instinct, previous experiences and real-world analogies to infer data insight and meaning from both DataBox and SonicData. Conversely, the participants found that the Bar Graph is a tool they have been trained to use over a long period and thus did not engage them emotionally. They tended to have more abstract, causality-oriented discussions about the content of the Bar Graph, whereas they were more concerned about what the data represented by the DataBox and SonicData would mean for people’s lives, and used more emotive language to describe the data. Our experience has shown that, given a group that is comfortable discussing with each other, a group approach towards RGT elicitation can be useful, in particular in allowing us to trace the emergence of constructs from participants’ direct initial responses to the elements. We intend to further validate this methodological adaption by conducting a series of group and individual studies using the same set of elements. Although the findings require further investigation and analysis, in particular we intend to trace the emergence of further constructs, we believe that we have shown evidence that the modality and modality combinations used to represent data do influence the users’ experience and affective responses.
References 1. McCarthy, J. & Wright, P. 2004. Technology as Experience. The MIT Press. 2. Fallman, D. 2003. In Romance with the Materials of Mobile Interaction: A Phenomenological Approach to the Design of Mobile Information Technology. Doctoral Thesis. Larsson & Co’s Tryckeri, Umea University, Sweden. 3. Ihde, D. 2003. If Phenomenology Is an Albatross, Is Post-phenomenology Possible? In Chasing Technoscience: Matrix for Materiality, ed. Don Ihde and Evan Selinger. Indianapolis: Indiana University Press. 4. Lau, A., Vande Moere, A. Towards a Model of Information Aesthetics in Information Visualization. Proc. of the Int. Conference Information Visualization. 87-92. IEEE (2007) 5. Viégas, F.B., Wattenberg, M. Artistic data visualization: beyond visual analytics. In: Proc. 2nd international conference on Online communities and social computing, 182-191, Springer, Heidelber (2007). 6. Manovich, L., ‘Data Visualization as New Abstraction and as Anti-Sublime’, in Byron Hawk, David Reider, and Ollie Oviedo (eds.), Small Tech: The Culture of Digital Tools, Electronic Mediations, Series 22, Minneapolis: University of Minnesota 2008. 7. Pousman, Z., Stasko, J. T., Mateas, M. Casual Information Visualization: Depictions of Data in Everyday Life. IEEE Transactions on Visualization and Computer Graphics, (2007) 1145-1152. 8. Hornecker, E., Let's Get Physical: The Role of Physicality in Tangible and Embodied Interactions. ACM interactions magazine vol 18, iss.2 (March/April), pp. 19-23. 9. Fransella, F., Bannister, D., Bell, R. A Manual for Repertory Grid Technique. WileyBlackwell. (2003) 10. The Guardian. Global air pollution http://www.guardian.co.uk/environment/datablog/2011/sep/26/global-air-pollutionwho?CMP=twt_fd (accessed: 15th November 2011) 11. Lenay, C., Canu, S., & Villon, P. 1997. Technology and Perception : the Contribution of Sensory Substitution Systems. In: Proc. of Cognitive Technology, 1997. (pp. 44-53). IEEE. 12. Fallman, D., Waterworth, J. A. Capturing User Experiences of Mobile Information Technology with the Repertory Grid Technique. J. Human Technology, Vol. 6, No. 2, (2010) 250-268. 13. Grill, T., Flexer, A., Cunningham, S., Identification of Perceptual Qualities in Textural Sounds using the Repertory Grid Methodology. Proc. of AM’11. ACM. 2011. 14. Cunningham, S. Applying personal construct psychology in sound design using a repertory grid. In: Proc. of the 5th Audio Mostly Conference AM’10, 1-6. ACM, N.Y. (2010) 15. Edwards, H. M., McDonald, S., Young, S. M. Choosing field methods: a reflection on a RepGrid study. In: Proc. of NordiCHI’10. ACM, (2010) 639-642. 16. Kelly, G. A. The psychology of personal constructs. Norton, New York, USA 1955. 17. Introna, L. D., & Whittaker, L. 2002. The phenomenology of information systems evaluation: overcoming the subject/object dualism. In: Proc. of Working Conference on Global and Organizational Discourse about Information Technology (pp. 155-175). 18. Gable, R. K., & Wolf, M. B. 1993. Instrument development in the affective domain (2nd ed.). Boston: Kluwer Academic Publishers. 19. Hassenzahl, M., Platz, A., Burmester, M., Lehner, K. Hedonic and ergonomic quality aspects determine a software’s appeal. In: Proc. of CHI’00, 201-208 ACM NY (2000) 20. Morgan, D. L. 1988. Focus groups as qualitative research, Sage, London.