multi-view coding schemes with inter-image predictions [6, 7]. To calculate R(θ) and D(θ) for a predicted image, the PSD function of the residual signal: i.e. the ...
HOW DOES SUBSAMPLING OF MULTI-VIEW IMAGES AFFECT THE RATE-DISTORTION PERFORMANCE? Keita TAKAHASHI, Takeshi NAEMURA Graduate School of Information Science and Technology, The University of Tokyo 7-3-1, Hongo, Bunkyo-ku, Tokyo 113-8656, Japan {keita,naemura}@hc.ic.i.u-tokyo.ac.jp 2. BACKGROUNDS
ABSTRACT This paper introduces a new theoretical model on the rate-distortion performance in transmitting multi-view image data. To reduce the data amount, a practical solution is just decreasing the number of images by subsampling. The questions we focus on are (i) how much bit-rate can be reduced, and (ii) how much additional distortion would be caused, by the subsampling of images. In our theoretical model, the rate-distortion theory and the plenoptic sampling theory are combined to consider the relation between the sampling condition (the cameras’ interval) and the compression efficiency. Numerical simulations which show the theoretical lower bounds for (i) and (ii) are presented with discussions. Index Terms— Rate distortion theory, Image coding, Signal sampling, Interpolation
1. INTRODUCTION Multi-view imaging has attracted increasing research interests recently, and this will open new possibilities of rich 3-D experiences in many application areas such as telecommunication, broadcasting, movies, and gaming for the near future. One of the important issues in this field is how to compress the huge amount of image data for transmission and storage. Many researchers have focused on how to exploit intra/inter-image correlations in the multi-view data to improve the compression ratio, and demonstrated promising results not only for still images but also for videos [1, 2, 3, 4]. However, the relation between the sampling condition and the compression efficiency has been rarely discussed. The sampling condition here means the density of the cameras for capturing multiview images. One might think that just decreasing the number of images is a practical solution for reducing the data amount. For example, if the images are skipped alternately (in this paper, we call it “subsampling of images”), the number of images becomes to the half. However, reducing the images results in a larger camera interval, less correlations between the images, and accordingly less compression ratio, so that the final data amount might not be reduced as expected. In addition, it causes additional distortions, because the discarded images never can be reconstructed completely. Consequently, we should know (i) how much bit-rate could be reduced, and (ii) how much additional distortion would be caused, by the subsampling of images. This paper studies the above issues with our new theoretical model that combines the rate-distortion theory [5, 6, 7] and the plenoptic sampling theory [8].
1-4244-1437-7/07/$20.00 ©2007 IEEE
As the backgrounds, we briefly review the rate-distortion theory [5, 6, 7], and the plenoptic sampling theory [8], both of which are combined in our theoretical model. 2.1. Rate-distortion theory for image compression Assume that an image is a stationary, jointly Gaussian, zero means 2-D signal on the (u, v) coordinate system, and its power spectrum density (PSD) function, Φ(ωu , ωv ), is given by: 2π Φ(ωu , ωv ) = ω0 2
„ «− 32 ωu 2 + ω v 2 , ω0 = − ln(ρ) 1+ ω0 2
(1)
where ρ is the correlation coefficient between adjacent pixels in the image. For a given mean squared error: Z Z 1 D(θ) = min{θ, Φ(ωu , ωv )}dωu dωv (2) 4π 2 ωu ωv the minimum transmission rate that can be achieved is: j ff Z Z Φ(ωu , ωv ) 1 R(θ) = 2 max 0, log2 dωu dωv 8π ωu ωv θ
(3)
where θ is a parameter that determines the maximum allowable error for each frequency band [5]. Changing the value of θ, we can trace the rate-distortion curve. This theorem has been also applied to analyze video coding and multi-view coding schemes with inter-image predictions [6, 7]. To calculate R(θ) and D(θ) for a predicted image, the PSD function of the residual signal: i.e. the remaining components after the prediction, Φrr (ωu , ωv ), substitutes for Φ(ωu , ωv ) in Eqs. (2) and (3). 2.2. Plenoptic sampling theory Assume that input images are captured with many cameras that are arranged in a 2-D array. A continuous signal space, which is called a light-field, can be defined with 4 parameters, (s, t, u, v), in which (s, t) denotes the cameras’ locations, and (u, v) denotes the pixels’ positions on the camera that is located at (s, t). Multi-view images can be regarded as a discretely sampled version of the continuous light-field signal. Figure 1 depicts the 2-D subspace with (s, u). Chai et al. [8] assumed that non-Lambertian reflections and occlusions are negligible, and analyzed multi-view image data in the frequency domain, (ωs , ωu ). They have revealed the condition in which the continuous light-field signal can be reconstructed from the discrete multi-view data without aliasing artifacts. Given a geometry
I - 193
ICIP 2007
z zmax
3.1. Subsampling and Rate-Distortion
target scene zmin u s
u
u
u
f
O Δs
Fig. 1. Basic configuration.
model of the scene that is optimally quantized into Nd depth layers, the sampling interval along the s direction, Δs, should satisfy: Δs 1 ≤ Nd Kfu f hd
(4)
where Kfu is the maximum frequency along the u direction, and f denotes the focal length of the cameras. hd is given as (1/zmin − 1/zmax ) where the depth of the target scene (the distance from the st plane) ranges from zmin to zmax . Equation (4) can be understood in another way. Let FN yq be the Nyquist frequency on each camera which is given as (1/Δu) for the pixel pitch Δu. It is obvious that Kfu ≤
FN yq 2
(5)
should be satisfied to avoid aliasing artifacts along the u direction. We can define the ideal sampling rate (the ideal interval between the cameras), ΔS, to satisfy Eq. (4) for Kfu = FN yq /2: ΔS =
2 Nd · f hd FN yq
(6)
In this subsection, we formulate the variations of the minimum rate and the minimum distortion that would accompany subsampling. Suppose that the multi-view images are skipped alternately, so that the number of images becomes to the half. Let S represent the set of skipped images which are discarded, and T represent the set of remaining images after the subsampling which is encoded and transmitted to a remote site. At the remote site, the image set T � , which is distorted from T due to the lossy coding, would be reconstructed from the transmitted data. Then, the image set S would be predicted from T � . The questions are, by discarding the image set S, (i) how much bit-rate can be reduced, and (ii) how much distortion will be increased, compared to the case in which the entire image data T + S would be encoded and transmitted. In both cases, inter-image correlations should be fully exploited to minimize the rate and distortion. We do not discuss how to encode the data specifically, but we just assume that the ideal codec that yields the best result would be used, and analyze the theoretical limitations. To answer the above questions, let us consider a two-steps coding scheme in which the image set T is encoded first, then the image set S is encoded with the knowledge of T � . An identical θ is adopted for both steps. For the first step, the minimum rate and the minimum distortion are denoted as RT (θ) and DT (θ), respectively. In this step, inter-image correlations within T would be fully used as well as intra-image correlations. For the second step, the minimum rate and the minimum distortion are written as RS|T � (θ) and DS|T � (θ), respectively, where S|T � represents the residual signal that would be generated by the prediction of S from T � . The residual signal would be coded using intra-image correlations only. Since the same number of images are included in S and T , the total minimum rate is equal to the average for the two steps: RT (θ) + RS|T � (θ) 2 Similarly, the total minimum distortion is represented by R{T,S|T � } (θ, θ) =
(8)
DT (θ) + DS|T � (θ) . (9) 2 Since this two-step scheme is one of the schemes for encoding the entire image data T + S, the followings are true by definition: D{T,S|T � } (θ, θ) =
By substitution of Eq. (6) into Eq. (4) and from Eq. (5), we obtain: j ff ΔS FN yq Kfu ≤ min ,1 × . (7) Δs 2 This equation indicates that if the cameras’ interval Δs is larger than the ideal sampling rate ΔS, we should band-limit the light-field spectra according to the ratio of ΔS/Δs to avoid aliasing artifacts in reconstructing the continuous light-field. 3. OUR THEORETICAL MODEL In this section, a novel theoretical model for analyzing subsampling and rate-distortion performance of multi-view images is introduced. The rate-distortion theory [5] and the plenoptic sampling theory [8] are successfully combined to derive the relation between the sampling interval and the compression efficiency. We adopt the same configuration as Fig. 1, but limit the scope of discussion to the 3-D light-field, (s, u, v), in which the input cameras are aligned only in the horizontal direction that is denoted by the s axis, and (u, v) represents the pixels’ positions on each camera. Assume that a geometric model of the scene that is optimally quantized into Nd depth layers, which was also assumed in [8], would be given and transmitted as side information.
R{T,S|T � } (θ, θ) ≥ RT +S (θ) D{T,S|T � } (θ, θ) ≥ DT +S (θ)
(10) (11)
where RT +S (θ) and DT +S (θ) denote the minimum rate and the minimum distortion for the entire image data with inter/intra-image correlations fully exploited. In case of with subsampling, the image set S is not encoded, so that θ = ∞ is substituted for the second step in Eqs. (8) and (9). The difference of the minimum rate with or without subsampling is described as: ΔR(θ) = R{T,S|T � } (θ, ∞) − RT +S (θ) ff j RT (θ) + RS|T � (∞) − RT +S (θ) = 2
(12)
where RS|T � (∞) = 0. Similarly, the difference of the minimum distortion is given by:
I - 194
ΔD(θ) = D{T,S|T � } (θ, ∞) − DT +S (θ) ff j DT (θ) + DS|T � (∞) − DT +S (θ). = 2
(13)
By substituting Eqs. (8)–(11) into Eqs. (12) and (13), we obtain: RS|T � (θ) 2 DS|T � (∞) − DS|T � (θ) . 2
ΔR(θ) ≥ −
(14)
ΔD(θ) ≥
(15)
Φ(ωu, ωv)
These equations show the theoretical lower bounds for (i) how much rate can be reduced, and (ii) how much distortion will be increased, by the subsampling. To calculate those, we need to know the PSD function of the prediction residual S|T � , which is discussed in the next subsection.
Φee(ωu, ωv)
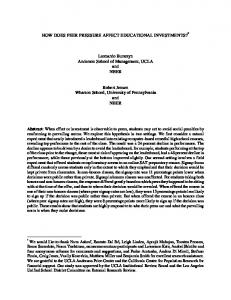
3.2. Modeling of Prediction Residual To model the prediction residuals between multi-view images, Ramanathan and Girod [7] assumed a planar surface geometry with some probabilistic perturbations, and examined several ways in predicting an image from other images. Meanwhile, we assume a layered geometry and adopt a band-limited reconstruction approach that is based on the plenoptic sampling theory [8]. Our model is more simple, but can capture the basic characteristic in multi-view images: the larger interval between the cameras results in the less correlations between the images. To accommodate the plenoptic sampling theory to the rate distortion theory, the spatial frequency should be normalized in the range of −π to π. Eq. (7) is rewritten as: j ff Δs π Kωs = , for β = max ,1 (16) β ΔS where Δs is the cameras’ interval after the subsampling, and ΔS is the ideal sampling rate given by Eq. (6). Prediction of S from T � can be regarded as interpolation of the light-field data. In other words, to predict the image set S, the image set T � is regarded as a discrete light-field signal and interpolated with the reconstruction filter which bandlimits the signal to |ωu | ≤ Kωu . According to the plenoptic sampling theory, the frequency components below Kωs can be predicted perfectly. However, we should consider the errors which result from non-Lambertian reflections, occlusions, geometry inaccuracy, and the coding distortions in T � . ˆ ee (ωu , ωv ) be the PSD function for all of those errors summed Let Φ up together. Meanwhile, no prediction is performed for the frequency components over Kωs . Then, the original PSD function of 2-D images, Φ(ωu , ωv ), remains as it is in those frequency bands. To sum up, the PSD function of the residual signal is described as: j ˆ ee (ωu , ωv ) (|ωu | ≤ Kωu ) Φ ΦS|T � (ωu , ωv ) = . (17) Φ(ωu , ωv ) (|ωu | > Kωu ) The solid curve in Fig. 2 illustrates the above equation with the vertical axis in log scale. ˆ ee (ωu , ωv ) ≤ In most cases, it seems reasonable to assume that Φ Φ(ωu , ωv ) would be satisfied as shown in Fig. 2. It can be seen that the total power of the residual signal increases with a decrease of Kωu . In addition, Kωu is a decreasing function of the cameras’ interval Δs, as shown by Eq. (16). Therefore, the larger interval between the cameras results in the larger power of the residual signal, because the more high-frequency components would be unpredictable as the camera interval increases. That agrees with the empirical knowledge in dealing with multi-view images. The overall procedure for calculating the rate-distortion variations before and after subsampling is as follows: First, by substituting Eq. (17) into Eqs. (2) and (3) (replacing Φ(ωu , ωv ) with
-Kωu
0
Kωu
ωu
Fig. 2. PSD function of the prediction residual.
ΦS|T � (ωu , ωv )), we calculate RS|T � (θ), DS|T � (∞), and DS|T � (θ). Then, they are substituted into Eqs. (14) and (15) to obtain the lower bounds of ΔR(θ) and ΔD(θ). 4. SIMULATIONS We conducted numerical simulations of our theoretical model with MATLAB software. In Eq. (1), the correlation coefficient, ρ, was ˆ ee in Eq. (17), is so compliset to 0.93. The prediction error term, Φ cated due to the non-linearness of the occlusions and the close-loop prediction, that it would be quite difficult to construct an accurate model for that. We simply assumed that the error term would be in proportion to the original PSD function of the 2-D images: ˆ ee (ωu , ωv ) = αΦ(ωu , ωv ). Φ
(18)
In the above, α should be chosen according to the complexity of the scene, the coding distortion of T � , and the cameras’ interval Δs. In this paper, we chose 0.05 and 0.01 as examples. Figure 3 shows the simulation results with (a) α = 0.05 and (b) α = 0.01. The horizontal axes, ΔR, represent the variation of the minimum rate (in bits) before and after the subsampling. The vertical axes, ΔD, represent the variation of the minimum distortion, which is normalized by the signal power. These graphs show the theoretical lower bounds of ΔR and ΔD for given θ and β. θ controls the overall quality of the compression as shown in Eqs. (2) and (3); the smaller θ yields the higher bit-rate and the smaller distortion, and vice versa. β denotes the cameras’ interval after the subsampling by the ratio to the ideal sampling rate, as denoted by Eq. (16). The graphs tell us whether reducing the number of images to the half pays or not from the viewpoint of rate-distortion performance. As can be seen from the level curves for θ, ΔR decreases with an increase of β, but it bottoms out at a certain level. It can be explained as follows: When the cameras’ interval Δs is small (β is also small), there are much inter-image correlations, and the bit-rate for each image is relatively small. Accordingly, the subsampling has less effect on the bit-rate compared to the case with a larger Δs. However, if Δs is large enough, the correlations between images are little, as indicated by Eqs. (16) and (17). In this case, the bit-rate
I - 195
-2.5
-2
β=1 β=2 β=3 β=4 β=5 β=6 β=7 β=8 β=9 β=10 θ=0.0001
-1.5
ΔR
ΔR -1
-0.5
0 0
-2.5
-2
-1.5
-1
-0.5
β=1 β=2 β=3 β=4 β=5 β=6 β=7 β=8 β=9 β=10
0.02
0.04 ΔD 0.06
0 0
0.02
0.04 ΔD 0.06
0.08 θ=0.001
0.08 θ=0.0001
θ=0.01 θ=0.1
θ=0.001
θ=0.01 θ=0.1 0.1
0.1 (a) α=0.05
(b) α=0.01
Fig. 3. Simulation results for the RD differences (ΔR and ΔD) with or without subsampling. α represents the magnitude of the prediction errors between the images. Level curves are drawn for β and θ, where β denotes the interval between the cameras, and θ is a parameter that controls the compression quality.
for the prediction residual gets close to that of intra-image coding, which determines the minimum for ΔR. Meanwhile, from the level curves for β, it is obvious that ΔD becomes less significant as θ increases. We can explain it as follows: If θ is large, the information of S are not sufficiently transmitted even in the case of without subsampling. Consequently, the overall quality is not largely changed with or without S. Another important fact is that ΔD peaks out at a certain level that is determined by β. As indicated by Eq. (15), the maximum of ΔD is equal to DS|T � (∞)/2, and the shape of S|T � is determined by the interval between the cameras as discussed in 3.2. Comparing the results for (a) α = 0.05 and (b) α = 0.01, we found that all curves in the graph are being pressed down as α inˆ ee , has a great creases. It indicates that the prediction error term, Φ influence on ΔD. This is reasonable because this error term represents the components in each image that can not be predicted from other images, so that they never can be reconstructed if the image itself is discarded by the subsampling.
of The University of Tokyo, Japan, for his discussions.
5. CONCLUSIONS
6. REFERENCES [1] T. Takano, T. Naemura, and H. Harashima, “3D space coding using virtual object surface,” Systems and Computers in Japan, vol. 32, no. 12, pp. 47–59, 2001. [2] M. Magnor, P. Ramanathan, and B. Girod, “Multi-view coding for image-based rendering using 3-D scene geometry”, IEEE Trans. CSVT, vol. 13, no. 11. pp. 1092–1106, 2003. [3] K. Yamamoto, T. Yendo, T. Fujii, M. Tanimoto, M. Kitahara, H. Kimata, S. Shimizu, K. Kamikura, and Y. Yashima, “Multiview video coding using view-interpolated reference images”, Proc. Picture Coding Symposium (PCS 2006), 2006. [4] K. Mueller, P. Merkle, H. Schwarz, T. Hinz, A. Smolic, T. Oelbaum, and T. Wiegand, “Multi-view video coding based on H.264/MPEG4-AVC using hierachical B pictures”, Proc. Picture Coding Symposium (PCS 2006), 2006. [5] T. Berger, “Rate distoriton theory,” Englewood Cliffs, NJ: Prentice-Hall, 1971.
This paper introduced a new theoretical model on the rate-distortion performance of multi-view images for analyzing the effect of reducing images. The rate-distortion theory and the plenoptic sampling theory were combined to consider the relation between the cameras’ interval and the compression efficiency. Based on the model, the theoretical lower bounds for (i) how much bit-rate can be reduced, and (ii) how much distortion will be increased, by the subsampling of images, has been presented with the numerical simulations. Our future work will be focused on the validation of our theory with experiments using real image data. In addition, our theoretical model will be extended to deal with multi-view video coding [3, 4] as well. Acknowledgment: We extend our special thanks to Prof. Harashima
I - 196
[6] B. Girod, “The efficiency of motion-compsensating prediction for hybrid coding of video sequences,” IEEE Journal SAC, vol. SAC-5, no. 7, pp. 1140–1154, 1987. [7] P. Ramanathan, B. Girod, “Rate-distortion analysis for light field coding and streaming,” EURASIP Journal SP:IC, vol. 21, issue 6, pp. 462–475, 2006. [8] J.-X. Chai, X. Tong, S.-C. Chany, and H.-Y. Shum, “Plenoptic sampling,” Proc. ACM SIGGRAPH’00, pp. 307–318, 2000.