Wang et al. SpringerPlus (2016) 5:538 DOI 10.1186/s40064-016-2148-y
Open Access
CASE STUDY
How eye movement and driving performance vary before, during, and after entering a long expressway tunnel: considering the differences of novice and experienced drivers under daytime and nighttime conditions Yonggang Wang1* , Longjian Wang1, Chen Wang2 and Yangdong Zhao3
Abstract Introduction: Driving environment in tunnels is quite different from the ordinary roadway sections, especially the entrance locations, which causes great difficulty in obtaining and interpreting information through fixations and saccades that are relevant to driving safety. Therefore, it is necessary to understand driver’s visual behaviors while entering a tunnel so as to take the countermeasures for accident prevention. Case description: In order to identify the variation of driver’s visual features during the process of tunnel entry, 18 participants were recruited to take part in a driving test conducted in real tunnel sections between Qipanguan toll and Jinshui toll of the G5 expressway in Shaanxi, China. During this test, the drivers’ fixations, saccades and driving performances were captured for further analysis. Discussion and evaluation: The test data revealed that the driver’s number of fixations, duration of fixations and number of saccades increased gradually at the transition zone. The number of fixations, duration of fixations and number of saccades then drop slightly until the end of the transition zone, and then rise just a little to a stable value after fully adapting to the driving conditions inside the tunnel. Meanwhile, the driver’s number of saccades and saccade amplitude value decreased first, and then increased gradually until reaching a relatively stable value inside the tunnel. Additionally, drivers are more cautious at the transition zone, driving conservatively at lower speed, while decreasing their steering wheel angle and minimizing the vehicle’s lateral deviation. Specially, novice drivers require a longer transition zone before tunnel entry compared to the experienced ones. Moreover, both novice and experienced drivers take more time to get prepared for tunnel entry while driving at night. Conclusion: Tunnel entrance section is far more dangerous, so drivers should be educated to get ready ahead for tunnel entry, drive cautiously at lower speed and pay full attention to the traffic flow conditions while driving through the tunnel, especially for the novice drivers in night tasks. Tunnel entrance is suggested to have easily identifiable frame design, with effective traffic signs placed at least 170 m before the entrance and gradually changeable LED lighting along the transition zone. All these suggestions provide insight into potential strategies for reducing and preventing traffic accidents and injuries at the tunnel locations. Keywords: Tunnel entrance, Novice driver, Visual feature, Driving performance, Transition zone, Safety improvement
*Correspondence:
[email protected] 1 School of Highway, Chang’an University, P.O. Box 487, Middle Section of South 2 Ring Rd., Xi’an 710064, Shaanxi, China Full list of author information is available at the end of the article © 2016 Wang et al. This article is distributed under the terms of the Creative Commons Attribution 4.0 International License (http://creativecommons.org/licenses/by/4.0/), which permits unrestricted use, distribution, and reproduction in any medium, provided you give appropriate credit to the original author(s) and the source, provide a link to the Creative Commons license, and indicate if changes were made.
Wang et al. SpringerPlus (2016) 5:538
Background Over the past decades, China’s rapidly expanding economy has lead to a dramatic increase in road mileage in mountainous areas, as well as a sharp rise in the number of tunnels. Nowadays, China is the world’s biggest highway tunnel builders. By the end of 2013, there were 12,132 highway tunnels totaling 9,732,400 m in length, including 389 long tunnels between 200 and 18040 m with a total length of 1,246,539 m. As a special kind of infrastructure in highway networks, a large range of differences exists between the luminance inside and outside a tunnel, which can easily cause drivers to experience severe day or night blindness (heliophobia and nyctalopia), also known as a visual “white or black hole effect”. Moreover, the limited interior space and low visibility inside the tunnel are capable of inducing psychological panic. All of these factors contribute significantly to the increased risk of being killed or involved in an accident among tunnel traffic (Ma and Fu 2015). Drivers need to interpret real time information related to their task in able to judge the current situation, make proper decisions and adjust driving behavior accordingly. While driving, more than 80 % of information, especially the dynamic incentives, is perceived through the driver’s visual movements, which mainly include fixation (eye movement speed 8000°/ s2) and blinking. During the normal driving process, drivers obtain nearly all of their information related to driving safety through fixations and saccades. Since a driver’s blinking behavior provides relatively little information compared to fixations and saccades, it is not included in this study. The difference in alignment design and illumination layout is quite significant, which increases the difficulty of the driver’s visual perception and may eventually lead to unsafe driving behaviors or even fatal crashes, especially at tunnel entrance zones (Calvi and D’Amico 2013; Du et al. 2014a). While the risk of a crash within a tunnel is lower than that on an open road, a crash inside a tunnel often results in much more severe consequences (Amundsen and Ranes 2000). Furthermore, according to the Norway Highway Bureau, about 63.7 % of tunnel accidents occur at entrance zones. Similar results are also found in the analysis of tunnel accidents in China (Ma et al. 2009). These trends suggest that the driver’s difficulty in adapting to the change of light conditions inside and outside of the tunnel is a major factor in tunnel accidents. Therefore, many previous studies have examined drivers’ visual features while driving through a tunnel to assess the risk of crash and identify the potentially hazardous locations related to tunnel travel (Liu et al. 2011; Wang et al. 2015; Yan et al. 2015). Among these studies, illumination
Page 2 of 10
inside the tunnel has attracted wide interest (Cheng et al. 2006; Pachamanov and Pachamanova 2008; Bai et al. 2012; Du et al. 2014a; Hu et al. 2014). Du et al. (2014b) reported that the rapid change of illumination at a tunnel’s entrance induces driver’s visual shock or transient blindness that increases the visual load. Bertozzi et al. (2011) also reported similar findings. More specifically, Martens et al. (1997) found that tunnel design (i.e. tunnel wall, lane width, longitudinal profile, road signs and markings, et al.) and illumination have some immediate effects on the driver’s driving behaviors, and similar findings were also reported in the previous researches of Kayser and Oasderski (1991), Kircher and Ahlstrom (2012) and Miller and Boyle (2015). Accordingly, countermeasures should be taken at the transition zones near tunnel entries and exits to decrease the risk of crashing. Obviously, the complex driving environment at a tunnel entrance brings a great number of information acquisition difficulties to drivers. Since a driver’s visual behaviors are internally associated with his or her information acquisition efficiency, a reasonable understanding of a driver’s visual behaviors is the key to reducing tunnel crashes and improving the overall safety performance of freeway tunnels. For this purpose, eighteen drivers were recruited randomly to attend the driving test in real tunnel sections of the G5 expressway in Shaanxi, China. During the test, drivers’ eye movement (fixations and saccades) and driving performance (speed, steering wheel angle and vehicle lateral deviation) data were captured. Then, the change features concerning the driver’s fixations, saccades and driving performance at both the tunnel entrance and inside of tunnel were analyzed using the test data that have important values for crash and injury prevention at tunnel locations.
Experiment design Participants
Eighteen participants (13 male, 5 female) of 20–40 years old (mean age = 29.4 years, SD = 4.5 years) in good physical and mental health were recruited from the communities in Hanzhong city to participate in the driving test. Among them, 9 participants (7 male, 2 female) have a limited license age of less than 3 years, who are accordingly called the novice group. The remaining 9 participants (6 male, 3 female) belong to the experienced group, and whose average license age was 6.74 years (SD = 2.45). All participants hold a valid class C1 driver’s license and drive an average of 412 km per week (with a minimum of 207 km and a maximum of 928 km per week). Each participant was required to have either normal or corrected to normal vision and does not take any alcohol, medication or drugs that would impair their driving
Wang et al. SpringerPlus (2016) 5:538
performance. Additionally, all of the participants were familiar with the local expressway conditions. Equipment
The Smart Eye Pro 6.0 three-camera eye tracking system was used to capture the participant’s eye movements, which was mounted on the front windscreen to accurately capture the driver’s eye movements (fixations and saccades) at a frequency of 60 Hz. Two scenes cameras were fixed right above the wheel to record the steering wheel angles and vehicle lateral deviation. The sensors equipped on the experiment passenger car (BYD G5) were used to collect the vehicle’s speed, acceleration and deceleration as well as other driving behaviors. All recorded data were saved as txt files that can be used for offline analysis. Driving environment
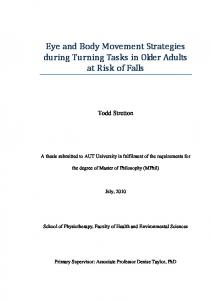
The Ningqiang–Yangxian Expressway (Fig. 1), a section of the Beijing–Kunming Expressway (G5) in Hanzhong of Shaanxi Province, China, was selected for the driving test. Located in the Qinba Mountains, this section is 198 km long with a posted speed limit of 100 km/h for passenger cars. The cross-section is 15.50 m wide, comprised of a 0.5 m wide grassy median barrier, two 3.50 m wide lanes and a 0.50 m wide shoulder on each side. The alignment for this roadway section consists of 26 tangent–curve configurations. The tangent length varied, ranging between 23 and 1338 m with a mean length of 533 m. The curves range from 48 to 1150 m in radius (mean 328 m), 17 to 197 m in length (mean 69 m) and 6 to 72° in deflection angle (mean 41°). Additionally, the longitudinal grade varies from −3.8 % to +4.4 %. There are 22 twin bore tunnels in total, as shown in Fig. 1, ranging from 125 to 5335 m (Qipanguan Tunnel) in length. Since the purpose of this study is to examine drivers’ visual behaviors during their visual adaptation from tunnel entrance to the dark environment inside tunnel, this study only considers the tunnels 350 m-long or longer to collect data and analyze the driver’s visual behavior. In total, 8 tunnels and 7 tunnels are included in the driving tests of Qipanguan to Jinshui direction and Jinshui to Qipanguan direction, respectively. The tunnel in each traffic direction consists of two 3.75 m wide lanes and a free height of 5 m. All of the tunnels are equipped with LED lights and traffic signs in advance to alert drivers of tunnel entrances (Fig. 2). Table 1 presents the size and illuminations of each tunnel. Data collection
The test was conducted in the middle of May, 2015. Each participant was required to drive along G5 from the Qipanguan Toll to the Jinshui Toll between 2:00 p.m. and
Page 3 of 10
4:30 p.m. and then drive back to the Qipanguan Toll from the Jinshui Toll between 7:30 p.m. and 10:00 p.m. after having supper and a sound rest for performance recovery. In the test, the following hypotheses were given: (1) the driver’s age has no significant effect on visual behaviors; (2) luminance differences in tunnels can be neglected; (3) driver’s visual measures change gradually and no visual shock is considered; (4) variation in the driver’s visual measures reflect psychological and emotional changes. All of the participants were informed of the purpose, procedure, usage of the eye-tracker and calibration of equipments in the training session before the test. Participants were also allowed to give up at any time if they felt uncomfortable during driving. Participants were asked to give consent about data recording of their visual behaviors in driving before the normal experiment. Then it turned to the formal test session to finish the 2.5 h daytime or night driving task from the Qipanguan Toll or the Jinshui Toll, respectively, with their usual style. In the following data processing, each participant’s behaviors recorded between 250 m before the tunnel entrance to 250 m inside the tunnel were intercepted and used to analyze the variation of each driver’s visual behaviors. Moreover, these selected sections were divided into three zones: the approaching zone comprised of 250–150 m before tunnel entrance, the transition zone comprised of 150 m before tunnel entrance to 150 m inside the tunnel, and the inside zone comprised of 150–250 m inside the tunnel. 250 m before tunnel entrance was considered the baseline measurement and used to compare driver’s visual change at different zones.
Results and findings Fixations Mean number of fixations
A fixation refers to the period a person maintains his or her visual gaze on a single location, which is a sign of a person’s attention focus. Such a location or area is also called a fixation point, and thus the number of fixations is defined as the total number of fixation points on an area of interest (Swanston and Walley 1984). In driving, once the driver notices a specific region of interest, the number of fixations reflects the number of points of interest that driver is concerned about within the area. During a visual search task, the number of fixations depends on the amount of driving-related visual information processing, but it is unrelated to the depth of the information (Liu et al. 2011). Figure 3 presents the change in drivers’ mean number of fixations while driving through the tunnel entrance. A tunnel’s transition zone presents quite a different driving condition, especially for the novice drivers
Wang et al. SpringerPlus (2016) 5:538
Page 4 of 10
Fig. 1 Location of test tunnels. A Position of Shaanxi Province in China, B Test expressway in Hanzhong, Shaanxi Province, C Distribution of tunnels on the test expressway. Note a Qipanguan Tunnel, b Xiejialiang Tunnel, c Hejiaxia Tunnel; d No. 2 Yuandun Tunnel6, e Tielugou Tunnel, f No. 2 Youshui Tunnel, g No.1 Youshui Tunnel, h Qinglongya Tunnel
Fig. 2 Entrances of typical tunnels along test road. a Qinglongya Tunnel, b No. 1 Youshui Tunnel, c Tielugou Tunnel, d Qipanguan Tunnel
at night. As shown in Fig. 3 and compared with experienced drivers, novice drivers’ average number of fixations per area begins to increase at 50 m (M = 7.45, SD = 0.84, P