Attention, Perception, & Psychophysics 2010, 72 (4), 1097-1109 doi:10.3758/APP.72.4.1097
How high is visual short-term memory capacity for object layout? Thomas Sanocki, Eric Sellers, Jeff Mittelstadt, and Noah Sulman University of South Florida, Tampa, Florida
Previous research measuring visual short-term memory (VSTM) suggests that the capacity for representing the layout of objects is fairly high. In four experiments, we further explored the capacity of VSTM for layout of objects, using the change detection method. In Experiment 1, participants retained most of the elements in displays of 4 to 8 elements. In Experiments 2 and 3, with up to 20 elements, participants retained many of them, reaching a capacity of 13.4 stimulus elements. In Experiment 4, participants retained much of a complex natural istic scene. In most cases, increasing display size caused only modest reductions in performance, consistent with the idea of configural, variable-resolution grouping. The results indicate that participants can retain a substantial amount of scene layout information (objects and locations) in short-term memory. We propose that this is a case of remote visual understanding, where observers’ ability to integrate information from a scene is paramount.
The relation between the mind and the world is of cen tral interest in psychology, and scene perception is a multi faceted example of this relation. A critical characteristic of scene perception is the amount of information that can be extracted from a scene and retained in immediate memory. Currently, considerable debate centers on this quantity. At one end of the debate is the hypothesis that very little is held in memory beyond an attended object (see, e.g., O’Regan, 1992; Wolfe, Klempen, & Dahlen, 2000). In this hypothesis, the intuitive experience of perceiving a rich world is explained by the richness of the information available from the world via eye movements (see O’Regan, 1992). The hypothesis of minimal representation receives support from difficulties of change detection documented in many studies (e.g., Grimes, 1996; Simons, 1996). At the other end of the debate is the hypothesis that rich representations of scenes result from combined con tributions of short-term and long-term memory (e.g., Hollingworth, 2004, 2005, 2007; Irwin & Zelinsky, 2002; Melcher, 2006). Long-term memory contributions can be obviated by experimental design, limiting the represented information to short-term memory. Visual short-term memory (VSTM) for objects has been studied carefully, and many researchers have concluded that it has a sharp limit, between two and four objects (e.g., Hollingworth, 2006; Vogel, Woodman, & Luck, 2001). However, almost all of the studies supporting a sharp limit in VSTM ca pacity have measured memory for properties of objects. Object properties constitute only one aspect of scene memory. A second fundamental aspect is memory for the layout of objects and other structures in a scene. The rep resentation of spatial information is a fundamental com
ponent of short-term memory models (e.g., Baddeley & Hitch, 1974; Logie, 1995). A number of studies suggest that fairly complex lay outs of objects can be retained over short-term intervals. In seminal studies of very short-term visual memory, Phillips (1974) also included longer short-term intervals. At the short-term intervals, he found accurate detection of changes of the position of a single element within 25-element arrays (e.g., above 85% in several conditions). Simons (1996) contrasted VSTM for object properties and locations and found location memory, but not object prop erty memory, to be near the ceiling (see also Aginksy & Tarr, 2000; Alvarez & Oliva, 2007; Jiang, Olson, & Chun, 2000). Franconeri, Alvarez, and Enns (2007) recently concluded that as many as seven locations can be held in short-term memory. Rensink (2000b) obtained capac ity estimates of at least nine for contrast signs of objects. Brockmole, Wang, and Irwin (2002) presented dot lay outs for an integration task and estimated that the number of dots held in VSTM was about 10. A separate line of evidence for complex representations of layout is spatial priming with scenes; Sanocki and colleagues (Sanocki, 2003; Sanocki, Michelet, Sellers, & Reynolds, 2006; Sanocki & Sulman, 2009) found evidence that broadscale representations of layout information are activated in memory by a prime scene. In sum, multiple sources of evidence suggest there may be a fairly high capacity for layout information in VSTM. However, the relative advantage for layout over prop erty memory can be explained by assuming that grouping processes are involved in encoding and that grouping is more effective for layout than for object properties. The idea that nearby objects can be grouped into larger struc
T. Sanocki,
[email protected]
1097
© 2010 The Psychonomic Society, Inc.
1098 Sanocki, Sellers, Mittelstadt, and Sulman tures is well established in visual memory (see, e.g., Enns, 1987; Hollingworth, Hyun, & Zhang, 2005; Irwin, 1991; Jiang et al., 2000; Sebrechts & Garner, 1981). Thus, in layout memory, several proximal objects could be encoded as a single complex object, reducing the total number of objects represented in memory (Miller, 1956). For exam ple, a complex display of 12 objects might be encoded as 3 four-part objects. Because of grouping explanations, there is ambiguity in determining the quantity of objects represented in VSTM. Nevertheless, we can begin to characterize VSTM capac ity. Intuitively, if 12 objects and their layout were held in VSTM, it would be a fairly complex scene and a substan tial portion of a typical scene. This is an answer to the question, “How much information from a scene can be held in VSTM?” The purpose of the present experiments was to explore and characterize the possible upper limits of VSTM ca pacity for object layout. We begin with some ideas about layout memory and the measurement of object capacity. Then we explore capacity with three types of stimulus displays. Typical Layout Layout memory is likely to have evolved for layouts typical in our world. We propose that typical layout has four main properties that have implications for memory. The first is that typical layout is broad in spatial extent. Layouts include large-scale structures, such as the horizon line, buildings, or mountains. The world itself is expan sive, and important duties, such as navigating new terri tory or providing security for a community, require the monitoring of areas that extend beyond the foveal field or even the full field of view. Studies of boundary exten sion suggest that memory for a scene layout has the design feature of extending beyond the immediate visual field (Intraub, 1997). Broad expanses of information must be represented in parallel to be optimally useful. Second, layout often consists of dense configurations of objects, occluded objects, and various background struc tures. To be effective, layout memory must encode dense configurations efficiently. As noted, there is evidence of grouping in VSTM, and grouping is a likely mechanism for the efficient encoding of dense configurations (e.g., Miller, 1956). For example, the foreground of a home site might include a yard, a sidewalk, and bushes, all of which could be grouped into a “front yard” configuration. Third, because aspects of layout vary in scale and sa lience, layout memory is likely to vary in resolution. If a scene layout is too complex to be fully represented, infor mation should not be lost in discrete units, such as objects or regions, because of the importance of extent; instead, the broad, parallel nature of the memory could be main tained with an overall loss of the fidelity of information. Usually, the loss of information would begin with more minor (finer) details. There is evidence that attentional and memory resolution varies (see, e.g., Alvarez & Ca vanagh, 2004; Awh, Barton, & Vogel, 2007; Franconeri et al., 2007; Tsal, Meiran, & Lamy, 1995), although not in all situations (e.g., Zhang & Luck, 2008).
Fourth, typical layout confounds object identity and location. Objects help represent layout by serving as landmarks, and location and scale within scenes can help define objects (see, e.g., Palmer’s [1975] fruit face; Tor ralba, 2003). Therefore, identity may contribute to layout memory, and layout may contribute to identity memory. In summary, we argue that memory for the layout of ob jects in scenes can be fairly high in capacity and involves four properties: broadness in spatial extent, grouping of scenic configurations, variation in resolution, and integra tion of identity and location information. Measuring Capacity The present experiments utilize two of the primary methods for inferring VSTM capacity. The first is to mea sure the effects of display size. In most cases of objectproperty memory, there is a sharp drop-off in accuracy as display size is increased beyond 3 or 4 items, imply ing a limit of about 3 items, beyond which objects are lost from memory (see, e.g., Eng, Chen, & Jiang, 2005; Hollingworth, 2006; Vogel et al., 2001; for a review, see Luck, 2008). However, sharp drop-offs in accuracy are less likely with a memory that is configural and varies in resolution. In layout memory, capacity limits may cause gradual changes in fidelity between differing display sizes and differing situations, rather than dramatic drop-offs. The second method is a more formal index—namely, a simple high-threshold model first applied to VSTM by Pashler (1988). In this model, items are either present in memory (which supports change detection when one of those items changes) or missing from memory. When none of the items present in memory change, a change guess is issued at the false alarm rate. When applied to data on object property memory, the model estimates a memory capacity k of about three objects, which coincides nicely with the drop-offs in the display size functions (see, e.g., Vogel et al., 2001). Grouping distorts the meaning of k. As noted, a scene of n items could be encoded in memory as only a few (, n) larger grouped structures and, perhaps, as few as one large structure. The Pashler k would not reflect this, however, be cause it counts stimulus items (the units that change in the experiment). It may be most accurate to think of k in terms of stimulus information that is held in memory, rather than as a count of representational units. With these caveats in mind, we will argue that Pashler’s k, together with percent ages correct and examples of the stimulus displays, pro vides an intuitively useful and quantitative characterization of the amount of scenic information held in VSTM. The Present Experiments The present experiments were designed to examine the capacity of short-term memory for layout across a sample of different stimulus situations. We used stimulus displays that were broad (.20º visual angle), sometimes dense with considerable detail (Experiment 4), and that confounded identity and location (Experiments 1, 2, and 4). The observers’ task was to detect changes in the loca tion of one display element. The element was present in the first display but moved to a new location in the second
Short-Term Memory for Layout 1099 display. This represents a typical change in layout within the world, in which an object moves from one location to another (see, e.g, Irwin, 1991; Phillips, 1974). Within each experiment, the displays were familiar to observers because the same set of elements was used repeatedly; however, the layout of elements changed from trial to trial, requiring short-term memory for recognizing differences in the new configuration. Because grouping is likely to be an important aspect of the encoding process, we examined several factors that may influence the organization of the displays. In Experi ments 1 and 2, we examined the effects of a potentially important structure in real-world depth perception, that being texture gradients (Gibson, 1979). In Experiment 3, we examined the importance of organization into cardi nal rows and columns. In Experiment 4, we examined an image property thought to be important for segmenting complex displays—namely, color (see, e.g., Wurm, Legge, Isenberg, & Luebker, 1993).
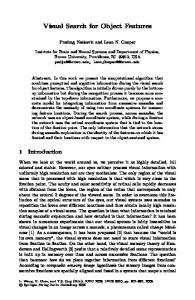
Experiment 1 Because previous research on object property memory found large drop-offs in accuracy beginning at about four items, we first examined display sizes of four to eight items. Our manipulation of an organizational factor was motivated by recent work in perception that has implicated surfaces—and ground surfaces, in particular—as struc tures for integrating object and scene information (e.g., He, Wu, Ooi, Yarbrough, & Wu, 2004; Ni, Braunstein, & Andersen, 2005; Vecera & Palmer, 2006; see also Gibson, 1979). Stimulus elements were selected from an organized pair of surfaces (ground and sky, Figure 1A) or an unorga nized pair of surfaces (random arrangement of the same el ements, Figure 1B). The more organized arrangement cor responded with regular texture gradients, with rectangles receding in depth as a ground surface and cloud-like circles receding in depth as a sky gradient. We expected memory accuracy and capacity to be higher for displays generated
A
B
C
D
E
Percentage Correct
100 90 80
Regular same Regular different Irregular same Irregular different
70 60 50 4
6
8
Display Size Figure 1. Stimuli (panels A–D) and results (panel E) for Experiment 1. Panels A and B show the prototype stimulus patterns. Panels C and D show stimulus examples with a display size of eight. Panel E shows the mean percentage correct in each condition.
1100 Sanocki, Sellers, Mittelstadt, and Sulman from these regular gradients than for displays generated from the same elements arranged in an irregular manner. During the experiment, the stimuli were blocked by regular versus irregular display type, and observers were shown the complete array before the start of each block. Our complex scenes did not lend themselves to verbal labeling, and we did not use an auditory secondary task to discourage verbalization in the experiments. There is no evidence that verbal labels influence standard VSTM ex periments. In studies of object memory, Vogel et al. (2001) and Liu and Jiang (2005) directly compared short-term memory performance with and without verbalization and found no differences in memory performance between conditions. Method
Participants. Six students (3 female) from introductory psychol ogy courses at the University of South Florida participated in ex change for course credit. A small sample was used in this experiment because of the near-ceiling effect obtained. Procedure and Design. On each trial, an initial stimulus (mem ory array) of four, six, or eight elements was presented for 200 msec, followed by an 800-msec blank interval, and then a second array (test array) remained on-screen until the observer responded same or different by pressing a keyboard key. The test array was identical to the memory array on half of the trials and changed on the remaining trials (one element offset and a new element onset). The stimulus arrays were generated by randomly selecting ele ments from complete arrays of 16 elements (Figures 1A and 1B). The complete arrays subtended approximately 21º 3 13º (horizon tal 3 vertical visual angle). We generated 120 pairs of arrays—60 of each type (regular and irregular)—with the members of a pair dif fering in the position of 1 element. The change in position occurred within either the upper or the lower half of the display (i.e., the ele ment did not move from top to bottom). Changes were as equally likely to be in the upper region as in the lower region. Examples of a regular and an irregular array are shown in Figures 1C and 1D, respectively. Each array pair was used twice during the experiment: once on a different trial and once on a same trial, in which the first array of the pair was presented twice. Auditory feedback about ac curacy was given after each response. There were 240 test trials divided into blocks of 20 with array type (regular, irregular) alternating between blocks in a counterbalanced order. Testing was preceded by two 10-trial practice blocks with a random sample of the test stimuli.
Results Accuracy was near the ceiling, averaging 93.7% cor rect. Figure 1E shows percentage correct as a function of display size, response, and texture regularity. Accuracy re mained high across display size, ranging from 97.3% with display sizes of four, to 91.7% and 92.1% at the larger dis play sizes, respectively. The high performance in this ex Table 1 Overall Percentages Correct (PC) and Estimates of Sensitivity (d′, A′), Bias (c, b), and Capacity (k), Averaged Over the Regularity Condition for Each Display Size in Experiment 1 Capacity Sensitivity Bias Display Pashler’s Pashler Pashler Size PC d′ A′ c b k Empty Both 4 97.29 4.40 .99 2.03 1.00 3.90 11.69 15.59 6 91.67 3.52 .95 0 1.34 5.19 8.63 13.81 8 92.08 3.33 .96 .07 1.29 7.02 7.02 14.04
periment provides evidence about the capacity of VSTM: Memory handled the four to eight items in the displays of this experiment, with little evidence of limits. Thus, the information in the displays did not exceed VSTM limits. Examination of example stimuli (Figures 1C and 1D) in dicated that a moderately high amount of scenic informa tion was held in VSTM. An ANOVA was conducted on the factors in the figure. The main effect of display size was reliable [F(2,10) 5 5.50, p 5 .02, h p2 5 .52]. The drop in accuracy from four to eight items was 5.2%, and the drop from four to six items was 5.6%. Thus, the loss in performance with increasing display size was modest. Performance at each display size was also measured in terms of sensitivity: d ′ values for four, six, and eight items were 4.40, 3.52, and 3.33, re spectively (Table 1). A′ values are also shown in Table 1. Pashler’s k provides an estimate of VSTM capacity in terms of number of stimulus elements. The most valid estimates are calculated from the data for the largest dis play sizes, because smaller display sizes may not reach capacity. The overall estimated capacity was 7.0 items. Estimates for individual observers ranged from 6.0 to 7.4 items. Note that the estimates were limited by the number of items presented, and there was a near ceiling effect. Had capacity extended beyond eight items, the present experiment would not have measured it. The effects of the regularity of the texture gradi ents tended to be contrary to our hypothesis: Accuracy was marginally lower with the regular texture gradients (92.8%) than with the irregular stimuli (94.6%) [standard error of the difference (SED) 5 0.7%; for the main ef fect of regularity, F(1,5) 5 6.17, p 5 .06]. Inspection of Figure 1E reveals that, for regular different arrays, there was a decrement in accuracy at the two larger display sizes. The increased uniformity in structure and texture in regular arrays may have biased observers toward same responses, thereby increasing errors to different displays by making them less likely than with irregular arrays. This bias also increased same responses to regular same arrays. The trade-offs due to bias were apparent in interaction ef fects: There were interactions of display size and response [F(2,10) 5 22.88, p , .001], stimulus regularity and re sponse [F(1,5) 5 13.06, p 5 .02], and all three factors [F(2,10) 5 5.62, p 5 .02]. Also, there was a main effect of response [F(1,5) 5 9.79, p 5 .03]. Discussion The present experiment, with near-ceiling performance, provides some information about the capacity of VSTM. The stimulus displays used in this experiment (see, e.g., Figures 1C and 1D) were within the capacity of VSTM. The Pashler k was 7.0 of the stimulus elements. The el ements are likely to be encoded into fewer than seven groups. Further experiments will be necessary to deter mine the upper limit of stimulus capacity. The lack of any positive effect of texture gradient regu larity was rather surprising. However, there may not have been enough elements in the stimulus displays to portray gradients effectively; the displays contained an average of only three elements each in the ground and sky. Experi
Short-Term Memory for Layout 1101 ment 2 was designed to provide a more powerful test of the effects of texture gradients. One last point is that there are alternative ways to apply the Pashler model to location memory. Observers might have remembered empty locations instead of filled loca tions or a combination of empty and filled locations. We modified the model to examine these cases and found gen erally similar estimates of capacity. If only empty regions were remembered, the number of locations would be the complement of filled display sizes, ranging from 12 empty locations at a display size of four objects, to 8 empty loca tions at eight objects. The fact that memory performance is somewhat higher in the largest empty condition of 12 locations is evidence against the idea that the observers used empty locations. Nevertheless, the Pashler formula can be reapplied to empty display sizes, and the capacity estimate at the most valid size of 12 empty locations is 11.7 locations (“Pashler empty” in Table 1). If both empty and filled locations are used by observers, then the display size is the sum of empty and filled locations, or 16 in all
A
B
C
D
E
conditions. We extended the Pashler formula by using all 16 locations, and the capacity estimates ranged from 13.8 to 15.6 locations in the three different display-size condi tions (“Pashler both” in Table 1). Thus, under alternative assumptions, capacity remained fairly high. Experiment 2 The purpose of Experiment 2 was to further examine capacity and the influence of texture gradients with dis plays that were larger in number of elements and denser. The complete array had 24 items in total, and stimulus arrays ranged from 8 to 16 items. Complete arrays and example stimuli are shown in Figure 2. Method
The method was similar to that in Experiment 1 and involved the following changes. Display size was 8, 12, or 16 items. The 120 stimulus pairs were generated from the complete arrays shown in Figures 2A and 2B. The interstimulus interval was increased to 1 sec in this experiment, although the duration of the first array remained
Percentage Correct
100 90 80
Regular same Regular different Irregular same Irregular different
70 60 50 8
12
16
Display Size Figure 2. Stimuli (panels A–D) and results (panel E) for Experiment 2. Panels A and B show the prototype stimulus patterns. Panels C and D show stimulus examples with a display size of 16. Panel E shows the mean percentage correct in each condition.
1102 Sanocki, Sellers, Mittelstadt, and Sulman Table 2 Overall Percentages Correct (PC) and Estimates of Sensitivity (d′, A′), Bias (c, b), and Capacity (k), for Each Display Size in Experiment 2 Sensitivity
Capacity Pashler Empty Pashler Both Display Size Reg. Irreg. Reg. Irreg. Reg. Irreg. Reg. Irreg. Reg. Irreg. Reg. Irreg. Reg. Irreg. Reg. Irreg. 8 84.39 85.08 2.32 2.38 .89 .90 2.24 2.02 1.29 1.10 6.11 6.49 12.21 12.98 18.32 19.48 12 79.02 73.56 1.94 1.43 .85 .80 2.29 2.24 1.40 1.37 8.12 6.94 8.12* 6.94 16.25 13.87 16 70.68 69.17 1.30 1.22 .78 .76 2.35 2.35 1.51 1.54 8.05 7.58 4.03 3.79 12.08 11.37 Note—Reg., regular; Irreg., irregular. *This value is identical to that for Pashler’s k because these two conditions are complements at display size 12 (when half of the elements are present). PC
d′
Bias
A′
c
200 msec. A larger sample of 33 students participated (21 female). The data for 4 additional participants were not included in the analy sis because those participants failed to follow the instructions.
Results Accuracy levels were intermediate and ranged from 84.7% at display size 8 to 69.9% at display size 16. In the ANOVA, the main effect of display size was reliable and moderately large [F(2,64) 5 55.50, p , .001, h 2p 5 .63]. The drop in accuracy from 8 to 16 items was 14.8%. Per formance at each display size was also measured in terms of sensitivity: d′ values for 8, 12, and 16 items were 2.3, 1.7, and 1.3, respectively (averages from Table 2). The Pashler’s k estimate was a capacity of 8.0 stimulus items. On a more intuitive level, using the largest display size as an example (see, e.g., Figures 2C and 2D), observ ers were able to hold many of the items in a 16-element display in VSTM, achieving a level of change detection of 70% for these complex displays. In this experiment, there was a small positive effect of regularity of texture gradient. Accuracy was 2.1% higher with the regular-texture gradients (78.0%) than with the irregular stimuli (75.9%) [SED 5 0.9%; for main effect of regularity, F(1,32) 5 5.19, p 5 .03, h 2p 5 .14]. Regularity of texture interacted with display size [F(2,64) 5 4.01, p 5 .02, h 2p 5 .11]; the advantage of regularity was reli able at the middle display size of 12 [t(32) 5 3.28, p , .01], but not at the other display sizes ( ps . .20). The only other reliable effect in the analysis was the interaction of display size and response [F(2,64) 5 21.07, p , .001]. Discussion This experiment confirms that the capacity of VSTM for texture elements is about 8 stimulus items. As display size increases beyond 8, the memory representation ap pears to lose resolution, lowering overall accuracy to 70% with 16 elements. The capacity estimates remain moder ately high with alternative assumptions (Table 2). With the denser displays, there was a small positive influence of systematic gradients. However, the inter pretation of this result may be somewhat complicated. Although gradient structure itself could increase perfor mance, note that the regular gradients have small elements near fixation. This means that element size decreases with cortical resolution, with the regular gradients. These fac tors should be disentangled in future research. In Experi ment 3, we continued our sampling of different types of stimulus displays.
b
Pashler’s k
Experiment 3 The purpose of Experiment 3 was to further explore ca pacity and grouping, with an emphasis on systematic 2-D displays. We began with a simple grid of identical circu lar elements organized as cardinal rows and columns (see Figure 3A). Much previous work on stimulus organization has assumed such organization. Both highly organized and less organized arrays have been selected from such matrices, and the more organized arrays have produced better memory performance (Hollingworth et al., 2005; Irwin, 1991). We asked a new question related to organization: What happens when organization into cardinal rows and col umns is disrupted? Regular displays were generated from the 5 3 5 matrix of dots with constantly spaced rows and columns and a rectangular frame (Figure 3A) and con tained 12 to 20 items. In this condition, there should be a relative abundance of organizational relations between el ements, including colinearity, various types of symmetry, and relations with the axes of the frame and the environ ment. The encoding of these relations should contribute to VSTM performance. We compared performance for regular arrays with that for arrays in which cardinal orga nization was disrupted. We created a prototype array with distorted interelement spacing and alignment and rotated the entire array to oblique axes (Figure 3B). In addition, the surrounding frame was tilted in the opposite direc tion. Oblique orientations are not encoded as strongly as cardinal orientations, which are more predominant in the environment (see, e.g., Lasaga & Garner, 1983; White, Coppola, & Fitzpatrick, 2001). Consequently, the irregu lar arrays should contain fewer regular relations and fewer horizontal and vertical relations that support efficient memory encoding. As noted, the present elements were simpler than those in the first two experiments, and there were no differences in the identities of the elements. Pilot work suggested that these stimuli would produce higher capacity than in Ex periment 2, so we increased the display sizes somewhat. Method
Display size was 12, 16, or 20 items. The 120 stimulus pairs were generated from the two 25-element prototypes shown in Figures 3A and 3B. For each stimulus pair, element positions were randomly selected from the relevant complete array. Across pairs, the changing element stayed within the upper or lower portion of the array half of the time. The irregular arrays were created by distorting positions in the regular arrays. The irregular arrays fit within the same square
Short-Term Memory for Layout 1103
A
B
C
D
100
E Percentage Correct
90 80
Regular same Regular different Irregular same Irregular different
70 60 50 12
16
20
Display Size Figure 3. Stimuli (panels A–D) and results (panel E) for Experiment 3. Panels A and B show the prototype stimulus patterns. Panels C and D show stimulus examples with a display size of 16. Panel E shows the mean percentage correct in each condition.
area as the regular arrays, but because of the irregular orientations, the interelement distances (including distances between changing elements) were slightly less than with the regular arrays. As pre viously, stimulus regularity was manipulated between blocks, and observers were shown the appropriate complete array before each block. Timing parameters were the same as in Experiment 2. A new sample of 16 students participated (11 female).
Results and Discussion Performance decreased modestly with display size from 77.7% at 12 items to 73.4% at 20 items, a total drop of 4.3% over an 8-item difference in display size (see Fig ure 3E and Table 3). The main effect of display size was reliable [F(2,15) 5 4.01, p 5 .03, h 2p 5 .21]. In addition, there was a benefit of stimulus regularity: Accuracy with regular displays was 6.9% higher than with irregular ar
rays [SED 5 1.6%; F(1,15) 5 20.91, p , .001, h 2p 5 .58]. The interaction of display size and regularity was mar ginal [F(2,30) 5 2.89, p 5 .07]. There was also a main effect of response [F(1,15) 5 23.04, p , .001]. Pashler ks were 13.4 items for regular displays and 8.7 for irregular displays (Table 3). With regular displays, ob servers held many of the elements in VSTM; for example, 16 element displays (e.g., Figure 3C) resulted in an 80% level of accuracy. Note that the k of 13.4 was obtained with items that were identical: There was no confound of identity and location. Also, there was no appearance of depth in these displays. It appears that a higher number of simple flat elements can be held in VSTM than can more varied elements that convey some depth (Experiments 1 and 2).
1104 Sanocki, Sellers, Mittelstadt, and Sulman Table 3 Overall Percentages Correct (PC) and Estimates of Sensitivity (d′, A′), Bias (c, b), and Capacity (k), for Each Display Size in Experiment 3 Sensitivity d′ PC Display Size Reg. Irreg. Reg. Irreg. 12 79.06 76.25 1.85 1.69 16 80.45 73.59 2.16 1.46 20 78.91 67.87 1.85 1.11 Note—Reg., regular; Irreg., irregular.
Bias A′
Reg. .86 .87 .86
Irreg. .84 .81 .75
c Reg. .04 .07 .04
b Irreg. .05 .05 .05
As can be seen in Table 3, d ′ values ranged from 1.8 to 2.2 in the regular conditions and from 1.1 to 1.7 in the irregular conditions. The difference in sensitivity between conditions was highly reliable [t(15) 5 4.95, p , .001]. Changes in bias in the main conditions were fairly small (Table 3). The sensitivity effects indicate that organization in regular horizontal and vertical matrices contributes to memory capacity. This result provides new evidence that organizational factors contribute to VSTM. We suggest that the greater symmetry and more regular relations of regular displays lead to more efficient memory coding be cause they support the creation of well-organized groups. The VSTM encoding system may work at least as well with 2-D relations as with apparent depth relations. A variety of types of groups may have been encoded in the regular conditions. First, the outer envelope of the display is a potentially salient feature, and grouping could involve the overall shape of this envelope or its compo nents (the four sides). Changes in elements could alter the envelope or open or close holes along the sides. Also, ele ments may form salient parts, such as a rectangle or line (see Figure 3C), and changes in these parts may be strong signals for change. Systematic study of types of grouping may be fruitful. Experiment 4 Experiments 1, 2, and 3 indicated that observers have a fairly high VSTM capacity for layout information. In each experiment, capacity estimates, in terms of number of stimulus elements, were significantly beyond two to four. The effects of display size were reliable but modest in Experiments 1 and 3, suggesting there may be a gradual loss of fidelity with display size in some cases. However, the stimuli in each experiment were relatively simple ele ments. Indeed, capacity reached its highest level with the simplest (and identical) elements (Experiment 3). Would layout capacity still be high if complex stimuli are used? Our goal in Experiment 4 was to push observers to the limit with a dense and complex naturalistic scene containing a multitude of object identities. The stimuli were generated from pictures of a highly colorful dollhouse with furniture and other sceneappropriate objects (shown in Figures 4A–4D). All stim uli were generated from this one dollhouse scene. Twelve regions were defined in the scene, with each region con taining its own collection of identifiable, fixed-location
Reg. 1.41 1.53 1.47
Irreg. 1.54 1.30 1.54
Pashler’s k Reg. Irreg. 8.05 7.30 10.70 8.99 13.36 8.74
Capacity Pashler Empty Reg. Irreg. 8.72 7.91 6.02 5.06 3.34 2.19
Pashler Both Reg. Irreg. 21.47 19.47 21.40 17.98 21.38 13.99
objects. In the entire 12-region scene, there was a total of 26 to 40 objects, depending on the criteria for objecthood. The objects included portions of the railing, a shed, and a wall. Pictures were taken with the regions filled (all of the region’s objects present) and empty (all of the region’s objects absent), and the regions were recombined in Pho toshop to create randomly varying layouts. Display size was varied by using 4, 6, or 8 filled regions. With the aver age of 2.17 objects per region (by the most conservative count), display sizes corresponded to an average of 8.7, 13.0, and 17.4 objects, respectively. To further examine the nature of the memory repre sentation, we restricted changes to occur within 1 of 3 superregions on each trial. As shown in Figure 4D, there was an outer superregion, in which changes altered the scene envelope. In addition, there were two superregions within the house: an inner-front and an inner-back region. On 33% of the trials, for example, the change was the deletion of objects in one inner-back region and the ap pearance of objects in another inner-back region. If the memory representation encodes the entire configuration, changes should be detected within each superregion. If the memory representation loses discrete objects or re gions as capacity is reached, certain superregions (e.g., inner-back regions) may suffer most. Alternatively, if the memory representation is defined mainly by its outer en velope, outer changes should be detected much better than are inner changes. To explore another potential organizational factor, we examined the contribution of an image property—the presence of color—to capacity. The dollhouse and objects contained a variety of bright colors (e.g, bright pink, yel low, blue, and white). Color is believed to be useful for segmenting complex scenes (see, e.g., Wurm et al., 1993) and may provide an additional feature that can be used to encode complex information in short-term memory. We compared performance on blocks with color images versus that on blocks with grayscale versions of the same scenes. Method
For the color condition, 54 pairs of stimulus layouts were deter mined by a random algorithm for choosing regions. The stimuli were then created by cutting and pasting from a set of highly colorful digital pictures that together showed each state of each region. Filled regions were randomly chosen with the constraint that changes (the deleted and new region) always occurred within one of the three superregions, each for one third of the trials (see Figure 4D). Fifty-
Short-Term Memory for Layout 1105
A
B
Inner
back front
Outer
C
front front
back front
back back
Inner
back front
back
front
Outer
D
E Percentage Correct
100 90 Same
80 70
Different
60 50 4
6
8
Display Size Figure 4. Stimuli (panels A–D) and results (panel E) from Experiment 4. Panel A shows the dollhouse with all locations filled. Panel B shows the 12 regions. Panels C and D show an eight-region stimulus pair in which the changing regions were the inner-lower left-rear and the inner-lower right-front.
four grayscale array pairs were created by converting the color pairs to grayscale in Adobe Photoshop. Each of the resulting 108 stimulus pairs was used twice, once for each response. The color and grayscale stimuli were blocked in sets of 18 trials with order counterbalanced. The type of image was illustrated before each block. The blank interval between the first and second arrays was 800 msec in this experiment, and the duration of the first stimu lus was 200 msec. Twelve students (6 female) participated.
Results Performance decreased modestly with increasing dis play size, from 81.5% correct at four regions to 75.5% and 77.0% at six and eight regions, respectively (Figure 4E). This was a total drop of 6% or 4.5% as the number of ob jects in the regions increased by an average of 8.4 objects. The main effect of display size was reliable [F(2,22) 5 6.53, p , .001, h 2p 5 .37]. The d′ values were 2.14, 1.52, and 1.78 for each respective display size (Table 4). Again, these results are consistent with a gradual loss of fidelity with display size.
Pashler’s k was 5.0 stimulus regions. The SE of the estimate was 0.28 regions. Nine of the 12 observers had capacities greater than four regions, and the difference be tween 4 and the observers’ capacities was reliable [t(12) 5 3.68, p , .01]. Thus, most observers held more than four stimulus regions in memory. If the observers represented all of the objects in the regions (average of 2.17 per re gion), the total number of stimulus objects contained in memory would be 10.8. The location of changes varied among the three super regions: outer, inner-front, and inner-back (Figure 4D). Performance varied modestly across region type, being most accurate for changes in the outer regions (82.5%), followed by the inner-front regions (78.0%) and the inner-back regions (73.4%) [for the main effect of su perregion, F(2,22) 5 6.23, p , .001, h 2p 5 .36]. How ever, performance within each region type was reliably greater than the 50% floor ( ps , .001). Thus, observers were maintaining information about layout in each of the
1106 Sanocki, Sellers, Mittelstadt, and Sulman Table 4 Overall Percentages Correct (PC) and Estimates of Sensitivity (d′, A′), Bias (c, b), and Capacity (k), Averaged Over the Regularity Condition for Each Display Size in Experiment 4 Display Size 4 6 8
PC 81.48 75.52 76.97
Sensitivity d′ A′ 2.14 .87 1.52 .82 .84 1.78
Bias c 2.23 2.25 2.37
three superregions. Change detection was not limited to alterations in scene envelope, although these alterations were most noticeable. Nor was change detection limited to inner alterations, which would be most likely to be part of a continuous spatial representation. This result is con sistent with the idea that the representation loses resolu tion as capacity is reached, beginning with the least salient details (inner-back regions). However, the result can also be explained in terms of fixed resolution and limited spa tial extent if one assumes that the location of the spatial limitation varies from trial to trial. That is, some regions may be represented at high resolution (producing accurate change detection), whereas other regions may not be rep resented. On a given trial, the least salient regions would be the least likely to be represented. Color images produced no advantages over grayscale images. Accuracy was as high with grayscale images (77.9%) as with color images (78.0%) (SED 5 1.7%). This suggests that the potentially useful but redundant feature of color was of no additional value in encoding or maintaining short-term memory, at least with familiar displays. There were three reliable interactions in the analysis, involving display size, superregion, and response. The interaction of display size and response was modest in magnitude (see Figure 4E) [F(2,22) 5 6.68, p , .001], suggesting that there was some variation in decision bias, with same responses becoming more likely with larger displays. Percentages correct for all relevant conditions are shown in Table 5. A same bias was involved in the other two interactions as well: the superregion 3 display
Table 5 Percentages Correct Within Each Superregion in Experiment 4 Display Size
Same
Condition Different
M
4 6 8
Outer Regions 85.4 86.1 84.7 62.6 86.1 90.3
85.8 73.6 88.2
4 6 8
Inner-Front Regions 81.9 72.9 86.8 77.8 88.9 59.7
77.4 82.3 74.3
4 6 8
Inner-Back Regions 86.1 76.4 76.4 64.6 80.5 56.2
81.3 70.5 68.4
b 1.25 1.18 1.48
Pashler’s k 2.95 3.64 5.00
Capacity Pashler Empty 5.90 3.65 2.51
Pashler Both 8.86 7.29 7.50
size interaction [F(4,44) 5 7.49, p , .001] and the threeway interaction of display size, response, and superregion [F(4,44) 5 7.07, p , .001]. As can be seen, same re sponses become more likely with larger displays and less salient critical regions (i.e., inner, but not outer, critical regions). These changes in bias are relatively small; they do not contravene the finding that change detection was fairly accurate across the four factors. Discussion The purpose of this experiment was to measure the ca pacity of VSTM for layout with a very complex scene. We found that performance was modestly affected by display size; there was no indication of a sharp limit in short-term memory capacity. The estimate of memory capacity was 5.0 stimulus regions, or an average of 10.8 objects (as suming that all objects in a region were encoded). This is a substantial portion of a complex scene, but is still less than the entire scene. Information was most likely to be missing from the least salient regions (inner-back super region), but information was lost in all regions. This is most consistent with the idea that there was an overall loss in fidelity when the scene’s complexity exceeded capacity. Complex scene details appear to have been represented at a moderate level of resolution. Because the scene contained some highly distinctive objects, it is possible that the identities of objects may have contributed to performance. For example, observ ers could have noticed changes in the presence of certain objects, such as a desk or a chair. However, the high capac ity obtained without any object identities in Experiment 3 argues against a general explanation of VSTM capacity that depends on object identity. General Discussion The purpose of the present experiments was to examine the capacity of VSTM for the layout of objects across a sample of different stimulus situations. Consistent with previous suggestions in the literature, we obtained esti mates of moderate to high capacity for layout: Capacity estimates ranged between 5 multiobject stimulus regions (about 11 objects), with the most complex naturalistic scene in Experiment 4, to 13.4 stimulus elements with the flat (2-D) grid of uniform objects in Experiment 3 (regular condition). VSTM capacity for layout can be illustrated in terms of the stimulus displays and performance levels. Partici pants held almost all of the somewhat complex displays
Short-Term Memory for Layout 1107 of Experiment 1 in memory (Figures 1C and 1D) and held much of the more complex displays of Experiments 2, 3, and 4 in memory (Figures 2C, 2D, 3C, 4C, and 4D). There was not, however, a complete representation of the object layout in the complex displays: The intermediate levels of performance in the later cases indicate that, although many details were remembered, many were lost. The numerical capacity estimates are in terms of num bers of stimulus elements. As noted, grouping of elements is likely to reduce the number of representational units below these estimates. A variety of types of grouping and configural strategies may be employed, as discussed in Experiment 3. The present findings can be interpreted from several perspectives. The experiments were motivated by the idea that a fairly high memory capacity for layout has evolved in humans. We propose that this ability is critical for what can be called remote visual understanding, where the gath ering and integration of information from the surrounding environment is paramount. An excellent example of re mote visual understanding would be the task of scouts or watchpersons, which is to monitor surrounding areas for activity. A high memory capacity for scenic layout would support this duty. However, the duty is removed from im mediate action because the information gained need not be used immediately. Thus, the mechanisms of remote vi sion and visually guided action may well be different (see also, e.g., Goodale, Gonzalez, & Króliczak, 2008). What can we say about the memory system that un derlies layout memory? We have proposed that layout memory encodes objects and locations in a configural manner across expanses that can be fairly broad. We be lieve that the memory representation is best thought of as a hierarchical network of nodes (concepts) and the rela tions between them (e.g., Sanocki, 2003). At the highest level is encoding of the scene, which would be linked to intermediate nodes for groupings or subregions within the scene, then the basic scene entities (e.g., objects and surfaces). In this model, the key to memory capacity is the encoding of relations between nodes. Relations would include both spatial predicates, such as next to or behind, and grouping relations, such as part of. For example, in Experiment 4, the house scene would involve a network that included the 12 basic scene entities (the 12 regions). The regions would have two states: filled (e.g., with fur niture) or empty. Relations would encode the layout of the regions (e.g., in front of, said of cart or dining table) and specific grouping relations on a particular trial. For example, if the left two yard regions were empty on a trial, they could be part of the “left side (empty)” group. Filled right-yard regions might be part of the “right side (filled)” group. Changes of these relations, as well as of the basic entities, could support change detection. Thus, both the individual objects and their relations to each other are part of the memory code (see also, e.g., Hollingworth, 2007; Jiang et al., 2000; Olson & Marshuetz, 2005; Vidal, Gau chou, Tallon-Baudry, & O’Regan, 2005). In this model, the higher accuracy of change detec tion for outer regions in Experiment 4 would be due to the increased salience of the stimulus information (about
entities and their relations) within those regions. There would be nothing special about the outer regions beyond the ease of encoding their states and their interrelations. Salience should also be high for the inner-front regions, as opposed to that for the inner-back regions, because of their increased visibility. This is reflected in the ordering of performance in Experiment 4. A weakness of the network model is that additional relations can be added to account for many results, mak ing the model difficult to falsify. In order to deal with the plethora of relations that may be encoded in a network, Sanocki (1999) proposed comparing conditions in which there should be more or fewer relations. This approach was used in Experiment 3, in which a standard matrix with horizontal and vertical structure was compared with an irregular matrix. The standard matrix should support the encoding of more relations between the elements than the irregular matrix, and the increased memory capacity in the standard condition is consistent with this idea. However, relative to less systematic surfaces, texture gradients either did not facilitate memory (Experiment 1) or had a small positive effect (Experiment 2). Perhaps hu mans are fairly good at encoding interitem relations, and the irregular gradients provided enough interrelation for efficient encoding (cf. examples in Figures 1C and 1D and in Figures 2C and 2D). Also, note that redundant color in formation may aid segmentation (e.g., Wurm et al., 1993), but it did not aid layout memory in the present Experi ment 4. Additional research will be necessary to develop the network perspective and distinguish it from other per spectives. Understanding interitem relations will be key to developing this perspective. An alternative perspective is the well-supported hy pothesis that VSTM capacity is defined in terms of ob jects and that the number of objects is limited to three or four items (e.g., Vogel et al., 2001). In the present ex periments, small numbers of objects would be created by grouping object elements into larger units. In Experi ments 1, 2, and 3, groups of two to four elements would be needed to bring the total number of entities to within four. In Experiment 4, some of the regions would have to be grouped together to bring the number of entities down to four. In keeping with the assumption that VSTM coding is discrete (all or none; see, e.g., Zhang & Luck, 2008), one could assume that each element either joins a group or is lost and that the probability of loss increases gradu ally with display size. An alternative object-based model is that attention was distributed across each stimulus array to encode a single complex object configuration or layout configuration. A third perspective is that multiple encoding systems contribute to VSTM capacity for layout. For example, Rensink (2000a) proposed that a limited-capacity at tentional system for perceiving objects (i.e., VSTM) is complemented by a larger scale system for encoding the setting and layout of the scene. The detection of changes in object layout could come from either the attentional VSTM system or the layout system. The attentional sys tem is flexible but should excel at encoding objects and certain interobject relations, including grouping between
1108 Sanocki, Sellers, Mittelstadt, and Sulman nearby objects. In contrast, the layout system could encode the arrangement of major entities in the scene, as well as scenewide properties, such as the scene envelope. Thus, in this model, the increased accuracy for outer changes in Experiment 4 could be attributed to information about the scene envelope from the layout system. Inner-front regions are probably more likely to be attended than innerback regions, and this would explain the increased accu racy for inner-front regions. One other feature of the multiple-system model is that there is not a single short-term memory system for scene layout information. Whereas the attentional system may be short term in nature, the layout system could be a working memory that serves as an entrance to long-term memory (see Melcher, 2001, 2006). Author Note Portions of the present results were presented at the First Annual Meeting of the Vision Sciences Society, May 2001, and the 42nd Annual Meeting of the Psychonomic Society, November 2001. We thank mem bers of the Vision–Cognition–Design Lab at the University of South Florida for their help in conducting the experiments. Correspondence concerning this article should be addressed to T. Sanocki, Department of Psychology, PCD 4118, University of South Florida, Tampa, FL 336208200 (e-mail:
[email protected]). References Aginsky, V., & Tarr, M. J. (2000). How are different properties of a scene encoded in visual memory? Visual Cognition, 7, 147-162. Alvarez, G. A., & Cavanagh, P. (2004). The capacity of visual shortterm memory is set both by visual information load and by number of objects. Psychological Science, 15, 106-111. Alvarez, G. [A.], & Oliva, A. (2007). The role of global layout in vi sual short-term memory. Visual Cognition, 15, 70-73. Awh, E., Barton, B., & Vogel, E. K. (2007). Visual working memory represents a fixed number of items regardless of complexity. Psychological Science, 18, 622-628. Baddeley, A. D., & Hitch, G. J. (1974). Working memory. In G. H. Bower (Ed.), The psychology of learning and motivation: Advances in research and theory (Vol. 8, pp. 47-89). New York: Academic Press. Brockmole, J. R., Wang, R. F., & Irwin, D. E. (2002). Temporal integration between visual images and visual percepts. Journal of Experimental Psychology: Human Perception & Performance, 28, 315-334. Eng, H. Y., Chen, D., & Jiang, Y. (2005). Visual working memory for simple and complex visual stimuli. Psychonomic Bulletin & Review, 12, 1127-1133. Enns, J. T. (1987). A developmental look at pattern symmetry in percep tion and memory. Developmental Psychology, 23, 839-850. Franconeri, S. L., Alvarez, G. A., & Enns, J. T. (2007). How many locations can be selected at once? Journal of Experimental Psychology: Human Perception & Performance, 33, 1003-1012. Gibson, J. J. (1979). The ecological approach to visual perception. Bos ton: Houghton Mifflin Harcourt. Goodale, M. A., Gonzalez, C. L. R., & Króliczak, G. (2008). Action rules: Why the visual control of reaching and grasping is not always influenced by perceptual illusions. Perception, 37, 355-366. Grimes, J. (1996). On the failure to detect changes in scenes across saccades. In K. Akins (Ed.), Perception (Vancouver Studies in Cog nitive Science, Vol. 5, pp. 89-110). New York: Oxford University Press. He, Z. J., Wu, B., Ooi, T. L., Yarbrough, G., & Wu, J. (2004). Judging egocentric distance on the ground: Occlusion and surface integration. Perception, 33, 789-806. Hollingworth, A. (2004). Constructing visual representations of natu ral scenes: The roles of short- and long-term visual memory. Journal
of Experimental Psychology: Human Perception & Performance, 30, 519-537. Hollingworth, A. (2005). The relationship between online visual rep resentation of a scene and long-term scene memory. Journal of Experimental Psychology: Learning, Memory, & Cognition, 31, 396-411. Hollingworth, A. (2006). Scene and position specificity in visual memory for objects. Journal of Experimental Psychology: Learning, Memory, & Cognition, 32, 58-69. Hollingworth, A. (2007). Object-position binding in visual memory for natural scenes and object arrays. Journal of Experimental Psychology: Human Perception & Performance, 33, 31-47. Hollingworth, A., Hyun, J.-S., & Zhang, W. (2005). The role of visual short-term memory in empty cell localization. Perception & Psychophysics, 67, 1332-1343. Intraub, H. (1997). The representation of visual scenes. Trends in Cognitive Sciences, 1, 217-222. Irwin, D. E. (1991). Information integration across saccadic eye move ments. Cognitive Psychology, 23, 420-456. Irwin, D. E., & Zelinsky, G. J. (2002). Eye movements and scene per ception: Memory for things observed. Perception & Psychophysics, 64, 882-895. Jiang, Y., Olson, I. R., & Chun, M. M. (2000). Organization of visual short-term memory. Journal of Experimental Psychology: Learning, Memory, & Cognition, 26, 683-702. Lasaga, M. I., & Garner, W. R. (1983). Effect of line orientation on various information-processing tasks. Journal of Experimental Psychology: Human Perception & Performance, 9, 215-225. Liu, K., & Jiang, Y. (2005). Visual working memory for briefly pre sented scenes. Journal of Vision, 5, 650-658. Logie, R. H. (1995). Visuo–spatial working memory. Hillsdale, NJ: Erlbaum. Luck, S. J. (2008). Visual short-term memory. In S. J. Luck & A. Hol lingworth (Eds.), Visual memory (pp. 43-85). New York: Oxford Uni versity Press. Melcher, D. (2001). Persistence of visual memory for scenes. Nature, 412, 401. Melcher, D. (2006). Accumulation and persistence of memory for natural scenes. Journal of Vision, 6, 8-17. Miller, G. A. (1956). The magical number seven, plus or minus two: Some limits on our capacity for processing information. Psychological Review, 63, 81-97. Ni, R., Braunstein, M. L., & Andersen, G. J. (2005). Distance percep tion from motion parallax and ground contact. Visual Cognition, 12, 1235-1254. Olson, I. R., & Marshuetz, C. (2005). Remembering “what” brings along “where” in visual working memory. Perception & Psychophysics, 67, 185-194. O’Regan, J. K. (1992). Solving the “real” mysteries of visual percep tion: The world as an outside memory. Canadian Journal of Psychology, 46, 461-488. Palmer, S. E. (1975). Visual perception and world knowledge: Notes on a model of sensory–cognitive interaction. In D. A. Norman, D. E. Rumelhart, & LNR Research Group (Eds.), Explorations in cognition (pp. 279-307). San Francisco: Freeman. Pashler, H. (1988). Familiarity and visual change detection. Perception & Psychophysics, 44, 369-378. Phillips, W. A. (1974). On the distinction between sensory storage and short-term visual memory. Perception & Psychophysics, 16, 283-290. Rensink, R. A. (2000a). The dynamic representation of scenes. Visual Cognition, 7, 17-42. Rensink, R. A. (2000b). Visual search for change: A probe into the na ture of attentional processing. Visual Cognition, 7, 345-376. Sanocki, T. (1999). Constructing structural descriptions. Visual Cognition, 6, 299-318. Sanocki, T. (2003). Representation and perception of scenic layout. Cognitive Psychology, 47, 43-86. Sanocki, T., Michelet, K., Sellers, E., & Reynolds, J. (2006). Rep resentations of scene layout can consist of independent, functional pieces. Perception & Psychophysics, 68, 415-427. Sanocki, T., & Sulman, N. (2009). Priming of simple and complex scene layout: Rapid function from the intermediate level. Journal of
Short-Term Memory for Layout 1109 Experimental Psychology: Human Perception & Performance, 35, 735-749. Sebrechts, M. M., & Garner, W. R. (1981). Stimulus-specific pro cessing consequences of pattern goodness. Memory & Cognition, 9, 41-49. Simons, D. J. (1996). In sight, out of mind: When object representations fail. Psychological Science, 7, 301-305. Torralba, A. (2003). Contextual priming for object detection. International Journal of Computer Vision, 53, 169-191. Tsal, Y., Meiran, N., & Lamy, D. (1995). Towards a resolution theory of visual attention. Visual Cognition, 2, 313-330. Vecera, S. P., & Palmer, S. E. (2006). Grounding the figure: Surface attachment influences figure–ground organization. Psychonomic Bulletin & Review, 13, 563-569. Vidal, J. R., Gauchou, H. L., Tallon-Baudry, C., & O’Regan, J. K. (2005). Relational information in visual short-term memory: The structural gist. Journal of Vision, 5, 244-256. Vogel, E. K., Woodman, G. F., & Luck, S. J. (2001). Storage of fea
tures, conjunctions, and objects in visual working memory. Journal of Experimental Psychology: Human Perception & Performance, 27, 92-114. White, L. E., Coppola, D. M., & Fitzpatrick, D. (2001). The contri bution of sensory experience to the maturation of orientation selectiv ity in ferret visual cortex. Nature, 411, 1049-1052. Wolfe, J. M., Klempen, N., & Dahlen, K. (2000). Postattentive vision. Journal of Experimental Psychology: Human Perception & Performance, 26, 693-705. Wurm, L. H., Legge, G. E., Isenberg, L. M., & Luebker, A. (1993). Color improves object recognition in normal and low vision. Journal of Experimental Psychology: Human Perception & Performance, 19, 899-911. Zhang, W., & Luck, S. J. (2008). Discrete fixed-resolution representa tions in visual working memory. Nature, 453, 233-235. (Manuscript received June 4, 2008; revision accepted for publication January 18, 2010.)