Volume 13 • Number 8 • 2010 VA L U E I N H E A LT H
How Is Evidence on Test Performance Synthesized for Economic Decision Models of Diagnostic Tests? A Systematic Appraisal of Health Technology Assessments in the UK Since 1997 vhe_762
952..957
Nicola Novielli, BSc, MSc, Nicola J. Cooper, BSc, MSc, PhD, Keith R. Abrams, BSc, MSc, PhD, Alex J. Sutton, BSc, MSc, PhD Department of Health Sciences, University of Leicester, Leicester, UK
A B S T R AC T Objectives: The study aims to assess how evidence on diagnostic test accuracy is synthesized and used to inform economic decision modeling for HTA. Methods: All reports evaluating diagnostic test via an economic decision model published by the NHS Research and Development Health Technology Assessment (HTA) program since 1997 were identified. The methods for evidence synthesis of diagnostic test accuracy data and its use in economic decision modeling in this sample were reviewed. Results: Forty-four HTA reports out of 474 concerned diagnostic accuracy, of which 11 did not do any economic evaluation. Of the remaining 33 HTAs, 14 conducted meta-analyses of diagnostic accuracy in the clinical review but only 8 used such pooled estimates to inform the decision model. A number of meta-analysis methods ranging in complexity were
applied to estimate diagnostic accuracy. Nevertheless, when it came to informing the economic decision model, the majority of reviews used independent meta-analytic estimates of sensitivity and specificity. Conclusions: Often, very simplistic methods to estimate diagnostic test accuracy were used for purposes of informing an economic decision model. The assumptions made by the simplistic methods are usually invalid which may lead to suboptimal decisions being made. It is desirable that decision modelers become aware of the rapid evolution of metaanalysis methods in this area; however, further research is still required to identify how the pooled results obtained from the different meta-analysis models should best be used to inform economic decision models. Keywords: decision models, diagnostic test accuracy, economic evaluation, health technology assessment.
Introduction
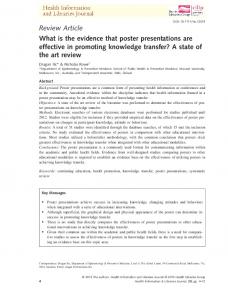
highlight the covariation between the two outcomes. The best diagnostic tests will be those that maximize both sensitivity and specificity (i.e., positioned in the upper-left corner of the ROC space where both sensitivity and specificity are close to one) [2]. Evidence synthesis of diagnostic test accuracy data are more complicated than for intervention studies because of additional issues relating to variable test threshold levels, dependence between outcomes (i.e., sensitivity and specificity), and use of multiple tests in combination. To date, at least six different approaches to the meta-analysis of studies reporting pairs of sensitivity and specificity estimates have been developed, each producing results in different formats (Fig. 1). The approaches are next described briefly in order of sophistication. For a more technical description, see Deeks [3] (methods 1, 2, and 3), Harbord et al. [4] (methods 4 and 5), Dukic and Gatsonis [5], and references therein:
The creation of structures in the UK (i.e., National Institute for Health and Clinical Excellence) and elsewhere to facilitate evidence-based health policy decision-making has highlighted the role that systematic reviews including, where appropriate, metaanalysis, and economic evaluations have to play in the decisionmaking process. These methodologies provide answers to fundamental questions such as: Does the technology work, for whom, at what cost, and how does it compare with alternatives [1]? In the area of diagnostic test performance, such evidencebased evaluations are crucial to the decision-making process as early diagnosis can lead to diseases being treated more successfully than if treatment were delayed. Diagnostic test accuracy is defined as the ability of a test to distinguish between patients with a specified target condition and those without [2]. The results of a diagnostic test accuracy study are usually expressed in terms of sensitivity (i.e., the proportion of people with the condition correctly detected by the test) and specificity (i.e., the proportion of people without the condition correctly detected by the test), the positive predictive value (i.e., the proportion of people with positive test results who have the disease) and negative predictive value (i.e., the proportion of people with negative test results who do not have the disease), the likelihood ratios for the respective test results or the receiveroperating characteristic (ROC) curve [3]. The ROC curve (Fig. 1b) provides a plot of sensitivity versus (1-specificity) to Address correspondence to: Nicola J. Cooper, Department of Health Sciences, Adrian Building, University of Leicester, University Road, Leicester LE1 7RH, UK. E-mail:
[email protected] 10.1111/j.1524-4733.2010.00762.x
952
1.
2.
Independent meta-analyses of sensitivity and specificity assuming independence of the two [6]. Because there is usually a trade-off to be made between sensitivity and specificity which is done by varying the threshold value used to categorize diseased and nondiseased (i.e., when high test results are positive, decreasing the threshold value will increase sensitivity and lower specificity, and vice versa), this method is only valid if all primary studies report test performance using the same threshold. This method produces a summary point on the ROC plane for the pooled sensitivity and specificity (Fig. 1a). Meta-analysis of diagnostic odds ratios [6]. This method relaxes the assumption that all studies use the same test threshold. In doing so, this method produces a symmetric summary receiver operating curve (sROC) (Fig. 1b). This
© 2010, International Society for Pharmacoeconomics and Outcomes Research (ISPOR)
1098-3015/10/952
952–957
953
Synthesis of Diagnostic Test Accuracy for HTA c
0.8 0.6
Sensitivity
0.0
0.0
0.2
0.4
0.6 0.4 0.2
Sensitivity
0.8
1.0
1.0
a
0.0
0.2
0.4
0.6
0.8
0.0
1.0
0.2
1-Specificity
0.4
0.6
0.8
1.0
0.8
1.0
1-Specificity
b 1.0
1.0
0.8
0.8
d
0.6
Sensitivity
0.2
0.4
0.6 0.4
0.0
0.0
0.2
Sensitivity
X
0.0
0.2
0.4 0.6 1-Specificity
0.8
0.0
1.0
0.2
0.4
0.6
1-Specificity
X = mean sensitivity and specificity with associated 95% confidence region Figure 1 Illustration of the different formats of the analysis output obtained when the five alternative approaches to meta-analysis of diagnostic test data are applied. (a) Independent meta-analyses of sensitivity and specificity. (b) Meta-analysis of diagnostic odds ratios. (c) sROC regression modeling approach. (d) Bivariate and hierarchical sROC models. sROC, summary receiver operating curve.
3.
assumes that the variances of the distributions of test values are the same in both the diseased and nondiseased populations. sROC regression modeling approach of Littenberg and Moses [7]. This approach extends the previous oneparameter model to a two-parameter model; that is, a further parameter is included to allow the sROC to be asymmetric (Fig. 1c). The limitations of this approach include: 1) its failure to fully account for the uncertainty in the data; and 2) it is a fixed effect method and hence any between-study heterogeneity is ignored [2].
4.
5.
Hierarchical sROC model. This model essentially extends regression method 3 to allow for heterogeneity (beyond that accounted for by differences in thresholds between studies) in performance between studies, allowing each study to be assumed to be sampled from a distribution of sROC curves [8] (Fig. 1d, sROC curve). Bivariate meta-analysis models. This random effects model models sensitivity and specificity and their correlation within a single model [8,9]. This produces a joint confidence region around the pooled sensitivity and specificity [4] (Fig. 1d, dotted confidence region). It has been shown
Novielli et al.
954
6.
recently that the hierarchical sROC model (method 4) and the bivariate model are mathematically equivalent [4] (although the two parameterisations lead naturally to the different parameter summaries presented in Fig. 1d). Synthesis of test performance at multiple thresholds from the individual studies [5]. Although rarely done in practice, it is possible to extend the hierarchical sROC model to include multiple data points from the primary studies relating to multiple test thresholds to produce an overall sROC curve (not shown graphically).
Note that study level covariates could be added to any of the said models in an attempt to explain between-study heterogeneity. As the format of the results produced by each of the different metaanalysis models differs considerably (Fig. 1), the challenge when evaluating the cost-effectiveness of diagnostic tests is how best to synthesize the available evidence and then appropriately incorporate the results of this synthesis in an economic decision model. Recent guidance from the Cochrane Diagnostic Test Accuracy Group advises reviewers to use the hierarchical sROC (method 4) or the bivariate model (method 5) as both of these methods overcome the limitations of methods 2 and 3 outlined. The Group discredits method 1 because such an approach may identify a summary point that is not representative of the paired sensitivity and specificity data (that is, a point that does not lie on the sROC curve). In this article, we investigate how evidence on test accuracy is used to inform decision models developed to evaluate the cost-effectiveness of diagnostic tests. In particular, we focus on diagnostic tests evaluated as part of the NHS Research and Development Health Technology Assessment (HTA) program since 1997 and investigate how the evidence on diagnostic test accuracy identified as part of the systematic review is used to inform the diagnostic test accuracy parameter(s) of the economic decision model. Where evidence synthesis methods have been applied to combine test accuracy data from a number of studies, the review focuses on the specific metaanalysis models adopted and how these pooled results are used in the economic evaluation, if at all.
Methods All NHS Research & Development HTA program reports listed on their website (http://www.ncchta.org/project/htapubs.asp) as published between 1997 and May 2009 inclusively were reviewed by one of the authors (NN) with the aim of identifying reports that evaluated the performance of diagnostic tests. First, the HTA reports were categorized, based on their title, as: 1) Methodology; 2) Treatments alone; or 3) Testing. Where classification was unclear from the title, abstracts followed by executive summary and then introduction were reviewed as necessary. The second step was to subdivide those HTA reports classified as Testing into one of the following subgroups: 1) Diagnosis; 2) Screening; 3) Prognosis; and 4) Monitoring. Occasionally, a report could be classified into more than one subgroup. If a report contained diagnosis and prognosis, screening or monitoring, then the report was classified as diagnosis. For all other combination, the report was classified according to its main objective established by reading the main text of the report. Where the purpose(s) of the testing was unclear, categorization was established via consensus forming discussions with two further authors (NJC and AJS). All reports evaluating diagnostic tests were reviewed to identify whether an economic decision model had been developed as part of the HTA. Those reports where economic models had been developed were examined further to establish whether they con-
tained meta-analyses of diagnostic accuracy data in the clinical review section of the report. Those that had defined our sample of interest, and these reports were scrutinized further. Specifically, data were extracted on: 1. 2.
3.
all meta-analysis methods used in the clinical review; whether any of the meta-analysis methods recorded in point 1 above were used to derive estimates of test performance for the economic model. If yes, which method used. If no, the alternative method used to estimate diagnostic test accuracy parameters specifically for the economic model; and whether the economic model had considered pathways involving multiple test combinations, and if so, how test performance had been estimated for the combinations of tests.
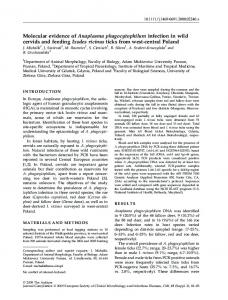
Results Figure 2 shows our classifications of the 474 HTA reports published between 1997 and May 2009 inclusively. A total of 110 out of the 474 reports (23%) were classified as “Testing,” with 44 (40%) of these focusing on “Diagnosis.” A total of 33 out of the 44 “Diagnosis” reports (75%) included an economic evaluation. Of these 33, 14 (42%) included meta-analysis of diagnostic test accuracy in the clinical review section of the report and these 14 reports define our sample of interest (a numbered reference list [S1–14] for this sample is provided in the appendix at: http://www.ispor.org/Publications/value/ViHsupplementary/ ViH13i8_Cooper.asp). In Table 1, the 14 reports that performed meta-analysis as part of the clinical review are listed chronologically together with the meta-analysis method(s) used (denoted by the letter R in the table). The methods are listed broadly in order of complexity and it can be observed that most reports used more than one metaanalysis method. All of the reports, except one (S9), included independent meta-analyses on specificity and sensitivity, thus assuming the two measures to be independent. One of these reports used individual participant data in its meta-analysis rather than summary data (S13). Two reviews adopted a strategy based on heterogeneity; that is, where evidence of heterogeneity existed, the Littenberg and Moses regression approach was adopted, otherwise independent pooled estimates of sensitivity and specificity were obtained (S1, S6). The most sophisticated methods of bivariate and hierarchical sROC were only applied by two of the reviews (S9, S10). Five of the reports considered study-level covariates in their analyses (S4, S5, S9, S14, S15). Table 1 also highlights which meta-analysis method (if any) is used to inform the test accuracy parameters in the economic decision model (denoted by the letter M in the table). Where the letters R and M appear in the same cell of the table, this indicates that one of the meta-analysis approaches used in the clinical review was also used to inform the economic decision model. Where the letter M appears in a cell on its own, this indicates that a different meta-analysis method was used specifically to inform the decision model. A total of 8 out of 14 reports (57%) used independent pooled estimates of sensitivity and specificity obtained from meta-analyses performed in the clinical review as inputs into the decision model; 5 (36%) used study data identified by the clinical review but performed their own meta-analyses (3 out of 5 reports did independent meta-analyses on sensitivity and specificity, 1 out of 5 report did a bivariate meta-analysis model, and 1 out of 5 report obtained negative predictive values and ratio of test positive to test negative); and 1 report used sources external to the clinical review plus consensus
955
Synthesis of Diagnostic Test Accuracy for HTA
Figure 2 Flowchart of excluded and included studies.
opinion. Overall, the majority of reports (10 out of 14 [71%]) used pooled estimates of sensitivity and specificity obtained from the simplest meta-analysis method, that assumes the two measures are independent of one another, as inputs into the economic decision model. Only two economic decision models used estimates of sensitivity and specificity from meta-analyses that allowed for the correlation between the two quantities
attributed to test thresholds varying between studies (i.e., a bivariate model). None of the models used a meta-analysis method that derives an sROC (i.e., Diagnostic odds ratio, Littenberg and Moses regression method, hierarchical sROC curve). A total of 10 out of the 14 models reviewed (77%) incorporated the uncertainty associated with pooled estimates to perform a probabilistic cost-effectiveness evaluation.
Table 1 Meta-analysis methods applied in the systematic review of diagnostic test accuracy (R) and results used as input parameter in the economic decision model (M) HTA report Volume/number 2002 Meta-analytic methods used to evaluate diagnostic accuracy Independent sensitivity and specificity Likelihood ratio Diagnostic odds ratio Littenberg and Moses regression approach Littenberg and Moses if heterogeneity, if not independent Bivariate model Hierarchical Summary Receiver Operating Characteristic curve
S2 M
2004 S7 R, M R
S6 R, M‡ R
2006 S11 R, M
S8 R, M
S5 R, M R
S12 M§ R
R R
2007 S13 R, M
S14 R R
R R
S3* R R R
S1 M
2008 S9
R
2009
S10 R, M R R
R
R
R M¶
R, M** R
*Used data from systematic review to obtain negative predictive values (number of true negatives divided by total number of negatives) and ratio of test positives to test negatives. † Used data from external sources and consensus opinion. ‡ Used median sensitivity and specificity. §Expert opinion used where no studies identified in the systematic review. ¶ Performed a series of regression analyses to establish the relationship between sensitivity and specificity. **Unclear how the bivariate data are dealt with in the probabilistic decision model.
S4† R
956
Evaluation of a Combination of Diagnostic Tests A total of 6 out of the 14 (43%) reports listed in Table 1 considered a combination of diagnostic tests in the economic decision modeling. Two of these (S8, S13) assumed the tests to perform independently of one another and thus input the pooled estimates of sensitivity and specificity obtained for each test direct from the meta-analyses. Two reports (S3, S14) assumed the second test to have 100% sensitivity and 100% specificity (i.e., a perfect test). Only one report (S5) clearly stated that the specificity of a second test (d-dimer) depended on the result obtained from the first test (Wells criteria). This was possible due to the data available; that is, a number of studies reported the sensitivity and specificity of the d-dimer stratified by the Wells score [10] (test performance was assumed independent for all other test combinations evaluated in this report). The remaining report (S12) provided no details about how the combination of tests was evaluated.
Discussion The focus of this review has been to assess how evidence on test accuracy is synthesized and used to inform economic decision models evaluating diagnostic pathways. The 14 HTA reports reviewed here were all published in the last 7 of the 12-year period considered suggesting that economic evaluation of diagnostic tests via decision models is in its infancy. Because of this, it is perhaps not surprising that little has been written on the associated methodology [11]. Many of the reports used a range of different meta-analysis methods to synthesize the test performance data. This in itself can be problematic because virtually all the methods make different assumptions, and therefore, theoretically cannot simultaneously be appropriate for a given dataset. Ideally, authors should assess how well each of the proposed models fits the data to identify the “best” fitting model and thus facilitate interpretation regarding the most appropriate summary of test performance [N. Novielli et al., unpublished data]. Multiple methods were used in many of the clinical reviews but, despite this, the majority of the reports applied the simple meta-analytic approach of assuming sensitivity and specificity to be independent for informing the decision model. This is concerning because it has been established that when this model is used inappropriately (i.e., the primary studies evaluate tests at different thresholds), the resulting point estimate underestimates true test performance [3] (i.e., it lies below the sROC curve that would be produced by an analysis that takes threshold into account). Additionally, if a probabilistic modeling approach is used, this approach will estimate the uncertainty incorrectly. Although half the reports calculated pooled likelihood ratios for test performance; none went on to use these estimates to inform the decision model. This is understandable because it is not as straightforward to use likelihood ratios compared to estimates of sensitivity and specificity to estimate the number of true positives, true negatives, false positives, and false negatives required by the typical parameterization of decision models evaluating diagnostic tests. Similarly, although methods that estimate an sROC curve (i.e., diagnostic odds ratios and the regression method of Littenberg and Moses) were conducted quite frequently, the output from these analyses was never used to inform the decision model. Again, this may well be because it is not obvious how to parameterize output in the form of an sROC curve in the decision model. Indeed, one report (S13) stated that meta-analyses were performed on sensitivity and specificity separately, rather than calculating an sROC curve, to obtain the parameters needed for the economic decision model.
Novielli et al. An sROC curve describes how test performance varies with changing test threshold, therefore it would be possible to consider the cost-effectiveness of a diagnostic strategy as a function of test threshold. This could be achieved most simply by running a series of decision models using estimates of sensitivity and specificity for the test(s) at different locations on the sROC curve. In this way, it is possible to identify the optimum threshold—in terms of cost-effectiveness—to use a test at (although it should be acknowledged that, in practice, specifying an exact threshold may or may not be achievable). To our knowledge, this approach has only been attempted once in the published literature [11]. A bivariate model, which accounts for the correlation between sensitivity and specificity, was used in two of the reports. There would appear to be growing consensus in the statistical literature that this is the most appropriate model for metaanalyzing test performance data [4,12]. Therefore, this finding could be interpreted as disappointing. Nevertheless, it is important to remember that this approach to meta-analysis of diagnostic test data was only described in the literature in 2005 [9], with custom software appearing even more recently (e.g., a macro for Stata [13]). It is important to appreciate that it is likely that the research for the HTA reports reviewed here was undertaken before the publication of this key article [9] in the majority of cases. Even once the parameter estimates for the bivariate model have been obtained, for a probabilistic decision model, it will be necessary to specify a multivariate normal distribution or a reparameterization or approximation to it that is nontrivial (i.e., one of the articles stated using Cholesky Decomposition for this [S14]). Alternatively, it is possible to use a one-stage comprehensive approach to the decision modeling where the meta-analyses are carried out simultaneously in the same computer program that evaluates the decision model. This has been described elsewhere [11] using the WinBUGS software [14] which implements MCMC simulation methods, and perhaps provides the most elegant approach available to date. Despite the above, it is the authors’ belief that the bivariate approach should not be used uncritically for the following reason. The method estimates a 95% confidence region for the average sensitivities and specificities observed in the primary studies. Therefore, it is implicit that all the studies are representative of how the test will be used in routine practice. If for example, particular studies use test thresholds which are not representative of routine practice/a particular threshold being considered, then such an analysis would seem inappropriate. In such cases, exploring cost-effectiveness as a function of an sROC curve, or at one particular point on the curve, would seem more appropriate (although, study level data relating to test threshold is not routinely included in the meta-analysis models and therefore it is not obvious which point on an sROC curve relates to a particular threshold). Given this, further research is required to establish the optimal approach in different situations and this is ongoing. To add further confusion to this already complex area, it was recently established that the bivariate model and the hierarchical sROC approach are actually reparameterizations of the same model [4] although the two parameterizations lead naturally to different model summaries (i.e., a confidence region in ROC space and an sROC curve, respectively). Thus, owing to this reparameterization, it is possible to obtain an sROC curve from the bivariate analysis and therefore the discussion relating to sROC curves previously is also pertinent for this model leading to even more possibilities of how diagnostic test data may be used to inform decision models.
957
Synthesis of Diagnostic Test Accuracy for HTA How the application of the different synthesis methods would affect the conclusions in any particular decision problem is difficult to predict because multiple tests may be compared in an economic decision model, and the synthesis estimates of test performance may be deficient in similar ways (i.e., due to the problems highlighted previously). In a previous article [11], the application of the different synthesis methods to a particular decision problem (which incidentally is reference S5 in the current article and included in the review) is explored. Here, the initial HTA assumed independent fixed estimates of sensitivity and specificity but alternative approaches were compared to this. In this example, only relatively small changes in the costeffectiveness acceptability curves were observed and the decision would not change for most willingness to pay thresholds, but the impact may be considerably greater in other contexts; for example, where the accuracy (and costs) of the competing test strategies are more similar than d-dimer and ultrasound are in this example. Six of the models reviewed considered diagnostic pathways using multiple tests in combination. The use of combinations of tests is common in clinical practice, e.g., a cheap or noninvasive test may initially be used which has poor specificity and those diagnosed as diseased may go on to receive a more expensive/ more invasive test with superior test performance. We are concerned that estimation of accuracy of test combinations was dealt with too simplistically in these reviews (i.e., assuming tests to be independent or the second test to be perfect). Crucially, this is perhaps a limitation of the available data as much as the modeling per se as many primary studies estimating test performance only consider a single test so results of tests conditional on the results of other tests are rarely available. We are concerned that if the strong assumption of test independence is violated, this could lead to misleading conclusions. Further work is needed to establish ways of estimating such correlations. Even if they are estimated with considerable uncertainty, including them in the modeling allows the possibility of using value of information methods [15,16] to demonstrate the importance of conducting primary studies to estimate them more accurately. In conclusion, meta-analytic methods for diagnostic test accuracy data have developed rapidly in recent years. Decision modellers need to be aware of the recent developments in this area and appreciate the limitations of simplistic approaches used commonly in the past. Nevertheless, more research is needed to refine and develop synthesis methods in this context for the purpose of decision modelling.
Acknowledgments The authors would like to thank Professor Tracey Roberts, and conference delegates, for their interesting and useful discussion of a previous version of this article presented at the Health Economists’ Study Group meeting in Sheffield, UK July 2009.
Source of financial support: No external funding was received for this research. KRA is partly supported by the UK National Institute for Health Research as a Senior Investigator (NF-SI-0508-10061).
References 1 NICE. Guide to the Methods of Technology Appraisal. London: National Institute for Health and Clinical Excellence, 2008. 2 Leeflang MMG, Deeks JJ, Gatsonis C, et al. On behalf of the Cochrane Diagnostic Test Accuracy Working Group. Systematic reviews of diagnostic test accuracy. Ann Intern Med 2008;149: 889–97. 3 Deeks J. Systematic reviews in health care: systematic reviews in evaluations of diagnostic and screening tests. BMJ 2001;323: 157–62. 4 Harbord RM, Deeks JJ, Egger M, et al. A unification of models for meta-analysis of diagnostic accuracy studies. Biostatistics 2007;8:239–51. 5 Dukic V, Gatsonis C. Meta-analysis of diagnostic test accuracy assessment studies with varying number of thresholds. Biometrics 2003;59:936–46. 6 Deeks JJ, Altman DG. Effect measures for meta-analysis of trials with binary outcomes. In: Egger M, Davey Smith G, Altman DG, eds. Systematic Reviews in Health Care: Meta-Analysis in Context. London: BMJ Publishing Group, 2001. 7 Littenberg B, Moses LE. Estimating diagnostic accuracy from multiple conflicting reports: a new meta-analytic method. Med Decis Making 1993;13:313–21. 8 Rutter CM, Gatsonis CA. A hierarchical regression approach to meta-analysis of diagnostic test accuracy evaluations. Stat Med 2001;20:2865–84. 9 Reitsma JB, Glas AS, Rutjes AWS, et al. Bivariate analysis of sensitivity and specificity produces informative summary measures in diagnostic review. J Clin Epidemiol 2005;58: 982–90. 10 Goodacre S, Sampson FC, Sutton AJ, et al. Variation in the diagnostic performance of d-dimer for suspected deep vein thrombosis: systematic review, meta-analysis and meta-regression. Q J Med 2005;98:513–17. 11 Sutton AJ, Cooper NJ, Goodacre S, et al. Integration of metaanalysis and economic decision modeling for evaluating diagnostic tests. Med Decis Making 2008;28:650–67. 12 Arends LR, Hamza TH, van Houwelingen HC, et al. Bivariate random effects meta-analysis of ROC curves. Med Decis Making 2008;28:621–38. 13 Harbord RM, Whitting P. Metandi: meta-analysis of diagnostic accuracy using hierarchical logistic regression. Stata Journal 2009;9:211–29. 14 Spiegelhalter D, Thomas A, Best N, et al. WinBUGS User Manual: Version 1.4. Cambridge: MRC Biostatistics Unit, 2003. 15 Claxton K. The irrelevance of inference: a decision-making approach to the stochastic evaluation of health care technologies. J Health Econ 1999;18:341–64. 16 Ades AE, Lu G, Claxton K. Expected value of sample information calculations in medical decision modelling. Med Decis Making 2004;24:207–27.