How many interviews are enough? Do qualitative interviews in building energy consumption research produce reliable knowledge? JUST SOLUTIONS CAMBRIDGE WORKING PAPER 2014B Published in The Journal of Building Engineering, 2015 Ray Galvin Department of Architecture, University of Cambridge, 1-5 Scroope Terrace, Cambridge, UK Email:
[email protected] Tel. +44 7758 832 415
Abstract Research in building energy consumption often uses semi-structured interviews to produce qualitative data on consumer beliefs, attitudes, practices and skills. A survey of 54 recent papers in six prominent building and energy journals shows that the samples are typically small, but inferences are often made for interventions in the light of the findings, on the assumption that these are somehow transferable to wider populations. It is often asked ‘how many interviews are enough’ to produce reliable results. Theoretical literature on this theme has avoided a straightforward statistical critique, and justified the practice with appeals to precedent, the special nature of qualitative personal data, and a limited pool of empirical work. This paper reviews this literature and presents a statistical approach, based on binomial logic, to critiquing and supporting the practice of semi-structured interview research in the building and energy field. The approach developed offers a set of straightforward criteria which researchers can use to estimate the reliability of their findings and inferences from the qualitative data produced in semi-structured interviews. Keywords Qualitative data; semi-structured interviews; building and energy consumer research 1. Introduction. It has become common in recent years to gather data on human attitudes and behaviour in building energy research through interviews with building occupants and other relevant actors. Examples of this kind of research are found in the main journals which deal with technical aspects of energy in buildings, including Building and Environment [1-8], Energy and Buildings [9-21], Energy Efficiency[22-33], Energy Policy [34-45], Sustainable Cities and Society [46-49] and Building Research and Information [50-63]. Generally in such projects, interviews are recorded, transcribed, and analysed according to a coding method which identifies key themes or concepts which bear closely on the projects’ research questions. The data so gathered is generally claimed to be ‘qualitative’ rather than ‘quantitative’. It provides information about what sorts of relevant things are happening and how, rather than the number, proportion or magnitude of relevant factors. For example, [11] observed hundreds of buildings in a medium-sized city to estimate the proportions of dwellings where certain occupant behaviours were impeding energy-efficient ventilation. This was quantitative data. The author of the study then interviewed 21 households in the city to find out what sort of practices, attitudes and difficulties occupants claimed were determining their ventilation practices. This was qualitative data. It gave no information about the prevalence of any particular attitude or practice
1
within the city, but offered clues as to what these attitudes and practices were, and how they were situated within other related discourse and practice. A sample of 21 represents a small number of households in a city of 120,000 homes. The question arises: how many interviews are enough? What is the minimum number of interviews required in a study in the field of energy consumption in buildings, to provide reliable information on the qualitative features of human attitude, practice or behaviour that bear on such studies’ research questions? Researchers have to decide how much time and funding to invest in data gathering. Most qualitative interview data is recorded, transcribed and meticulously analysed, often by several researchers to minimise bias. Interview format usually consists of prompts which lead interviewees to speak widely, on and around the topic area, to allow for new ideas and insights which the researcher would not have otherwise thought of. This demands different research skills from the technical, engineering-based skills which building energy researchers are often trained in, yet this technical background knowledge is also an important ingredient in enabling the interviewer to pick up on leads which arise in the interview. The research also has to be credible for a critical, academic audience. Such an audience can rightly ask: were there sufficient interviews to ensure a full coverage of issues; are the issues that arose in such a small sample truly representative of the relevant population; what are the limitations of the methodology and how can these be quantified? This paper investigates this question from a statistical point of view. To the author’s knowledge no such study has yet been offered in any sphere of science in which qualitative interviews are used. Those which address the issue avoid the question of a straightforward, statistical analysis of the validity of small sample, qualitative data and tend instead to rely on precedents from studies conducted in past years. This is interesting because in quantitative statistical analysis, where large samples are generally used, sample size is routinely calculated or, if response numbers cannot be controlled, the limits of the study’s statistical power are calculated. In this field it is accepted that sample size depends on factors such as reference population, kind of analysis, confidence level required, sampling technique etc., as well as the type of survey and how it is conducted. There are clear mathematical rules. These seem to be lacking for small sample qualitative interviews. The paper is structured as follows. Section 2 identifies the main types of information which qualitative studies in energy and buildings seek to produce. Section 3 reviews social science literature which has attempted to address the question as to how many interviews are enough. Section 4 offers a statistical approach to the reliability of small sample qualitative data. Section 5 offers discussion, conclusions and recommendations for research practice and further research. 2. Qualitative studies in building and energy research 2.1 The studies considered in this study In order to ascertain the scope of the types of information which researchers attempt to obtain from interviews in the field of energy consumption in buildings, papers in this field which use interviews were examined in six academic journals in which such papers are frequently published (see list in Section 1). In all but one of these journals an attempt was made to identify all the papers which have used this methodology in this field over the past 10 years. As the sixth journal, Building Research and Information, publishes a greater number of such papers, a random selection of 13 such papers was made. The number 13 is arbitrary but was chosen because this was the highest number of such papers found in any of the other journals. This gave a total of 63 papers.
2
Most of these papers deal with specificities of consumption behaviour and attitudes in buildings and thereby report on interviews with occupants, though some report on interviews with relevant experts in the building industry. It was difficult to draw a clear line between these and policy-focused papers, but as a rule of thumb only papers dealing with consumption and occupant behaviour and/or attitudes were included. This is by no means an exhaustive list, as there are other journals which publish papers on similar issues, hence some approaches may not be represented in this selection. It is noteworthy that the last (63rd) paper to be selected, i.e. [59], used interviews for an aim that had not been found in any other paper. This raises the possibility that not all approaches will be fairly represented in this analysis, as it is conceivable that a novel approach might have appeared in the 100th or 500th paper if the search had been extended. This point is not trivial because it also bears on the question of ‘how many’ items must be examined to get a full (or ‘saturated’) picture of a data field – the issue which forms the substance of this paper. 9 of the 63 papers either did not record their interviews or were unclear about this. Most of these 9 reported a very high number of interviews, mostly by telephone, and appeared to have used ‘interviews’ in order to complete pro forma questionnaires. These were excluded from the remainder of the analysis1. The remaining 54 all used a ‘semi-structured’ approach, in which key starter questions were asked or prompts were given, so that respondents could talk freely around the themes and possibly introduce ideas or claims which had not been anticipated by the interviewer. 2.2 Types of findings in these papers There were three main types of findings researchers were looking for in these papers, defined here as: thematic, statistical and discursive. ‘Thematic’ findings have to do with what is happening. Here the interviews seek to discover what specific behaviours, attitudes, beliefs, practices, skills, situations, or combinations of these, are represented among their interviewees. This can be further divided into two branches: ‘grounded theory’ as defined by [73], in which the researcher is seeking to identify every possible theme or combination of themes which might emerge, and an approach based more directly on the investigators’ research questions, which more precisely define the scope of the things being looked for. The issue of ‘saturation’ emerged repeatedly in these papers. Saturation is defined in this literature as the point at which no new relevant information is forthcoming, even if more people are interviewed. Most of these papers claimed to have reached saturation by using just the number of interviews they conducted, or to have conducted more than were necessary for saturation to occur. From a statistical point of view the outcomes of this type of research can be classified as binary (or binomial), in that each outcome is either found or it is not found. Hence the overriding research question of this paper is: How many interviews are needed, to ensure that all the relevant themes which are present in the relevant population have emerged in the interviews, given that a theme may be present in the population from which interviewees are selected, but not have (yet) emerged in the interviews conducted so far. A more precisely targeted research question therefore arises: If a particular theme is present in proportion R of the population, what is the probability that it will emerge at least once within a given number n of interviews?
1
These are the papers referenced [4, 23, 25, 26, 30, 31, 33, 46, 47] in the bibliography.
3
The corollary of this question is: If a particular theme is present in proportion R of the population, how many interviews are required in order for there to be a 95% probability2 of it emerging within these interviews? The second type of finding sought in these papers is more overtly statistical, namely the proportion of the interviewees who attest to a theme that has emerged (e.g. [9, 18, 57]). At this point these are not strictly qualitative studies (though all those found here claim to be), as they seek to quantify their findings. From a formal statistical point of view, this is still a binomial issue but more complex than that outlined above. The relevant research question is: If a theme is found in proportion p of n interviews, what is the 95% confidence interval for the proportion of the population in which this theme is found? Within these ‘thematic’ and ‘statistical’ findings of these research papers, often comparisons are made between different sub-groups of interviewees. Such comparisons raise further statistical issues, which will be addressed alongside the basic ones outlined above. A further factor is whether the sample of interviewees is a true random sample of the relevant population. By ‘population’ is meant the sum total of all the objects (which may be households, householders, experts, etc.) which are intended to be represented by the selected interviewees. For example, in [37] the population was fuel-poor households in Vienna, Austria and a sample of 50 such households was interviewed. In [36] the population was households in near-zero-energy homes, and a sample of 25 was interviewed after a technical analysis of their dwellings and consumption. If the interviewees are not a random sample, the reliability of the claimed findings becomes weaker. A further research question, then, is: What is the effect on all the above effects, of having a non-random sample? The third main type of finding in qualitative interviews is what is often called ‘discourse analysis’. This is a more complex and subtle research aim, and does not readily admit of statistical analysis. It involves investigating what phrases, maxims, arguments and oneliners are regularly uttered or written, usually by people or groups who have institutional power over others, as a means of persuading social or governing groups to act a certain way. This method is clearly described by Hajer [64, 65] and is used in building energy research, for example in [66], in an attempt to understand some apparently self-defeating features of German regulations on home heating standards. This approach is of a quite different type from the thematic or statistical approaches which are typically represented in building energy consumption studies, so it is not considered in this paper. Nevertheless, popular discourses often do have a role in influencing people’s energy consumption habits, and there is sometimes an overlap with this and the more thematic studies, such as in [11]. It should also be noted that some of the studies considered here combine qualitative interviews with one or more sets of quantitative data. The quantitative aspect may be measurement of parameters such as indoor temperature (e.g. [2]), or a larger quantitative questionnaire survey (e.g. [58]). It might be argued that this reduces the need for rigour in qualitative interviews, as these are merely a deeper investigation of features that are already known by more rigorous means. However, substantive conclusions are drawn from these qualitative studies, often as a way of explaining why the quantitative results turned out the way they did, or of establishing what course of action households take in situations where their dwellings are of such-and-such a thermal quality. In all cases interview results are presented in these papers as reliable 2
The figure 95% is chosen because this is a commonly accepted level of statistical confidence for social science research. In significance testing it corresponds to a p-value of 0.05.
4
within their given frame of reference, except for a small number which admit they are not reliable (e.g.[52]). 2.3 Numbers of interviews in the studies Of the 54 papers included in this study, the average number of interviews was 19.3, and this fell to 13.2 when separated into the population-representing groups which some of the papers divide them into. For example, [53] interviewed 50 households but in 4 groups, each representing its own type of population. Paper [50] interviewed 60 households, but these were in four different countries and grouped accordingly. Paper [51] interviewed 17 but in groups of 10 and 7. Figure 1 gives a breakdown of numbers of studies with numbers of interviews, and Figure 2 shows how this appears when interviewees are separated into their population-representing groups.
16
number of studies
14 12 10 8 6 4 2 61-65
55-60
51-54
46-50
41-45
36-40
31-35
25-30
21-25
16-20
11-15
6-10
1-5
0
number of interviews
Figure 1. Number of studies with number of interviews 30
number of studies
25 20 15 10 5
46-50
41-45
36-40
31-35
25-30
21-25
16-20
11-15
6-10
1-5
0
number of interviews
Figure 2. Number of interviews and number of studies, including groupings of populations
5
In both cases the modal class is 11-15 interviews, with 6-10 being the next most common. The number of studies with these ranges of interview numbers increases when groups are considered as separate samples. It is the exception rather than the rule to find more than 20 interviews, and 8-17 is by far the most common range. The smallest sample of interviewees in the papers considered was 2 (in [19] and in one of the groups in [52]), and the largest 50 [37]. Paper [55] interviewed 60 participants but these were in 4 groups, each of which was effectively a separate selection from a unique population. 3. Past and current discussion of numbers in small interview samples 3.1 The meaning of the question The question ‘how many interviews are enough?’ has been extensively discussed in social science, applied sciences (such as ICT) and health literature (see reviews in [67, 68, 60, 70]). A common theme in these studies, apart from a number in the medical field, is that the qualitative data sought in interviews does not admit of formal statistical analysis because it has to do with meaning and interpretation rather than hard, durable substance. This type of research, says Mason [67: 1] is concerned with meaning and not making generalised hypothesis statements. It is not the temperature of the room that is important, but the meaning the interviewee ascribes to the feeling of warmth or cold. Such meaning may be nuanced in a variety of possible ways and interpreted differently from person to person, since, as Denzin explains, meaningful utterances are directly and indirectly connected to one another as interactional accomplishments within a particular interpretive frame [68: 23]. This is a fair description of what is happening when people are speaking: they are interpreting their world, and other persons’ interpretations of it, by means of their own frameworks of reference, rather than producing measurable data. The type of reality that is produced in a well-communicating interaction between two people in conversation – such as a researcher and her interviewee – is different from that which engineers mould and shape. It is often called ‘constructivist’ rather than ‘positivist’ [68], though there is a middle ‘realist’ position which emphasises that because the notions people construct in their conversations have concrete effects in the physical world, they are ‘real’, even if in a different sense from rocks and radio waves. This theme has been widely and extensively explored in philosophy of science literature (see, e.g. [70, 71, 72]). Its implications for the underlying assumptions held by interview-based researchers are discussed in [69]. There are also more recent approaches which see interviewees’ speech as a reporting of these people’s ‘practices’, a ‘practice’ being a standardised set of actions which is governed by meanings, enabled by skills and know-how, and constrained by the physical environment (examples are found in [11, 39, 43, 50, 55, 58]). Regardless of what researchers understand their interviewees’ utterances to be, interview-based researchers in the energy field (and in many other fields) almost invariably itemise their findings by grouping similar expressions of meaning under headings that seem relevant to their research questions, and treat them as quasisubstantial things. For example, this passage from [56] begins with an account of what (some) interviewees ‘perceive’ (i.e. construe to be the case): Due to its relative visibility, water use and costs are perceived as easier to regulate and manage in tenants’ everyday practices. In terms of energy saving, hot water could be a priority meriting direct attention. [56: 287] Because (some) interviewees attach to water use and costs the notion that these are easier to regulate and manage, the researcher moves quickly to the conclusion that something concrete can be done about this to increase energy savings. The meanings
6
which interviewees construct have real effects in the material world, especially in the field of energy research. Qualitative interviews can be an effective way to identify these meanings. Each such meaning or practice (or cluster or web of meanings or practices) can be seen as a substantive unit of outcome of the qualitative research. The important question is: how many interviews are needed, to ensure that all the relevant meanings, practices, and constructions of reality within the target population are captured by the outcomes of the research? 3.2 Attempts to answer the question The central issue in most of the discussion of this question is how to achieve ‘saturation’. The notion of saturation was brought into the centre of the discussion through Glaser and Strauss’s formulation, in 1967, of the method of ‘grounded theory’ [73]. Achieving saturation means conducting new interviews until the researcher is confident that no new data relevant to the research question is emerging or would emerge if more interviews were conducted. It will be obvious that some difficult logical problems are associated with this, since no-one knows what the next interviewer would have said if he or she were included in the sample. There appear to be three main ways in which the question is addressed in academic literature. These are called here: the ‘wisdom of the elders’; the ‘experience of the researcher’; and the ‘quasi-empirical foundation’. 3.3 The ‘wisdom of the elders’ The ‘wisdom of the elders’ basically means: if a researcher wants to know how many interviews to conduct in a particular field of research, he or she must look to the past and follow the precedents set by others who have conducted similar or comparable research (e.g. [67]). The logic is that, since these people did it that way and it worked, it should work again. The most frequently occurring number of interviews in the energy papers considered in this study is 14, while 20 of the 53 studies use numbers of interviews within 3 either side of that. It might therefore be worth investigating whether the range 11-17 has become something of an elders’ wisdom for research on energy consumption in buildings. Only one of the studies makes an attempt to justify its number of interviews explicitly (i.e. [38]), though almost all studies which use less than 16 interviews offer some justification for the smallness of their numbers. The difficulty with this approach is simply that the elders might be wrong, and since they themselves do not appear to have justified their sample sizes on any firm ground, there is no reason to believe them. Marshall et al. [74] present a list of established qualitative researchers with their recommended minimum number of interviews. These range from 6 to 50, and as few as 3 per case for comparative case studies. 3.4 The ‘experience of the researcher’ The second approach, the ‘experience of the researcher’, suggests the researcher should weigh up all the issues involved in her or his intended project, and settle on a number of interviews in that light. Marshall [75] proposes the researcher develop a framework of relevant variables, which will depend on the researcher’s prior experience of the subject, the available literature on the subject, and the possible characteristics and contribution of each of the chosen interviewees. Francis et al. [76] suggest that: The specific number will depend on the complexity of the research questions and of the interview topic guide, the diversity of the sample and the nature of the analysis (e.g. the number and likely dimensionality of the target constructs). [76: 1234] Baker and Edwards [68] introduce the discussion of ‘how many interviews’, with the words ‘it depends’, and offer a compendium of the opinions of 14 experienced qualitative interview researchers as to what it depends on (one of whom pointedly asks
7
why the number 14 was chosen as a representative sample). The opinions include: whether interview results will be triangulated with other findings; how confident the researcher is that the members of the sample are homogeneous (or heterogeneous, depending on the research aims); how many interviews will be required to impress the research funding board; how likely it is that saturation will be reached with the chosen number; and how far the research funding will stretch. But many of the 14 experts simply refuse to answer the question, saying, effectively, that qualitative research cannot be tied down to numbers. The ‘experience of the researcher’ approach suffers the inherent weakness that there are no firm criteria to set numbers by. There is an overlap between this and the ‘wisdom of the elders’ approach, in that the elders suffer the same problem of lack of definitive experience. The arguments for this or that number seem to rest on sand: do it this way because experienced researchers did it this way; experience researchers know how to do it because they are experienced. All the above studies, however, maintain that the number chosen should be sufficient to ensure saturation. This leads to the third general approach, called here the ‘quasiempirical foundation’. 3.5 The ‘quasi-empirical foundation’ In response to a dearth of rigorous justification for sample sizes in qualitative interview research, Guest et al. [77] set out to develop an evidence-based guideline. They recorded qualitative interviews with 60 women from Nigeria and Ghana on social desirability bias and self-reported sexual behaviour, and used Glaser and Strauss’s [73] grounded theory approach to construct codes representing outputs of content. Finding 109 such codes in the entire sample of 60, they noted that 80 of these (73%) had emerged in the first 6 interviews, 100 (92%) in the first 12, and all 109 within the first 30. They also used a Chronbach’s Alpha [78] to measure the internal consistency of how the codes related to each other within interviews. A Chronabach’s Alpha may range from negative infinity to 1.0, and a score of 0.7 is widely regarded as a good indication of consistency. Their score reached 0.7 after the 12th interview, rising steadily to 0.93 after the 60th. They concluded that most data saturation occurred within 12 interviews. Guest et al.’s study has been used to justify smallness of samples in building energy research (e.g. [38]), but there are problems with this method. Firstly, although no new themes emerged after the 30th interview, this does not imply that 30 is a universal maximum for saturation. It could simply reflect the boundaries of the focus of the study and its topic area. Further, there is a logical problem with assuming that, because all themes have been found after a particular number of interviews, no more themes would be found if the total number were extended. Secondly, an implicit assumption of the study is that the entire population of relevant Nigerian and Ghanaian women is the 60 in its super-sample, with the result that the percentages of themes (‘codes’) found in the first 6, 12, etc. interviews are not percentages of all the themes in the relevant population, but only of those in the supersample. This begs the question as to whether a sample of 60 is big enough to reflect all the relevant themes, and this brings the problem back to its starting point. In fact it can be shown (see method in Section 4) that there is a 4.6% probability that a theme which occurs in 5% of a (large) population will not have emerged in the first 60 interviews, and that there is a 54.7% probability that a theme which occurs in 1% of the population will not have emerged within the first 60. A theme with such a low frequency of occurrence may seem trivial, but in issues to do with social justice (such as sexual abuse or fuel poverty) it is essential to bring the marginal cases to light, as this may be where the
8
most suffering is. In any case, it is important to be able to say what levels of information might have been missed in a research project, and to quantify these if possible. There are, consequently, problems with the application of Guest et al.’s method to other research projects. Francis et al. [76] offered an approach based on this method, and tested it with a study of the beliefs of relatives of people with Paget’s disease of the bone, about the acceptability to these relatives of genetic screening for themselves. The researchers began by specifying a ‘stopping criterion’ of the number of extra interviews that should be conducted, after the first interview occurred in which no new beliefs emerged. They set this at 3 additional interviews (but gave no reason given for 3 rather than another number). They then conducted 14 interviews and found that on the 14th no new beliefs emerged. They then conducted 3 more interviews to confirm that no more new beliefs emerged, and stopped at that point. On the face of it this may seem a reliable strategy. However, a close examination of their results shows that no new beliefs emerged in the 9th ,10th, 11th or 12th interviews either, indicating that saturation would have been deemed to occur after 8 interviews if the researchers had chosen an initial cohort of 9 rather than 14, and the new theme which emerged in the 13th interview would have been missed. Even with an initial cohort of 14 interviews, what would have happened if the stopping criterion were 4 or 5 is unknown. From a purely statistical point of view, there is a 16.7% probability that a belief held by 10% of the relevant population will not have emerged after 17 interviews. Hence it is highly likely that more beliefs would have emerged if interviewing had been extended. A further problem with most of the qualitative interview studies mentioned in this study is that their samples are not random, i.e. they do not represent a true random sample of their target population. Mathematically this makes their reliability much worse than the above statistical observations would indicate. More prosaically, if a particular belief or theme is under-represented in a sample compared to its target population, there is less chance of this belief or theme emerging in a small number of interviews. Conversely, if a belief is over-represented in the sample it may present itself to the researcher as far more significant and overriding than it is in the population. It seems fair to conclude that a consistent weakness of attempts to justify various numbers of interviews is their lack of a sound theoretical statistical underpinning. 4. A statistical analysis of small sampling of qualitative data The research questions addressed in this section are drawn from the observations in Section 2. Research questions (RQs) 1-5 assume the interviewees represent a true random selection of the target population with respect to the interviewer’s research question. RQ6 extends the analysis to samples that are not random: RQ1: How many interviews are needed, to ensure that all the relevant themes which are present in the relevant population have emerged in the interviews, given that a theme may be present in the population from which interviewees are selected, but not have (yet) emerged in the interviews conducted so far. RQ2: If a particular theme is present in proportion R of the population, what is the probability that it will emerge within a given number n of interviews? RQ3: If a particular theme is present in proportion R of the population, how many interviews are required in order for there to be a 95% probability of it emerging within the study? RQ4: If a theme is found in proportion p of n interviews, what are the 95% confident intervals for the proportion of the population in which this theme is found?
9
RQ5: How are all the above probabilities affected if samples of two different populations are compared? RQ6: What is the effect on all the above effects, of having a non-random sample? 4.1 RQ1: How many interviews are enough? All these RQs deal with binary data (i.e. yes/no answers), as any particular theme either emerges in an interview or it does not. Therefore the statistical distribution for evaluating probabilities in these cases is the binomial distribution. If the selection of the sample is truly random, the probability that a theme which is present in proportion R of the population is represented in each interviewee is also R. Hence the probability P that this theme will emerge in n interviews is given by: (
)
( )
As equation (1) forms the bedrock of the argument of this paper, a step-by-step explanation of how it is derived is offered in Appendix 1. As R becomes smaller, (1 – R) approaches 1, so n has to become larger to prevent the term (1 - R)n approaching 1 and thereby prevent P from becoming zero. In other words, the sample would have to be extremely large in order that every theme which is present in the population does emerge in the interviews. Hence the correct answer to the question, ‘how many interviews are enough’ is that no finite number is ever enough. However, things are not as hopeless as this might imply, as the margins of error can be quantified – hence RQs 2-5. 4.2 RQ2: How likely are themes to emerge? Suppose a particular theme is present in proportion R of the relevant population, but prior to the research it is not known that this theme exists (probably the most common situation in interview research). Equation (1) enables us to find the probability that this theme will emerge within a given number n of interviews. For example, if the theme is present in 20% of the population (so R = 0.2) and 12 interviews are conducted, the probability that this theme will emerge in at least one of these interviews is: ( (
) )
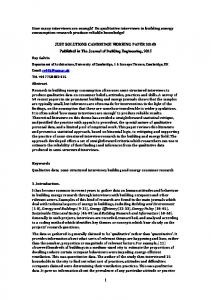
The probability of finding a theme is higher for themes which occur in a higher proportion of the population and lower for themes which occur in a lower proportion of the population. For 12 interviews it reduces to 71.8% for themes present in 10% of the population, 46.0% for themes present in 5%, and 11.4% for themes present in 1% of the population. If the number of interviews is increased, the probability of finding the theme increases. Figure 3 shows probabilities of finding themes which are present in a range of percentages of the population, for different numbers of interviews ranging from 3 to 12. For example, if there are 6 interviews (fourth curve from the bottom), the probability of finding a theme which is present in 10% of the population is 48%.
10
probability of finding issue (%)e
120 12 interviews 11
100 80
10 9
60
8 40
7 6
20
5 100 95 90 85 80 75 70 65 60 55 50 45 40 35 30 25 20 15 10 5 0
0
4
Frequency of issue in population (%)
Figure 3. Probability of finding an issue in small sample qualitative interviews, given its frequency in the population Appendix 2 gives a table of figures for up to 16 interviews. This table could be used as a reference for planning and justifying interview-based research. Alternatively, as the following subsection shows, inversions of equation (1) can be used, depending on whether the researcher is seeking to find the number of interviews required to reach certain levels of confidence, or the coverage of themes that can be expected from a given sample size. 4.3 RQ3. How many interviews are enough to achieve stated aims? Inverting equation (1) to make n the subject gives: ( (
) )
( )
This formula can be used to find the number of interviews required to have a stated level of confidence (P) that all the relevant themes which are held by proportion R of the population will occur within the interview sample (and presumably be found by a skilful interviewer). For example, if the researcher needs to be at least 95% confident that all the issues have emerged which are represented in 10% or more of the population, using equation (2) shows that 29 interviews will be required. Figures 4 illustrate this graphically. The same information is given in Figure 5, with the number of interviews on a logarithmic scale.
11
number of inerviews required
300 250 200 150 100 50 0 0
20
40
60
80
100
percentage of population with belief, practice, theme, etc
Figure 4. Number of interviews required, to be 95% confident that a belief, practice or theme will emerge which is held by various percentages of the population
number of inerviews required
100
10
1 0
0
20
40
60
80
100
percentage of population with belief, practice, theme, etc
Figure 5. Logarithmic scale of number of interviews required, to be 95% confident that a belief, practice or theme will emerge which is held by various percentages of the population Figure 4 indicates that 298 interviews would be required to be 95% confident that all relevant beliefs, etc., held by just 1% of the population would be represented in the sample of interviewees. This number falls rapidly for beliefs held by larger proportions of the population. For example, if the research only needs to identify beliefs held by 20% or more of the population 14 interviews are enough (more precisely 13.4, but as this falls short, a 14th is required). This assumes, of course, that the sample is truly random.
12
Hence a more general answer to RQ3 is: The number of interviews required depends on the minimum proportionate level of occurrence of themes within the population that the researcher wishes to identify, and the level of confidence he or she wishes to have that all such themes are represented in the sample. This, expressed formally in equation (2), is the statistical answer to the decades-old question, ‘how many interviews are enough’. A further inversion of equation (1) can be used to find the minimum proportionate level at which an issue needs to be represented in the population in order for this issue to emerge in interviews: √(
)
( )
For example, to find what minimum proportion of the population would need to hold a belief or attitude in order to be 95% confident that 11 interviews will reveal it, equation (3) would be used, giving an answer of 23.8%. Provided 23.8% of the population hold this belief, 11 interviews will be enough to give a researcher 95% confidence of finding it. 4.4. RQ4. Making quantitative estimates from interview results Some of the building and energy studies examined for this paper go beyond using interviews merely to identify relevant themes, beliefs, practices, etc., and present a quantitative analysis of these themes’ occurrences in their interview sample [e.g. 9, 18, 57]. Gill et al. [57] note that 60% of their 11 interviewees (sic) mentioned the discoloration of water in toilets due to rainwater harvesting (RWH), while 70% thought RWH was a good idea due to its environmental and monetary savings. It is important to ask whether this type of finding conveys any useful information.
95% confidence interval for population
Figure 6 shows the 95% confidence intervals for the proportion of beliefs (or practices, attitudes, etc.) in a population, given the proportion of a random sample of 11 interviewees who express this belief. If the proportion in the sample is 0.6 (=60%), there is a 95% probability that the proportion with this belief in the population lies between 32% and 82%. For a proportion in the sample of 70% these confidence limits are 41% and 89%. Hence the figures of 60% and 70% presented in the study convey little more than that some people commented on the discoloured water and some people approved of it due to its environmental and monetary benefits. Giving percentages from samples this small does not give any useful information and can be misleading to readers not familiar with statistical theory. 1,2 1,0 0,8 0,6
upper lower
0,4 0,2 0,0 0
0,2
0,4
0,6
0,8
proportion found in sample
13
1
Figure 6. 95% confidence intervals for proportion in population, given proportion in sample of 11 (Wilson score interval) More generally, confidence intervals for a binomial distribution with small samples follow quite complex rules, and a reliable way of calculating them (used in the example above) is by means of Wilson’s score interval [79, 80]. This is given by: √
[
(
)
]
( )
where I1 and I2 are the lower and upper confidence limits, p is the proportion of interviewees who express the belief, n is the number of interviewees, and z is the normal distribution’s test statistic for the stated confidence interval (e.g. 1.96 for a 95% twotailed test). The formula also works for large samples, because if n is large the terms with n in the denominator drop out, except for the first term inside the square root sign, with the result that equation (4) becomes identical with the formula for confidence intervals in large binomial samples, namely: √
(
)
( )
95% confidence interval for population
Figure 6 is based on equation (4). As a further illustration of its use, Figure 7 shows the 95% confidence intervals for a very small number of interviews (3) and a comparatively large number (40).
1,2 3 interviews (U)
1,0 0,8
3 interviews (L)
0,6
40 interviews (U) 40 interviews (L)
0,4 0,2 0,0 0
0,2
0,4
0,6
0,8
1
proportion found in sample
Figure 7. 95% confidence intervals for proportion in population, given proportion in samples of 3 and 40 (Wilson score interval) Figure 7 illustrates that with 40 interviews there is still a wide margin of error, averaging around 20-30%, if the proportion of hits in a sample is used to estimate the proportion in the population. With 3 interviews the margin of error is typically around 70%. In short, it is highly questionable whether the proportions of features found in
14
small or even medium sized samples can ever be used to give a picture of how these are in their representative populations3. 4.5 RQ5. Comparing two or more samples of interviewees A number of studies considered in this paper make comparisons between different populations, based on a sample of interviewees for each population [14, 15, 27, 39, 50, 51, 52, 53, 55, 60, 61]. Isaksson and Ellegård [27] interview 12 Swedish households whose dwellings had recently been retrofitted with bedrock heat pumps and 12 whose dwellings had been retrofitted with district heating. They found, inter alia, that ‘investment and annual costs were of great significance, especially for many of the respondents who converted to bedrock heat pumps’ [27: 7]. This is no doubt a fair description of those they interviewed, but does it have any implications for populations of Swedish households who have recently retrofitted to bedrock heat pumps or district heating? Are investment and annual costs of greater significance to the former than the latter? No figures are given to justify the ‘especially’ descriptor, but for illustrative purposes, suppose 70% of the heat pump group expressed this concern while only 30% of the district heating group did so, is there any significant difference between these? There are difficulties in performing a test of significant difference in small binomial samples, but the method of RQ4 can be extended for this. For a sample of 12, a 70% score gives a 95% confidence interval of 42% to 88%, while a score of 30% gives a 95% confidence interval of 12% to 58%. Hence there is an overlap of 42% to 58%, implying that there is nowhere near 95% confidence that the two scores are different (see discussion in [80]). Using equation (4) shows that, for there to be a significant difference the scores in the samples would need to be at least 60% apart. Such a result is of course possible with samples of 12, but if it is to be credible the numbers need to be stated. A claim that such-and-such an attitude is ‘especially’ present in one sample (compared to another sample) is meaningless, without a basic statistical analysis. The same issue arises where researchers use a generous sized sample for their population of interest, and a smaller (often very small) sample for a control. An example is Coleman et al. [52], which explored office workers’ preferences for personalised energy consumption feedback. The main interview sample was 11 employees chosen to reflect the likely spread of energy awareness already in the staff. Their results were compared with a sample of 4 employees who had been given personalised monitors and had a high level of energy awareness. The authors comment: The small sample sizes and above-average energy literacy of some of the participants prevents the findings from being generalized to the broader population. [52: 647]. The authors are correct in this (but why choose such small samples if this was obvious from the beginning?). Figure 8 shows the 95% confidence intervals for samples of 4 and 11. If, for example, 20% of the main sample but 70% of the control sample expressed a particular view, the intervals would be 6% to 50% for the main sample and 27% to 94% for the control sample. The overlap is 23%, indicating that there is a strong possibility that the proportions could be similar or even reversed in their representative populations.
3
Note that confidence intervals rather than p-values are used in this analysis as they give estimates on the same scale as the data, conveying information about both magnitude and precision, whereas pvalues are probabilistic abstractions which need to be further interpreted to show how wide an estimate from a sample can fall when related to its parent population [80, 81].
15
95% confidence interval for population
1,2 1,0
4 interviews (U)
0,8
4 interviews (L)
0,6
11 interviews (U) 11 interviews (L)
0,4 0,2 0,0 0
0,2
0,4
0,6
0,8
1
proportion found in sample
Figure 8. 95% confidence intervals for proportion in population, given proportion in samples of 4 and 11 (Wilson score interval) The short answer research question 5 is, therefore: comparisons based on small sample data are extremely tenuous. The practice of having a small control group is itself questionable, given the wide confidence intervals which ensue. 4.6. RQ6. What if the samples are not random? It is very difficult to obtain a true random sample of a clearly specified population for interview research. Even if sufficient members of the population are known, so that a random selection can be asked to participate, people self-select for reasons that are often unknown to the researcher. If the sample is not random, all the problems of reliability become worse. Confidence levels reduce (RQs 1-3) and confidence intervals expand (RQs 4-5), so that larger samples are needed to restore reliability. Since the degree of non-randomness is usually unknown, it is very difficult to judge how large the sample should consequently be. ( (
) )
( )Although it is often very difficult in practice to ensure true
randomness with small sample interviewee selection, intuitively it would seem reasonable to make extra effort to at least obtain a sample that is representative of the relevant types of people in the target polulation. Many of the studies considered here made special efforts to do this, for example by ensuring that all types of office worker are represented [52] or that all relevant classes of poor household are represented [37]. Study [38] interviewed two local architects and two local citizens’ initiative workers as a way of checking that the characteristics of the homeowners who were interviewed were generally representative of retrofitting households in the geographical area. Nevertheless, the results of such studies would not be as robust as those from a true random sample. It is recommended, therefore, that more research be undertaken as to the degree of certainty that can be inferred from non-random samples of various types. This issue can also arise where written questionnaires are used, if a questionnaire is sent to a large, random selection of individuals but only a small number answer. Because of the self-selection this implies, the small sample received is unlikely to be truly
16
random. If, however, it can be shown that the sample received is random, the same statistical rules would apply here as to deliberately selected small samples. 5. Discussion and conclusions This paper has considered the reliability of building and energy research which uses small samples of recorded interviews to identify themes, beliefs, practices or other phenomena which bear on given research questions. Since these research questions usually take the issues beyond just the samples into the relevant populations, the question arises: how many interviews are enough to deliver what the research is attempting to achieve? This paper has argued that current attempts to answer this question are inadequate. The best of these ground their justifications in one empirical study which claimed to show that ‘saturation’ was largely achieved after 12 interviews and definitely after 30. This study has severe limitations as a model for other research, partly because of its specific research questions and population, and partly because of problematic logic. Other attempts to answer the question rest on precedent rather than rationality, or on researchers’ skills and knowledge, which seems to lack a firm theoretical foundation. This paper has sought to answer the question using a straightforward statistical framework. Since any particular belief, etc. either emerges in an interview or does not, the binomial distribution is the appropriate frame of analysis. The assumption throughout this paper is that researchers seek beliefs, etc., in their samples of interviewees, on the spoken or unspoken assumption that these beliefs, etc. are in some way representative of those in the relevant population. The paper used 54 published studies as its raw material to ascertain what sort of things this type of research is doing. Six research questions emerged through examination of these studies and of wider academic literature on the number of interviews required for ‘saturation’. For 5 of these (RQs 1-5) it was possible to give a simple answer, in each case represented by one or more equations. The final RQ, on non-random samples, did not so readily admit of a straightforward answer. It is suggested that more research be carried out to explore the dimensions of certainty and uncertainty arising from such samples. Probably the most useful equation derived here is (2) which gives the number of interviews required to fulfil clearly stated criteria, namely the minimum degree to which a belief, etc. must be represented in a population to be relevant to the research; and the level of statistical confidence the researcher wishes to have that all such beliefs, etc. are present in the sample. It has also been important to show the tenuous nature of the subtle shift from qualitative to quantitative results in some of these studies, where figures are given for the percentage or proportion of the interviewees who expressed some particular belief, etc. Findings of this kind could be taken to imply that people in general in this situation are like this, i.e. that it is reflected in the target population. This produces misleading results, and it is recommended that qualitative research of this kind remain strictly qualitative and not try to quantify proportions of specific types of responses. A further tenuous practice is that of making comparisons between small samples, where meaningful comparisons cannot be made because confidence intervals overlap so widely. The above comment also applies to this, but here it tends to cause double the trouble, since margins of error can become multiplicative. Although this study focused on building and energy research, it has implications for other fields, such as health, IT, psychology, transport and social participation – fields from which the literature review on theoretical issues was drawn. Many studies in these
17
fields also seek to identify beliefs, practices, attitudes, reported skills, etc. among their interviewees, and use this information to make implications about their target populations. It must also be emphasised that the findings of this study do not apply to research which is undertaking discourse analysis. Here, interviews are used alongside textual analysis to explore how people use verbal means to exercise power over others within particular cultures, institutions or governing bodies [64, 65, 70, 82, 83]. The findings only apply to qualitative research which uses interview data to make inferences which are claimed or implied to apply more widely to members of the target population. (7694 words) References [1] Davies P, Osmani M. Low carbon housing refurbishment challenges and incentives: Architects’ perspectives. Building and Environment 46 (2011) 1691-1698. [2] Isakssona C, Karlsson F. Indoor climate in low-energy houses—an interdisciplinary investigation. Building and Environment 41 (2006) 1678–1690. [3] Kyrö R, Heinonen J, Junnila S. Housing managers key to reducing the greenhouse gas emissions of multi-family housing companies? A mixed method approach. Building and Environment 56 (2012) 203-210. [4] Meerbeek B, te Kulve M, Gritti T, Aarts M, van Loenen E, Aarts E. Building automation and perceived control: A field study on motorized exterior blinds in Dutch offices. Building and Environment 79 (2014) 66-77. [5] Meier A, Aragon C, Peffer T, Perry D, Pritoni M. Usability of residential thermostats: Preliminary investigations. Building and Environment 46 (2011) 1891-1898. [6] Miller W, Buys L, Bell J. Performance evaluation of eight contemporary passive solar homes in subtropical Australia. Building and Environment 56 (2012) 57-68. [7] Osmani M, O’Reilly A. Feasibility of zero carbon homes in England by 2016: A house builder’s perspective. Building and Environment 44 (2009) 1917–1924. [8] Pelenur M, Cruickshank H. Investigating the link between well-being and energy use; an explorative case study between passive and active domestic energy management systems. Building and Environment 65 (2013) 26-34. [9] Chiang T, Natarajan S, Walker I. A laboratory test of the efficacy of energy display interface design. Energy and Buildings 55 (2012) 471–480. [10] Coleman M, Brown N, Wright A, Firth S. Information, communication and entertainment appliance use—Insights from a UK household study. Energy and Buildings 54 (2012) 61–72. [11] Galvin R. Impediments to energy-efficient ventilation of German dwellings: A case study in Aachen. Energy and Buildings 56 (2013) 32–40. [12] Gram-Hanssen K, Christensen T, Petersen P. Air-to-air heat pumps in real-life use: Are potential savings achieved or are they transformed into increased comfort? Energy and Buildings 53 (2012) 64–73. [13] Jovanovíc A, Pejíc P, Djoríc-Veljkovíc S, Karamarkovíc J, Djelíc M. Importance of building orientation in determining daylighting qualityin student dorm rooms: Physical and simulated daylightingparameters’ values compared to subjective survey results. Energy and Buildings 77 (2014) 158–170. [14] Kanters J, Horvat M, Dubois M-C. Tools and methods used by architects for solar design. Energy and Buildings 68 (2014) 721–731.
18
[15] Santamouris M, Alevizos S, Aslanoglou L, Mantzios D, Milonas P, Sarelli I, Karatasou S, Cartalis K, Paravantisca J. Freezing the poor—Indoor environmental quality in low and very low income households during the winter period in Athens. Energy and Buildings 70 (2014) 61–70. [16] Karjalainen S. Consumer preferences for feedback on household electricity consumption. Energy and Buildings 43 (2011) 458–467. [17] Karjalainen S. Should it be automatic or manual—The occupant’s perspective on the design of domestic control systems. Energy and Buildings 65 (2013) 119–126. [18] Menzies G, Wherrett J. Windows in the workplace: examining issues of environmental sustainability and occupant comfort in the selection of multi-glazed windows. Energy and Buildings 37 (2005) 623–630. [19] Ridley I, Bere J, Clark A, Schwartz Y, Farrd A. The side by side in use monitored performance of two passive and low carbon Welsh houses. Energy and Buildings 82 (2014) 13–26. [20] Risholt B, Time B, Hestnes A. Sustainability assessment of nearly zero energy renovation of dwellings based on energy, economy and home quality indicators. Energy and Buildings 60 (2013) 217–224. [21] Sookchaiy T, Monyakul V, Thep S. Assessment of the thermal environment effects on human comfort and health for the development of novel air conditioning system in tropical regions. Energy and Buildings 42 (2010) 1692–1702. [22] Bladh M. Energy efficient lighting meets real home life. Energy Efficiency (2011) 4:235–245. [23] Caird S, Roy R, Herring H. Improving the energy performance of UK households: Results from surveys of consumer adoption and use of low- and zero-carbon technologies. Energy Efficiency (2008) 1:149–166. [24] Cohen J, Pearlmutter D, Schwartz M. Lifestyle and energy consumption: a comparison of four collective communities in transition. Energy Efficiency (2010) 3:19–31. [25] Czakó V. Evolution of Hungarian residential energy efficiency support programmes: road to and operation under the Green Investment Scheme. Energy Efficiency (2012) 5:163–178. [26] Garabuau-Moussaoui I. Energy-related logics of action throughout the ages in France: historical milestones, stages of life and intergenerational transmissions. Energy Efficiency (2011) 4:493–509. [27] Isaksson C, Ellegård K. Anchoring energy efficiency information in households’ everyday projects: peoples’ understanding of renewable heating systems. Energy Efficiency (in press) DOI 10.1007/s12053-014-9299-x. [28] Lappegard Hauge A, Thomsen J, Löfström E. How to get residents/owners in housing cooperatives to agree on sustainable renovation. Energy Efficiency (2013) 6:315–328. [29] Rosenow J. The politics of the German CO2-Building Rehabilitation Programme. Energy Efficiency (2013) 6:219–238. [30] Soroye K, Nilsson L. Building a business to close the efficiency gap: the Swedish ESCO Experience. Energy Efficiency (2010) 3:237–256. [31] Togeby M, Dyhr-Mikkelsen K, Larsen A, Bach P. A Danish case: portfolio evaluation and its impact on energy efficiency policy. Energy Efficiency (2012) 5:37–49. [32] Broberg Viklund S. Energy efficiency through industrial excess heat recovery—policy impacts. Energy Efficiency (in press) DOI 10.1007/s12053-014-9277-3. [33] Vine R. Prahl R, Meyers S, Turiel I. An approach for evaluating the market effects of energy efficiency programs. Energy Efficiency (2010) 3:257–266. [34] Ástmarsson B, Jensen P, Maslesa E. Sustainable renovation of residential buildings and the landlord/tenant dilemma. Energy Policy63(2013)355–362. [35] Balta-Ozkan N, Davidson R, Bicket M, Whitmarsh L. Social barriers to the adoption of smart homes. Energy Policy63(2013)363–374.
19
[36] Berry S, Whaley D, Davidson K, Saman W. Near zero energy homes – What do users think? Energy Policy 73(2014)127–137. [37] Brunner K-M, Spitzer M, Christanell A. Experiencing fuel poverty. Coping strategies of lowincome households in Vienna/Austria. Energy Policy 49 (2012) 53–59. [38] Galvin R, Sunikka-Blank M. The UK homeowner-retrofitter as an innovator in a sociotechnical system. Energy Policy 74 (2014) 655-662. http://dx.doi.org/10.1016/j.enpol.2014.08.013i [39] Gram-Hanssen K, Bartiaux F, Jensen ), Cantaert M. Do homeowners use energy labels? A comparison between Denmark and Belgium. Energy Policy 35 (2007) 2879–2888. [40] Killip G. Products, practices and processes: exploring the innovation potential for lowcarbon housing refurbishment among small and medium-sized enterprises (SMEs) in the UK construction industry. Energy Policy 62 (2013) 522–530. [41] Pellegrini-Masini G, Leishman C. The role of corporate reputation and employees’ values in the uptake of energy efficiency in office buildings. Energy Policy 39 (2011) 5409–5419. [42] Pilkington B, Roach R, Perkins J. Relative benefits of technology and occupant behaviour in moving towards a more energy efficient, sustainable housing paradigm. Energy Policy 39 (2011) 4962–4970. [43] Røpke I, Haunstrup-Christensen T, Jensen J. Information and communication technologies – A new round of household electrification. Energy Policy 38 (2010) 1764–1773. [44] Xu n P, Chan E, Qian Q. Success factors of energy performance contracting (EPC) for sustainable building energy efficiency retrofit (BEER) of hotel buildings in China. Energy Policy 39 (2011) 7389–7398. [45] Zhang X, Shen L, Chan S. The diffusion of solar energy use in HK: What are the barriers? Energy Policy 41 (2012) 241–249. [46] El Asmara J-P, Takiba A. Sustainable rehabilitation of the built environment in Lebanon. Sustainable Cities and Society 10 (2014) 22–38. [47] Frank ), Omer S, Riffat S, Mempouo B. The indispensability of good operation & maintenance (O&M)manuals in the operation and maintenance of low carbon buildings. Sustainable Cities and Society (in press, 2014), http://dx.doi.org/10.1016/j.scs.2014.06.002 [48] O’Sullivan K, Viggers H, Howden-Chapman P. The influence of electricity prepayment meter use on household energy behaviour. Sustainable Cities and Society 13 (2014) 182–191. [49] Papargyropoulou E, Padfield R, Harrison O, Preece C. The rise of sustainability services for the built environment in Malaysia. Sustainable Cities and Society 5 (2012) 44–51. [50] Bartiaux F, Gram-Hanssen K, Fonseca P, Ozolin L, Haunstrup-Christensen T. A practicetheory approach to homeowners’ energy retrofits in four European areas. BUILDING RESEARCH & INFORMATION 2014 Vol. 42, No. 4, 525–538. [51] Chiu L, Lowe R, Raslan R, Altamirano-Medina H, Wingfield J. A socio-technical approach to post-occupancy evaluation: interactive adaptability in domestic retrofit. BUILDING RESEARCH & INFORMATION 2014 Vol. 42, No. 5, 574–590. [52] Coleman M, Irvine K, Lemon M, Shao L. Promoting behaviour change through personalized energy feedback in offices. BUILDING RESEARCH & INFORMATION, 2013 Vol. 41, No. 6, 637– 651. [53] Crosbie T, Baker K. Energy-efficiency interventions in housing: learning from the inhabitants. BUILDING RESEARCH & INFORMATION (2010) 38(1), 70–79. [54] Devine-Wright P, Wrapson W, Henshaw Vm Guy S. Low carbon heating and older adults: comfort, cosiness and glow. BUILDING RESEARCH & INFORMATION 2014 Vol. 42, No. 3, 288– 299. [55] Foulds C, Powell J, Seyfang G. Investigating the performance of everyday domestic practices using building monitoring. BUILDING RESEARCH & INFORMATION, 2013 Vol. 41, No. 6, 622–636.
20
[56] Glad W. Housing renovation and energy systems: the need for social learning. BUILDING RESEARCH & INFORMATION (2012) 40(3), 274–289. [57] Gill Z, Tierney M, Pegg O, Allan N. Low-energy dwellings: the contribution of behaviours to actual performance. BUILDING RESEARCH & INFORMATION (2010) 38(5), 491–508. [58] Gram-Hanssen K. Residential heat comfort practices: understanding users. BUILDING RESEARCH & INFORMATION (2010) 38(2), 175–186. [59] Haines V, Mitchell V. A persona-based approach to domestic energy retrofit. BUILDING RESEARCH & INFORMATION 2014 Vol. 42, No. 4, 462–476. [60] Hendrickson D, Wittman H. Post-occupancy assessment: building design, governance and household consumption. BUILDING RESEARCH & INFORMATION (2010) 38(5), 481–490. [61] Horne R, Maller C, Dalton T. Lowcarbon, water-e⁄cient house retrofits: an emergent niche? BUILDING RESEARCH & INFORMATION 2014 Vol. 42, No. 4, 539–548. [62] Morgenstern P, Lowe R, Chiu L. Heat metering: socio-technical challenges in district-heated social housing. BUILDING RESEARCH & INFORMATION 2014 (in press) http://dx.doi.org/10.1080/09613218.2014.932639 [63] Strengers Y. Comfort expectations: the impact of demand-management strategies in Australia. BUILDING RESEARCH & INFORMATION (2008) 36(4), 381–391. [64] Hajer M. The Politics of Environmental Discourse: Ecological Modernisation and the Policy Process, Oxford: Clarendon 1995. [65] Hajer, M. ‘Coalitions, Practices, and Meaning in Environmental Politics: From Acid Rain to BSE,’ in David Howarth and Jacob Torfing (eds), Discourse Theory in European Politics: Identity, Policy and Governance, London: Palgrave Macmillan 2005, pp. 297-315. [66] Galvin R (2012) German Federal policy on thermal renovation of existing homes: A policy evaluation. Sustainable Cities and Society 4 (2012) 58– 66. [67] Mason M. Sample Size and Saturation in PhD Studies Using Qualitative Interviews. Forum: Qualitative Social Research 11: 3 (2010) 1-19. [68] Baker S, Edwards R (eds). How many qualitative interviews is enough? Expert voices and early career reflections on sampling and cases in qualitative research. National Centre for Research Methods Review Paper (2010). Economic and Social Research Council. [69] Crouch M, McKenzie H. The logic of small samples in interview-based qualitative research. Social Science Information. 45 (2006) 483-499. [70] Harré R. Social being. Oxford: Blackwell (1993). [71] Bhaskar R. A realist theory of science (second edition). London: Verso (1978 [1975]). [72] Wittgenstein L. Philosophical investigations (translated by G.E.M. Anscombe), Oxford: Blackwell (1967 [1953]). [73] Glaser B, Strauss A. The discovery of grounded theory: Strategies for qualitative research. New York: Aldine Publishing Company (1967). [74] Marshall B, Cardon P, Poddar A, Fontenot R. Does sample size matter in qualitative research?: A review of qualitative interviews in research. Journal of Computer Information Systems. Fall (2013) 11-22. [75] Marshall M. Sampling for qualitative research. Family Practice 13:6 (1966) 522-525 [76] Francis J, Johnston M, Robertson C, Glidewell L, Entwistle V, Eccles M, Grimshaw J. What is an adequate sample size? Operationalising data saturation for theory-based interview studies. Psychology and Health 25:10 (2010) 1229–1245. [77] Guest G, Bunce A, Johnson L. How many interviews are enough? An experiment with data saturation and variability. Field Methods, 18 (2006) 59-82. [78] Streiner D, Norman G. Health Measurement Scales: A Practical Guide to Their Development and Use. New York: Oxford University Press (1989) pp. 64-65.
21
[79] Wilson E. The Foundations of Mathematics. Bulletin of the American Mathematical Society 11:2 (1904) 74–93. [80] Newcombe R. Two-sided confidence intervals for the single proportion: comparison of seven methods. Statistics in Medicine 17 (1998) 857-872. [81] Gardner M, Altman D (eds). Statistics with Confidence. Confidence Intervals and Statistical Guidelines, British Medical Journal: London (1989). [82] Laclau E. Discourse, in Robert E. Goodin and Philip Pettit (eds) The Blackwell Companion to Contemporary Political Philosophy, Oxford: Blackwell (1993) pp. 431-437. [83] Torfing J. ‘Discourse Theory: Achievements, Arguments, and Challenges,’ in David Howarth and Jacob Torfing (eds) Discourse Theory in European Politics: Identity, Policy, Governance, Basingstoke: Palgrav (2005), pp 1-32.
22
Appendix 1. Derivation of equation (1) Consider a belief such as ‘leaving the heating on continually consumes less energy than turning it off overnight and on again in the morning’, and suppose this belief is held by proportion R of a population. If a member of this population is selected at random, the probability that he or she will have this belief is R. Now suppose a number n of such people are selected at random. For each of them, the probability that he or she has this belief will also be R. If these n people are interviewed one by one in such a way that this belief, if person has it, will emerge, the probability of it emerging in the first interview is R, and the probability of it not emerging in this interview is 1 – R. Suppose it does not emerge, and the second person is interviewed. The probability that it does not emerge in this second interview is also 1 – R. Therefore the probability that it will not have emerged after these first two interviews is: (
)
(
)
The probability that it does not emerge on the third interview is also (1 – R). Therefore the probability of it not emerging after three interviews is: (
)
(
)
(
)
Hence the probability of it not emerging after n interviews is: (
)
The probability that it does emerge in one or more interviews is therefore: This can be written: ( This is equation (1) in the text of the paper.
23
)
Appendix 2. Probability of theme being present in a given sample of interviewees, given the percentage of the target population in whom the theme exists, assuming the sample is a true random sample of the population. number of interviews
3
4
5
6
7
8
9
10
11
12
13
14
15
16
100
100.00
100.00
100.00
100.00
100.00
100.00
100.00
100.00
100.00
100.00
100.00
100.00
100.00
100.00
95
99.99
100.00
100.00
100.00
100.00
100.00
100.00
100.00
100.00
100.00
100.00
100.00
100.00
100.00
90
99.90
99.99
100.00
100.00
100.00
100.00
100.00
100.00
100.00
100.00
100.00
100.00
100.00
100.00
85
99.66
99.95
99.99
100.00
100.00
100.00
100.00
100.00
100.00
100.00
100.00
100.00
100.00
100.00
80
99.20
99.84
99.97
99.99
100.00
100.00
100.00
100.00
100.00
100.00
100.00
100.00
100.00
100.00
75
98.44
99.61
99.90
99.98
99.99
100.00
100.00
100.00
100.00
100.00
100.00
100.00
100.00
100.00
70
97.30
99.19
99.76
99.93
99.98
99.99
100.00
100.00
100.00
100.00
100.00
100.00
100.00
100.00
65
95.71
98.50
99.47
99.82
99.94
99.98
99.99
100.00
100.00
100.00
100.00
100.00
100.00
100.00
60
93.60
97.44
98.98
99.59
99.84
99.93
99.97
99.99
100.00
100.00
100.00
100.00
100.00
100.00
55
90.89
95.90
98.15
99.17
99.63
99.83
99.92
99.97
99.98
99.99
100.00
100.00
100.00
100.00
50
87.50
93.75
96.88
98.44
99.22
99.61
99.80
99.90
99.95
99.98
99.99
99.99
100.00
100.00
45
83.36
90.85
94.97
97.23
98.48
99.16
99.54
99.75
99.86
99.92
99.96
99.98
99.99
99.99
40
78.40
87.04
92.22
95.33
97.20
98.32
98.99
99.40
99.64
99.78
99.87
99.92
99.95
99.97
35
72.54
82.15
88.40
92.46
95.10
96.81
97.93
98.65
99.12
99.43
99.63
99.76
99.84
99.90
30
65.70
75.99
83.19
88.24
91.76
94.24
95.96
97.18
98.02
98.62
99.03
99.32
99.53
99.67
25
57.81
68.36
76.27
82.20
86.65
89.99
92.49
94.37
95.78
96.83
97.62
98.22
98.66
99.00
20
48.80
59.04
67.23
73.79
79.03
83.22
86.58
89.26
91.41
93.13
94.50
95.60
96.48
97.19
15
38.59
47.80
55.63
62.29
67.94
72.75
76.84
80.31
83.27
85.78
87.91
89.72
91.26
92.57
10
27.10
34.39
40.95
46.86
52.17
56.95
61.26
65.13
68.62
71.76
74.58
77.12
79.41
81.47
5
14.26
18.55
22.62
26.49
30.17
33.66
36.98
40.13
43.12
45.96
48.67
51.23
53.67
55.99
0
0.00
0.00
0.00
0.00
0.00
0.00
0.00
0.00
0.00
0.00
0.00
0.00
0.00
0.00
percentage in population (%)
24