HOW MUCH DOES THE EXISTING REGULATORY PATCHWORK REDUCE U.S. GREENHOUSE GAS EMISSIONS? By Justin Gundlach November 2015
© 2015 Sabin Center for Climate Change Law, Columbia Law School The Sabin Center for Climate Change Law develops legal techniques to fight climate change, trains law students and lawyers in their use, and provides the legal profession and the public with up-to-date resources on key topics in climate law and regulation. It works closely with the scientists at Columbia University's Earth Institute and with a wide range of governmental, nongovernmental and academic organizations. Sabin Center for Climate Change Law Columbia Law School 435 West 116th Street New York, NY 10027 Tel: +1 (212) 854-3287 Email:
[email protected] Web: http://www.ColumbiaClimateLaw.com Twitter: @ColumbiaClimate Blog: http://blogs.law.columbia.edu/climatechange Disclaimer: This paper is the responsibility of The Sabin Center for Climate Change Law alone, and does not reflect the views of Columbia Law School or Columbia University. This paper is an academic study provided for informational purposes only and does not constitute legal advice. Transmission of the information is not intended to create, and the receipt does not constitute, an attorney-client relationship between sender and receiver. No party should act or rely on any information contained in this White Paper without first seeking the advice of an attorney. About the author: Justin Gundlach is the 2015–2017 Climate Law Fellow at the Sabin Center. He can be reached at
[email protected]. Acknowledgments: Many thanks to Arijit Sen and Nicolas Cerkez for valuable research assistance, to Michael Carim for an early discussion of sources and approaches, and to Michael Gerrard for helpful questions and comments on an early draft.
How Much Does the Existing Regulatory Patchwork Reduce U.S. Greenhouse Gas Emissions?
EXECUTIVE SUMMARY This paper offers an answer to the question, “What levels of greenhouse gas (“GHG”) emissions reduction do the constituent programs in the U.S.’s existing regulatory patchwork achieve?” Its answer represents an attempt to measure the same effect from eight regulatory interventions: EPA’s Prevention of Significant Deterioration program, as it is expected to operate following the Supreme Court’s UARG v. EPA decision in 2014; EPA’s Clean Power Plan; EPA’s renewable fuel standard; the federal Corporate Average Fuel Economy standards for light, medium, and heavy duty vehicles; the renewable electricity generation Production Tax Credit and Investment Tax Credit; the Regional Greenhouse Gas Initiative, which encompasses 9 states in the mid-Atlantic and Northeast; California’s Global Warming Solutions Act of 2006, Assembly Bill 32; and state renewable portfolio standards. Notably, though it seeks to measure the same effect of diverse policies, this paper does not purport to measure the aggregated net effects of those policies on GHG emissions. Most important among its conclusions are the following. First, federal CAFE standards, the Clean Power Plan, and state renewable portfolio standards will be crucial for achieving emissions reduction goals. Second, the reductions available from the renewable fuel standard are uncertain and highly contentious. And third—an important subtext—the effectiveness (and costeffectiveness) of this patchwork of programs is unwieldy even to measure, much less to ensure.
Sabin Center for Climate Change Law | Columbia Law School
i
How Much Does the Existing Regulatory Patchwork Reduce U.S. Greenhouse Gas Emissions?
CONTENTS 1. Introduction ................................................................................................................................... 1 1.1
Prevention of Significant Deterioration (“PSD”) program .......................................................... 4
1.2
Clean Power Plan (“CPP”) ............................................................................................................... 6
1.3
Renewable Fuel Standard (“RFS”) .................................................................................................. 9
1.4
CAFE Standards............................................................................................................................... 13
1.5
Tax Credits........................................................................................................................................ 16
1.6
Regional Greenhouse Gas Initiative (“RGGI”) ............................................................................ 19
1.7
California’s AB 32 ............................................................................................................................ 22
1.8
State Renewable Portfolio Standards (“RPSs”) ........................................................................... 26
2. Conclusion ................................................................................................................................... 29
Sabin Center for Climate Change Law | Columbia Law School
ii
How Much Does the Existing Regulatory Patchwork Reduce U.S. Greenhouse Gas Emissions?
1. INTRODUCTION This paper offers an answer to the question, “What levels of greenhouse gas (“GHG”) emissions 1 reduction do the constituent programs in the U.S.’s existing regulatory patchwork achieve?” Its answer represents an attempt to measure the same effect from a diverse set of regulatory schemes that operate differently from one another and interact in ways that are difficult to measure. Its answer is thus laden with caveats,2 but is nonetheless valuable because it offers a basis for comparison with policy alternatives. Notably, though the U.S. Energy Information Administration (“EIA”)’s list of data outputs has included estimated GHG emissions from various sectors since 1993,3 those outputs draw on a National Energy Modeling System that does not isolate the effects of particular policies.4 The eight regulatory interventions considered here are: EPA’s Prevention of Significant Deterioration (“PSD”) program, as it is expected to operate following the Supreme Court’s UARG v. EPA decision in 2014; EPA’s Clean Power Plan (the “CPP”); EPA’s renewable fuel standard; the federal Corporate Average Fuel Economy (“CAFE”) standard for light duty vehicles; the renewable electricity generation Production Tax Credit (“PTC”) and Investment Tax Credit (“ITC”); the Regional Greenhouse Gas Initiative (“RGGI”), which encompasses 9 states in the midAtlantic and Northeast; California’s Global Warming Solutions Act of 2006, Assembly Bill 32 (“AB
The six gases counted toward CO2e are carbon dioxide (CO2), methane (CH4), nitrous oxide (N2O), hydrofluorocarbons (HFCs), perfluorocarbons (PFCs), and sulphur hexafluoride (SF 6). The Intergovernmental Panel on Climate Change updated its specification of their “global warming potentials” or GWPs in the Second, Fourth, and Fifth Assessment Reports. This paper discusses volumes of these gases in terms of their GWP relative to CO 2, written as “CO2e”. 1
Perhaps the most important caveat is that its estimates do not identify how the various interventions overlap, even though they certainly do—for instance, EPA’s Clean Power Plan assumes the reductions achieved by the Regional Greenhouse Gas Initiative and California’s cap and trade scheme. Thus, were this paper to add its estimates together, it would be guilty of some amount of double-counting. Cf. WORLD RESOURCES INSTITUTE, GREENHOUSE GAS PROTOCOL, POLICY AND ACTION STANDARD 13 (Nov. 2014), http://bit.ly/1KU3kaf (“Results should also not be aggregated across policies if the methodologies, assumptions, and data sources are not comparable or if the baseline scenarios developed for each policy were not developed to enable accurate aggregation”). 2
3
See Energy Policy Act of 1992, Pub. L. No. 102-486, 106 Stat. 2777 § 1605(b) (1992).
See EIA, ANNUAL ENERGY OUTLOOK 2015, at 200–224 (2015) (Appendix A: Handling of federal and selected state legislation and regulations in the AEO); see also Michael Wara, Instrument Choice, Carbon Emissions, and Information, 4 MICH. J. ENVTL. & ADMIN. L. 261 (2015) (identifying general inaccuracy and consistent upward bias in NEMS GHG emissions projections since mid-1990s). 4
Sabin Center for Climate Change Law | Columbia Law School
1
How Much Does the Existing Regulatory Patchwork Reduce U.S. Greenhouse Gas Emissions?
32”); and state renewable portfolio standards (“RPSs”). Table 1, below, summarizes this paper’s conclusions. Table 1. Summary of Conclusions
Regulatory intervention
(i)
(ii)
(iii)
Resulting Annual Reduction of US GHG Emissions… (Mt CO2e)
…as of Year
Degree of Certainty Regarding Estimate in (i)
>0
2020
High
74
2020
Med-High
375
2030
Medium
100 > RFS > 0
2022
Low
68
2020
Medium
497
2035
Low-Med
1.
PSD
2.
CPP
3.
RFS
4.
CAFE
5.
Tax Credits
16
2015
Medium
6.
RGGI
5
2015
Med-High
7.
AB 32
78
2020
High
291
2030
Med-High
8.
RPSs
225
2010
Medium
Before discussing particular policies, however, it is useful to set this paper before the backdrop of the Intended Nationally Determined Contribution (“INDC”) that the Obama Administration recently submitted to the United Nations, which commits to reducing GHG emissions to 17% below 2005 levels by 2020, and to 26–28% below 2005 levels by 20255—meaning that U.S. sources will aim to emit no more than 4,980 million metric tons (“Mt”) of CO 2e in 2020 and no more than 4,440–4,560 in 2030. This in turn means achieving reductions of about 520 Mt CO2e in 2020 and 955–1075 in 2030.
5
UNITED STATES, INTENDED NATIONALLY DETERMINED CONTRIBUTION (Mar. 2015), http://bit.ly/1xTpzr1.
Sabin Center for Climate Change Law | Columbia Law School
2
How Much Does the Existing Regulatory Patchwork Reduce U.S. Greenhouse Gas Emissions?
Notably, the Obama Administration’s 2014 Climate Action Report connects the INDC’s numeric target to the policies it references by quantifying the effects of several of those policies much in the way this paper seeks to do.6 However, the Climate Action Report does not explain its methodology for arriving at its list of estimates, except to say that “[m]itigation levels and projections are estimated using a range of methodologies and assumptions.” 7 Thus, this paper cannot account for the differences between its estimated annual emissions reductions as of 2020 for, say, CAFE standards or the RFS, which the Climate Action Report counts as 273.7 Mt CO2e and 138.4 Mt CO2e respectively. 8 In any case, there seems to be broad agreement on a key point between the estimates in Table 1, the Climate Action Report, and also the Center for Climate and Energy Solutions’ rough tally of reductions: federal CAFE standards and the CPP (which draws heavily upon state RPSs) will be crucial for achieving the INDC.9 These comparisons also highlight the contentious nature of contributions expected from the RFS, and the potential for disparity among projections of GHG reduction efforts in general. Turning to how this paper derived its estimates: the numbers offered in Table 1 derive from answers to the following constituent questions for each regulatory intervention: Does it reduce GHG emissions? By how much? And how certain are we about that amount? Each intervention is described and its GHG emissions impact considered in turn below.
U.S. DEPARTMENT OF STATE, 2014 CLIMATE ACTION REPORT 119–126 (2014), http://bit.ly/1LELyFf (“[This report] outlines how U.S. action on climate change puts the United States on a path to reach the ambitious but achievable goal of reducing U.S. greenhouse gas emissions in the range of 17 percent below 2005 levels by 2020.”). The 2014 Report also serves as the First Biennial Report of the U.S. and the Sixth National Communication of the U.S. under the United Nations Framework Convention on Climate Change. 6
7
Id. at 118.
8
Id. at 119.
That tally anticipates 10.1% of the 26–28% total will come from the CPP, a further 4.7–8.2% from new regulations of methane, hydrofluorocarbons, and vehicle emissions, and the remaining 3.3–6.1% from an assortment of further measures in the industrial and agricultural sectors. Center for Climate and Energy Solutions, Achieving the United States’ Intended Nationally Determined Contribution 2 (June 2015), citing KARL HAUSKER, WORLD RESOURCES INSTITUTE, DELIVERING ON THE U.S. CLIMATE COMMITMENT: A 10-POINT PLAN TOWARD A LOW-CARBON FUTURE (May 2015), http://bit.ly/1jRWs1u, and DOUG BOUCHER, UNION OF CONCERNED SCIENTISTS, HALFWAY THERE? WHAT THE LAND SECTOR CAN CONTRIBUTE TO CLOSING THE EMISSIONS GAP (Jan. 2015), http://bit.ly/20aIGHN. 9
Sabin Center for Climate Change Law | Columbia Law School
3
How Much Does the Existing Regulatory Patchwork Reduce U.S. Greenhouse Gas Emissions?
1.1 Prevention of Significant Deterioration (“PSD”) program The 1977 Amendments to the Clean Air Act of 1970 imposed a check—the PSD program— on building or modifying “major stationary” emitting facilities in locations where the facility would significantly increase emissions and thereby reduce air quality.10 That program requires emitters of pollution to integrate the best available pollution control technology (“BACT”) into their new or modified facility’s design and operation. Compliance means receipt of a permit and authorization to pollute, albeit to a lesser degree than would occur without whatever BACT was employed. When EPA concluded in 2009 that 1) GHG emissions endanger human health and welfare,11 and 2) motor vehicle emissions of GHGs cause or contribute to that endangerment,12 it started the wheels of the Clean Air Act turning toward GHG emissions regulation. That is, these Findings required EPA to regulate GHG emissions pursuant to the Act’s various components, including the PSD program. In response, EPA issued the Timing and Tailoring Rules.13 The first set out the process by which EPA would implement the Act’s various requirements, and the second sought to avoid the “absurd results” of simply regulating GHG emissions in exactly the same way as criteria pollutants like sulfur dioxide.14 More specifically, the Tailoring Rule set out Steps by which the PSD program would be brought to bear on GHG emitters. It called Step 1 sources “anyway” sources because their emission of GHGs in excess of the Rule’s thresholds would not require them to seek PSD permits—they had to do so anyway because they emitted criteria pollutants in excess of statutory thresholds. Step 2 sources would be new to the PSD program, however, because they did not emit criteria pollutants in excess of the statutory thresholds of 100 or 250 tons per year
10
Clean Air Act Amendments of 1977, Pub. L. No. 95-95, 91 Stat. 685 (1977).
Endangerment and Cause or Contribute Findings for Greenhouse Gases Under Section 202(a) of the Clean Air Act, 74 Fed. Reg. 66496 (Dec. 15, 2009). 11
12
Id.
13
Prevention of Significant Deterioration and Title V Greenhouse Gas Tailoring Rule, 75 Fed. Reg. 31514 (June 3, 2010).
See Coalition for Responsible Regulation v. EPA, 684 F.3d 102, 118–19 n.173 (D.C. Cir. 2012) (“under the ‘absurd results’ doctrine, EPA concluded that the PSD and Title V programs ‘should not [immediately] be read to apply to all [greenhouse gas] sources at or above the 100/250 tpy threshold.’ Tailoring Rule, 75 Fed. Reg. at 31,554.”) (brackets in original). 14
Sabin Center for Climate Change Law | Columbia Law School
4
How Much Does the Existing Regulatory Patchwork Reduce U.S. Greenhouse Gas Emissions?
(“tpy”), but they did emit GHGs in excess of the 100,000 tpy threshold set by EPA’s rule. Step 3 would widen the PSD program’s scope further still. The Rules were litigated up to the Supreme Court, which rejected 5-4 EPA’s basis for imposing Steps beyond Step 1, but also upheld by a vote of 7-2 EPA’s Rule as it applied to Step 1 or “anyway” sources.15 EPA is now responding to the Court’s ruling,16 as interpreted by the D.C. Circuit,17 and is expected to issue a revised Rule that limits the PSD program’s scope to “anyway” GHG-emitters. Will PSD reduce emissions? It is difficult to see how EPA’s application of the PSD program to GHG emissions could fail to reduce those emissions’ volume. But that does not mean it is easy to count how much of a reduction to expect. How much? The difficulty of saying how much GHG emissions reduction to expect from the PSD program owes chiefly to two points. First, EPA does not issue blanket decisions about the BACT for particular facilities, but rather works with facility owners to identify BACT suitable to the specific aspects of their region’s and facility’s profile. Thus, one cannot usefully estimate in advance of BACT determinations and implementations what emissions reductions will follow from a given “anyway” facility’s adoption of GHG BACT.18 Second, because implementation of the GHG part of the PSD program is still nascent, empirical data on the results of employing GHGoriented BACT are not yet available. How certain are we? Although we are quite certain that applying PSD to GHG emissions will reduce those emissions, we are not very certain of how much they will do so. As already noted, there is little empirical information, and, owing to the nature of BACT and PSD program operation, no predictions about emissions reductions can be made with confidence in the absence
15
See Utility Air Regulatory Group v. EPA, 134 S. Ct. 2427 (2014).
See Prevention of Significant Deterioration Permitting for Greenhouse Gases: Providing Option for Rescission of EPAIssued Tailoring Rule Step 2 Prevention of Significant Deterioration Permits, 80 Fed. Reg. 26210 (May 7, 2015). 16
17
Coalition for Responsible Regulation, Inc. v. EPA, 606 Fed. App’x 6 (D.C. Cir. 2015).
This helps explain why EPA only published estimates of the volume of GHGs that would be subject to regulation under the Tailoring Rule—not the reduction of GHGs expected to result from that regulation. See 75 Fed. Reg. 31514; EPA, REGULATORY IMPACT ANALYSIS FOR THE FINAL PREVENTION OF SIGNIFICANT DETERIORATION AND TITLE V GREENHOUSE GAS TAILORING RULE (May 2010), http://bit.ly/1Mbi453. 18
Sabin Center for Climate Change Law | Columbia Law School
5
How Much Does the Existing Regulatory Patchwork Reduce U.S. Greenhouse Gas Emissions?
of empirical information. Furthermore, EPA has studiously avoided publishing any such prediction.
1.2 Clean Power Plan (“CPP”) EPA has devised the Clean Power Plan for Existing Power Plants to regulate a sector that accounts for roughly 31% of U.S. GHG emissions and about 6% of anthropogenic emissions worldwide. 19 EPA estimates that the CPP will directly affect roughly 3,100 facilities, called electricity generating units or EGUs.20 EPA published a final version of the CPP on August 3, 2015, and that version was published in the Federal Register on October 23, 2015.21 As with most Clear Air Act regulation of stationary sources, the CPP looks to states to carry out its requirements through State Plans,22 to which a Federal Plan will provide a backstop.23 States are to submit draft State Plans for approval by September 2016,24 and the CPP requires those State Plans’ components to be phased in from 2022 to 2030.25 That is, it makes 2030 the deadline for achieving “final goals,” and 2022–2029 the period for achieving “interim goals.”26 The timing and authorship of plans for implementing the CPP mean that this paper can only look to predictions of the Plan’s effects on GHG emissions—and must recognize those predictions’ limited ability to
EPA, Sources of Greenhouse Gas Emissions, http://1.usa.gov/1P9UZNr (last visited Oct. 19, 2015); EPA, Global Greenhouse Gas Emissions Data, http://1.usa.gov/1MyKAbe (last visited Oct. 19, 2015) 19
EPA, FACT SHEET: CLEAN POWER PLAN BY THE NUMBERS, http://1.usa.gov/1jCcADR (last visited Oct. 19, 2015); Carbon Pollution Emission Guidelines for Existing Stationary Sources: Electric Utility Generating Units; Final rule, at 64715–16 (Oct. 23, 2015) [hereinafter “CPP”], http://1.usa.gov/1UTmCxK (“an affected EGU is any fossil fuel-fired electric utility steam generating unit … or stationary combustion turbine that was in operation or had commenced construction as of January 8, 2014, and that … serve[s] a generator capable of selling greater than 25 MW to a utility power distribution system and have a base load rating greater than 260 GJ/h (250 MMBtu/h) heat input of fossil fuel (either alone or in combination with any other fuel).”). 20
Carbon Pollution Emission Guidelines for Existing Stationary Sources: Electric Utility Generating Units, 80 Fed. Reg. 64662 (Oct. 23, 2015). 21
22
Id. at 64826–28.
Id. at 64855 (“For states that do not submit a state plan, the CAA gives the EPA express authority to implement a federal plan for sources in that state upon determination by the EPA that a state has failed to submit a state plan by the required date.”). 23
24
Id.
25
Id. at 64864.
26
Id.
Sabin Center for Climate Change Law | Columbia Law School
6
How Much Does the Existing Regulatory Patchwork Reduce U.S. Greenhouse Gas Emissions?
anticipate actual outcomes, not least because it is possible that the courts, Congress, or a new President could derail some or all of the Plan.27 Two further points of background are important to note before describing the GHG emissions reductions to expect as a result of the CPP’s implementation. First, the Plan allows states to comply by causing their EGUs to achieve either a “national emissions performance rate” of GHGs per unit electricity (CO2e per megawatt-hour), a state-specific performance rate (aligned with national rates, but calibrated to a given state’s particular circumstances), or a state-specific mass-based limit on annual CO2e. 28 The last of these is particularly amenable to interstate allowance trading scheme, an approach that many stakeholders agree would achieve emission reductions more cost-effectively.29 Second, the Plan sets out several “building blocks” or means a state must use to achieve compliance with the rate or limit it adopts. The first of these is improving the thermal efficiency of steam generators (used in coal and some gas-fired power plants) and of natural gas-fired combined cycle (“NGCC”) turbines. The second building block is switching from coal-fired sources to less GHG-intensive natural gas sources. The third is switching to non-GHG-emitting sources like wind and solar.30 In addition, though it is not a “building block,” in the final version of the Plan states can also count investments in verified energy efficiency measures toward their emissions compliance goals.31
See Anthony Adragna & Andrew Childers, Clean Power Plan Implications Unclear After Supreme Court Denies Agency Deference, BLOOMBERG BNA NEWS, June 30, 2015, http://bit.ly/1g6OcZg (“‘All of us are trying hard to crystal ball this,’ Jody Freeman, director of the Environmental Law Program at Harvard University told Bloomberg BNA June 29.”). 27
28
80 Fed. Reg. at 64663–64.
MELINDA TAYLOR & ROMANY WEBB, EPA'S CLEAN POWER PLAN: IMPLEMENTATION OPTIONS SURVEY RESULTS 6 (June 2015), http://bit.ly/1LpZpiw (“The bulk of survey respondents supported interstate cooperation on the Clean Power Plan, with 90 percent arguing that states should develop multi-state plans or single-state plans that preserve the option to trade across state lines.”); see also John Upton, Could the Clean Power Plan create a massive cap-and-trade system?, CLIMATE CENTRAL, Aug. 7, 2015, http://bit.ly/1NWtgmu. 29
EPA, REGULATORY IMPACT ANALYSIS RIA”]. 30
FOR THE
CLEAN POWER PLAN FINAL RULE, at ES-2 (Aug. 2015) [hereinafter “CPP
EE had been included Building Block Four in EPA’s draft Plan, but was demoted to a mere means of compliance in the final rule. Compare CPP at 64667 (“the agency has determined that the BSER comprises the first three of the four proposed ‘building blocks’”), with Carbon Pollution Emission Guidelines for Existing Stationary Sources: Electric Utility Generating Units, 79 Fed. Reg. 34830, 34858 (June 18, 2014). 31
Sabin Center for Climate Change Law | Columbia Law School
7
How Much Does the Existing Regulatory Patchwork Reduce U.S. Greenhouse Gas Emissions?
Will the CPP reduce GHG emissions? Yes. The only questions are whether it will survive judicial and political attacks and, if it does, how close actual performance will be to the emissions reduction targets set by EPA and the states. How much? As shown in Table 2, EPA anticipates that the CPP will push annual emissions from U.S. EGUs down relative to baseline projections by 3–4% by 2020, 10–12% by 2025, and 18– 19% by 2030. Table 2. EPA estimates of expected emissions by target years32
Year
Baseline
2020 2025 2030
1,955 1,964 2,020
Under CPP Rate-Based Mass-Based 1,891 1,881 1,754 1,725 1,644 1,646
As the electricity sector emitted approximately 2434 Mt CO2e in 2005, achieving these projections would mean reducing 2020 emissions by 22–23%, 2025 emissions by 28–29%, and 2030 emissions by 32% relative to 2005 levels.33 The EPA’s August 2015 estimates are largely confirmed by the U.S. Energy Information Administration (“EIA”), which estimated in a May 2015 report that the CPP would result in emissions of 1,814 Mt CO2e in 2020 and 1,596 in 2030.34 Notably, that estimate was based on the parameters set forth in a draft version of the Clean Power Plan, which EPA thereafter revised in several material respects.35 EIA’s report also included 16 alternative scenarios in which one or more salient input variables were adjusted. Viewed altogether, those scenarios yield the following ranges of plausible outcomes: 1684–1886 Mt CO2e in 2020, and 1553–1727 Mt CO2e in 2030.36 How certain are we? Fairly certain, assuming the CPP survives judicial and political attacks, though the numbers above are necessarily projections rather than retrospective estimates. EPA and CPP RIA, supra note 31, at 3-19 tbl. 3-5. EPA published estimates in short tons; the author has converted them to metric tons. 32
33
Id. at 3-20, tbl. 3-6.
34
EIA, ANALYSIS OF THE IMPACTS OF THE CLEAN POWER PLAN 23, 27–28 (May 22, 2015), http://bit.ly/1kwaNkf.
The most notable of these were: overall reduction of 32% instead of 30% from 2005 emissions levels; delay of initial compliance deadline from 2020 to 2022; less demanding thermal efficiency requirements for building block one sources; exclusion of new or existing nuclear sources from building block three, and an expectation of greater use of new renewable sources in building block three; elimination of building block four. See CPP at 64736–44. 35
36
EIA, ANALYSIS OF THE IMPACTS OF THE CLEAN POWER PLAN 93 (May 22, 2015), http://1.usa.gov/1AoZ8dH.
Sabin Center for Climate Change Law | Columbia Law School
8
How Much Does the Existing Regulatory Patchwork Reduce U.S. Greenhouse Gas Emissions?
EIA arrived at notably similar estimates using different models. EIA’s 16 alternative scenarios also identify multiple important sensitivities and specify their importance to the model, thereby providing a form of reassurance that nothing crucial to an accurate estimate has been assumed away. Furthermore, the Union of Concerned Scientists’ June 2015 examination of states’ progress toward 2020 CPP benchmarks provides reassurance that EPA’s Plan is not unrealistically ambitious.37 Specifically, that examination found that, owing to the retirement of coal plants and construction of gas, nuclear, and renewable generation sources undertaken or scheduled since 2012, 31 states are more than halfway toward meeting their 2020 benchmarks, and that 14 are on track to surpass them.38
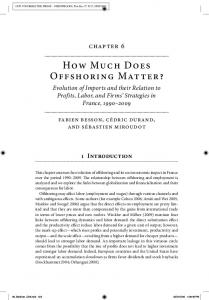
1.3 Renewable Fuel Standard (“RFS”) The Energy Policy Act of 2005 and the Energy Independence and Security Act of 2007 established mandates—eventually termed RFS1 and RFS2—for blending fuel derived from plantbased sources in with the gasoline and diesel fuels used in the transportation sector.39 Whereas RFS1 permitted corn-starch ethanol to fulfill its mandate RFS2 imposed more complex and stringent requirements on qualifying fuels. EISA and RFS2 create four nested categories of renewable fuels (see Figure 1 at right). To qualify as any form of renewable fuel, a feedstock’s lifecycle emissions intensity must be at least 20% lower than conventional gasoline. As shown in Figure 1, advanced biofuels, whether made from sorghum,
See JEREMY RICHARDSON ET AL., UNION OF CONCERNED SCIENTISTS, STATES OF PROGRESS: EXISTING COMMITMENTS TO CLEAN ENERGY PUT MOST STATES ON TRACK TO MEET CLEAN POWER PLAN’S 2020 BENCHMARKS 14 (June 2015), http://bit.ly/1M3Sf0q (“even states that are suing EPA are making progress toward their 2020 benchmarks”). 37
38
Id. at 12–13.
Energy Policy Act of 2005, Pub. L. No. 109-58 (2005); Energy Independence and Security Act of 2007, Pub. L. No. 110140 (2007). Specifically, transportation fuel distribution companies are obliged to purchase specified volumes of renewable fuels to be blended with the conventional fuels sold to end-users. 39
Sabin Center for Climate Change Law | Columbia Law School
9
How Much Does the Existing Regulatory Patchwork Reduce U.S. Greenhouse Gas Emissions?
wheat, sugarcane, cellulose, lignin, or corn stover (i.e., cobs, stalks, and husks), must have a GHG lifecycle emissions profile that is at least 50% lower than that of gasoline.40 EISA also provides mandates and limits on the volume of renewable fuels to be produced for transportation uses. It puts a 15 billion gallon (“bgal”) cap on the volume of saleable corn-starch ethanol, which has a lifecycle GHG emissions profile that arguably meets the 20% threshold of a renewable fuel but never the 50% threshold of an advanced biofuel.41 That cap became effective in 2015. EISA’s mandates for advanced biofuels, including biodiesel from biomass, grow from about 1.5 bgals in 2010 to 21 bgals in 2022.42 Although there is already capacity to produce up to the cap on corn-starch ethanol, EPA said in a June 2015 notice of proposed rulemaking that “[w]e have evaluated the capabilities of the market and have determined that the volumes for advanced biofuel and total renewable fuel specified in the statute cannot be achieved in 2014–2016.”43 On this basis, EPA plans to use the
As California’s Air Resources Board has explained, the difference between ethanols for the purpose of a lifecycle emissions analysis is in how they came to be ethanol. CAL. AIR RESOURCES BD., STAFF REPORT: INITIAL STATEMENT OF REASONS FOR PROPOSED RULEMAKING--PROPOSED RE-ADOPTION OF THE LOW CARBON FUEL STANDARD, at III-62 (Jan 2015), http://bit.ly/1PHvupb (“a gallon of ethanol made from corn grown and processed in the Midwest will, under a microscope or other analytical device, look identical in every material way to a gallon of ethanol processed from sugar cane grown in Brazil. Both samples of ethanol will have the same boiling point, the same molecular composition, the same lower and upper limits of flammability—in other words, both will have identical physical and chemical properties because both products consist of 100 percent ethanol. On the other hand, the corn ethanol made from the Midwest will have different carbon intensity than the sugar cane ethanol from Brazil. Thus, the relevant inquiry with carbon intensity is not so much what is contained in a fuel, but how that fuel was made, distributed and used.”). 40
EISA also grandfathers in corn-starch ethanol that falls short of the 20% threshold if the facilities that produce it commenced production before 2010. Any expansion of production at those facilities must meet the threshold, however. RANDY SCHNEPF & BRENT D. YACOBUCCI, CONG. RES. SERV., RENEWABLE FUEL STANDARD: OVERVIEW AND ISSUES (Mar. 2013), http://bit.ly/1LMspSR. 41
Id. at 5. Another important change that RFS2 made to RFS1 was in the calculation of lifecycle GHG emissions. RFS1 required EPA to consider “indirect land use changes” or ILUC when assigning lifecycle emissions values to a particular source of ethanol, meaning that EPA would value not only the emissions released during production, distribution, and combustion, but also the counterfactual scenario in which land had not been used to grow whatever crop was processed into ethanol. RFS2 responded to arguments from industry and environmental NGOs about the accuracy of this approach by adjusting the lifecycle analysis in a way that did not exclude any fuels from the categories for which their producers sought to qualify them. See BRENT D. YACOBUCCI & KELSI BRACMORT, CONG. RES. SERV., CALCULATION OF LIFECYCLE GREENHOUSE GAS EMISSIONS FOR THE RENEWABLE FUEL STANDARD 10–16 (Mar. 2010), http://bit.ly/1MEQkQH. 42
Proposed Renewable Fuel Standards 2014, 2015 and 2016, and the Biomass-Based Diesel Volume for 2017, 80 Fed. Reg. 33100, 33109 (June 10, 2015). The National Research Council predicted this result in 2011. LESTER B. LAVE ET AL., NAT’L RESEARCH COUNCIL, RENEWABLE FUEL STANDARD: POTENTIAL ECONOMIC AND ENVIRONMENTAL EFFECTS OF U.S. BIOFUEL POLICY 2 (2011). 43
Sabin Center for Climate Change Law | Columbia Law School
10
How Much Does the Existing Regulatory Patchwork Reduce U.S. Greenhouse Gas Emissions?
waiver authorities provided in EISA to depart from the statute’s aspirational numeric requirements.44 Does the RFS reduce GHG emissions? This question has been the subject of intense debate—a debate that has gone on for a decade but remains unresolved.45 In 2011, the National Research Council observed that while EPA had found that various ethanols, including corn-starch, have GHG emissions profiles of lower intensity than gasoline, credible alternative lifecycle analyses had found that “corn-grain ethanol might not have lower [GHG emissions] values than petroleumbased gasoline,” and might even be more emissions-intensive.46 The literature review of one recent report—itself criticized by the ethanol trade association Growth Energy as slanted against cornstarch ethanol in part because it was funded by the American Council for Capital Formation 47— noted that researchers’ published estimates of corn-starch ethanol’s emissions intensity have ranged from 93% higher to 36% lower than the emissions intensity of gasoline.48 That report also listed the key points of contention in the debate over measuring the emissions intensity of fuels that seeks to qualify for RFS2’s various thresholds. Those include whether or not and how to measure:
Land use conversion—the growth of crops for ethanol on land not previously used for agricultural purposes;
Indirect land use conversion—the growth of crops for ethanol on land previously used for a different agricultural purpose;
The emissions profile of ethanol refineries’ energy sources (most studies assume it will be natural gas);
44
The efficiency of refineries’ energy use;
Id. at 33100.
See Amanda Reilly, Biofuels: Climate change fuels arguments on both sides in ethanol war, ENERGY & ENV’T, Oct. 20, 2015, http://bit.ly/1RX1K6Q (“Whether the RFS -- and the expanded ethanol production that comes from it -- is an effective policy for addressing climate change remains an active area of debate among academics.”); YACOBUCCI & BRACMORT, supra note 43, at 10–16. 45
LAVE ET AL., supra note 44, at 199 (citing Regulation of Fuels and Fuel Additives: Changes to Renewable Fuel Standard Program, 75 Fed. Reg. 14670 (Mar. 26, 2010)). 46
Amanda Reilly, Biofuels: Study questions RFS's environmental and economic benefits, ENERGY & ENV'T, Oct. 15, 2015 (“‘Clearly, this study was published with an agenda and without regard to the facts,’ said Tom Buis, co-chairman of ethanol trade group Growth Energy. ‘It is misleading, inaccurate and runs counter to a large body of expert research.’”). 47
DANIEL DE LA TORRE UGARTE & BURTON ENGLISH, 10-YEAR REVIEW OF THE RENEWABLE FUELS STANDARD: IMPACTS TO THE ENVIRONMENT, THE ECONOMY, AND ADVANCED BIOFUELS DEVELOPMENT 23 (Oct. 2015), http://bit.ly/1hEF91H. 48
Sabin Center for Climate Change Law | Columbia Law School
11
How Much Does the Existing Regulatory Patchwork Reduce U.S. Greenhouse Gas Emissions?
Process technologies used by refineries; and
Refineries’ locations.49
Additional contentious factors include whether to compare lifecycle emissions of biofuels to non-lifecycle emissions of gasoline and the use of “attributional” as versus “consequential” lifecycle analysis when measuring emissions intensity. 50 Notably, EPA’s emissions profiling of biofuels from other sources, such as switchgrass, has not escaped similar criticism.51 Even as debate on all these points has raged, EPA continues to employ the analysis it developed in 2010 to assess lifecycle GHG emissions.52 How much? EPA estimates that full implementation of RFS2 (which EPA recognizes is unlikely to occur) would by 2022 reduce annual GHG emissions by 136.1–140.3 Mt CO2e, 53 a reduction of 2.5–2.6% in aggregate emissions from national energy use.54 EIA has not developed an alternative estimate. But, as the Congressional Budget Office has observed, if one adopts less generous estimates of renewable fuels’ GHG emissions intensity than those employed by EPA, “total U.S. emissions of greenhouse gases in 2017 would probably be only slightly lower.”55 And that conclusion relies on the unrealistic assumption that advanced biofuels production had kept up with RFS2’s targets. How certain are we? If anything, we are fairly certain that actual results will fall short— maybe far short—of what EPA has estimated for full RFS2 implementation. In addition to the fact
49
Id. at 22.
See, e.g., Bruce E. Dale & Segundo Kim, Letter to the Editor: Can the Predictions of Consequential Life Cycle Assessment Be Tested in the Real World? Comment on “Using Attributional Life Cycle Assessment to Estimate Climate-Change Mitigation...”, 18 J. INDUST. ECOL. 466–67 (2014). 50
RICHARD PLEVIN & GOURI SHANKAR MISHRA, UC DAVIS, ESTIMATES OF THE LAND-USE-CHANGE CARBON INTENSITY OF GCAM 4.0 MODEL (Sept. 22, 2015), http://bit.ly/1ScJ2aJ (agreeing with federal lifecycle emissions estimate for corn stover but finding that swtichgrass does not meet EPA 60% lifecycle emissions reduction threshold for “advanced biofuel”). 51
ETHANOL FROM SWITCHGRASS AND CORN STOVER USING THE
See DOE, Alternative Fuels Data Center: U.S. Life Cycle Greenhouse Gas Emissions of Biofuels, http://1.usa.gov/1LPgMuC (last visited Oct. 22, 2015; last updated Feb. 2010) (citing EPA RFS2 RIA (Feb. 2010)). 52
EPA, RENEWABLE FUEL STANDARD PROGRAM (RFS2) REGULATORY IMPACT ANALYSIS 497 (Feb. 2010). Notably, this estimate takes into account an initial increase in GHG emissions from land use changes undertaken to produce ethanol feedstock. Id. at 494–96. 53
That estimate is based on EIA’s projected baseline for GHG emissions in 2022, which 5,498.99 Mt CO2e. See. EIA, MONTHLY ENERGY REVIEW, DOE/EIA-0035, fig.36 (Nov. 2014). 54
55
CONGRESSIONAL BUDGET OFFICE, THE RENEWABLE FUEL STANDARD: ISSUES FOR 2014 AND BEYOND 20–21 (June 2014).
Sabin Center for Climate Change Law | Columbia Law School
12
How Much Does the Existing Regulatory Patchwork Reduce U.S. Greenhouse Gas Emissions?
that advanced biofuel production is growing slower than planned, the debate over how to measure biofuels’ GHG emissions intensity undermines the validity of EPA’s estimate. Indeed, EPA’s Inspector General, responding to concerns raised by critics of the lifecycle analysis in EPA’s RFS2 Regulatory Impact Assessment, recently announced that it would examine EPA’s analytical approach.56 Furthermore, even if RFS2 had set achievable goals and no controversy surrounded EPA’s analysis of renewable fuels’ emissions intensity, any such estimate, like estimates related to GHG-limiting CAFE standards (discussed below), would still be particularly sensitive to unpredictable exogenous factors, such as population, car ownership, and economic activity to name a few.
1.4 CAFE Standards Since 2012, car makers have had to comply with federal limits on motor vehicle emissions in the U.S. by not only ensuring that their fleets consume fuel, on average, at or below prescribed rates (measured in miles per gallon or “mpg”), but also that they emit GHGs below specified grams per mile (“gCO2/mi”) thresholds.57 This change followed EPA’s 2009 Endangerment and Cause or Contribute Findings, and President Obama’s directive to EPA and the National Highway Transportation Safety Administration (“NHTSA”) to develop an integrated National Program to improve fuel economy and reduce greenhouse gas emissions from motor vehicles. 58 EPA and NHTSA’s response harmonized national policy with California’s 2004 decision to impose GHG
Memorandum from Patrick Gilbride, Director, EPA Office of Program Evaluation to Janet McCabe, Acting Assistant Administrator Office of Air and Radiation, re Project Notification: Lifecycle Impacts of Renewable Fuel Standard (Oct. 15, 2015), http://1.usa.gov/1Kdt7TZ. 56
See Light-Duty Vehicle Greenhouse Gas Emission Standards and Corporate Average Fuel Economy Standards, 75 Fed. Reg. 25324, 25327 (May 7, 2010). (“The carbon content of the test fuel is [] used to calculate the amount of fuel that had to be consumed per mile in order to produce that amount of CO2. [T]hat fuel consumption figure is converted into a milesper-gallon figure. CAFE standards [] do not address the 5–8 percent of GHG emissions that are not CO2, i.e., nitrous oxide (N2O), and methane (CH4) as well as emissions of CO2 and hydrofluorocarbons (HFCs) related to operation of the air conditioning system.”). 57
2017 and Later Model Year Light-Duty Vehicle Greenhouse Gas Emissions and Corporate Average Fuel Economy Standards, 77 Fed. Reg. 62624 (Oct. 15, 2012) (citing D.C. Circuit decision upholding Endangerment Finding and National Fuel Efficiency Policy announcement). This integrated several sources of regulatory authority into one program: EPA’s regulation of emissions from mobile sources under Section 202(a) of the Clean Air Act, 42 U.S.C. § 7521(a), its regulation of fuel economy under the Energy Policy and Conservation Act (EPCA), 49 U.S.C. § 32904(c), and NHTSA’s regulation of fuel economy under EPCA as amended by the Energy Independence and Security Act of 2007, id. § 32902. 58
Sabin Center for Climate Change Law | Columbia Law School
13
How Much Does the Existing Regulatory Patchwork Reduce U.S. Greenhouse Gas Emissions?
emissions standards on motor vehicles.59 EPA and NHTSA have to date issued three final rules and one proposed rule to govern the fuel economy and GHG emissions intensity of motor vehicle fleets sold in the U.S. The first addressed passenger vehicles and light-duty vehicles (“LDVs”) for model years (“MYs”) 2012 through 2016; 60 the second addressed medium- and heavy-duty vehicles (“HDVs”) for MYs 2014 through 2018;61 the third tightened LDV standards for MYs 2017 through 2025;62 and the last, still a proposed rule, would tighten HDV standards for MYs 2018 through 2027.63 While CAFE standards have always been elaborate, the standards that limit GHGs as well as mpg are exceedingly complex, taking into account not only fuel efficiency and emissions ratings for particular vehicles, but recognizing the role that electric vehicles—which potentially implicate emissions from electricity generators—play in balancing average ratings across vehicle fleets.64 Have CAFE standards reduced GHG emissions? Yes, the imposition of CO2e emissions limits has reduced the volume of GHGs that would otherwise have been emitted from American vehicle fleets. How much? EPA and NHTSA estimate that CAFE standards for model years of LDVs, and HDVs from 2012 through 2025 will result in cumulative emissions reductions of approximately 7 billion metric tons (“BMT”) of CO2e over those vehicles’ useful lifetimes. 65 EPA and NHTSA
59
See 75 Fed. Reg. at 25327–28.
60
See id. at 25324 (May 7, 2010).
See Greenhouse Gas Emissions Standards and Fuel Efficiency Standards for Medium- and Heavy-Duty Engines and Vehicles, 76 Fed. Reg. 57106 (Sept. 15, 2011). 61
62
See 77 Fed. Reg. 62624 (Oct. 15, 2012).
Greenhouse Gas Emissions and Fuel Efficiency Standards for Medium- and Heavy-Duty Engines and Vehicles—Phase 2, 80 Fed. Reg. 40138 (July 13, 2015). 63
See EPA & NHTSA, REGULATORY IMPACT ANALYSIS FOR FINAL RULEMAKING TO ESTABLISH GREENHOUSE GAS EMISSIONS STANDARDS AND FUEL EFFICIENCY STANDARDS FOR MEDIUM- AND HEAVY-DUTY ENGINES AND VEHICLES REGULATORY IMPACT ANALYSIS (Aug. 2011); EPA, DRAFT REGULATORY IMPACT ANALYSIS OF PROPOSED RULEMAKING FOR GREENHOUSE GAS EMISSIONS AND FUEL EFFICIENCY STANDARDS FOR MEDIUM- AND HEAVY-DUTY ENGINES AND VEHICLES—PHASE 2 (June 2015) [hereinafter “HDV PHASE 2 RIA”]. 64
80 Fed. Reg. 40138, 40138. What is the average “lifetime” of a car? EPA’s Regulatory Impact Statement for its 2012 rule assumes the following “survival fractions” for a passenger vehicle of a given MY: 75% after 12 years, 50% after 16 years, 25% after 19 years, and less than 5% after 26 years. For light trucks, those percentages fall at 10, 16, 22, and 36 years. HDV PHASE 2 RIA, supra note 65, at 4-115. 65
Sabin Center for Climate Change Law | Columbia Law School
14
How Much Does the Existing Regulatory Patchwork Reduce U.S. Greenhouse Gas Emissions?
attribute about 6 BMT CO2e to LDVs and the rest to LDVs.66 Stated in terms of reductions expected by particular years, the agencies anticipate the outcomes shown in Table 3 below. Table 3. Emissions reductions in each year listed by vehicle class
Year 2020 2025 2030 2035 2040 2050
HDVs68
LDVs67 -27 -271 -377 -455 -569
Total
Low -36.6
High -46.5
Low -63.6
High -73.5
-116.9
-132.7
-483.9
-509.7
-165.3
-183.3
-734.3
-752.3
Viewed as a percentage of nationwide emissions from energy use, this means a reduction of 11.3 to 13.4% from the EIA’s 2020 baseline.69 These estimates exceed—but are of the same order of magnitude as—O’Rear et al. (2015)’s estimates that CAFE standards will reduce GHG emissions by 4.4% relative to a 2025 economy-wide baseline scenario and 4.5% relative to a 2040 scenario.70 How certain are we about the amount? Only somewhat. Emissions from motor vehicles vary with population, number and type of vehicles, location of vehicles and distances to their destinations, cost of fuel,71 and drivers’ degree of “rebound”—that is, how much more they drive in a more fuel-efficient vehicle.72 Emission levels are highly sensitive to these variables, yet each
66
80 FED. REG. at 40139.
EPA & NHTSA, REGULATORY IMPACT ANALYSIS: FINAL RULEMAKING FOR 2017-2025 LIGHT-DUTY VEHICLE GREENHOUSE GAS EMISSION STANDARDS AND CORPORATE AVERAGE FUEL ECONOMY STANDARDS 239 (Aug. 2012) [hereinafter “LDV PHASE 1 RIA”]. 67
Data from EPA & NHTSA, REGULATORY IMPACT ANALYSIS FOR FINAL RULEMAKING TO ESTABLISH GREENHOUSE GAS EMISSIONS STANDARDS AND FUEL EFFICIENCY STANDARDS FOR MEDIUM- AND HEAVY-DUTY ENGINES AND VEHICLES REGULATORY IMPACT ANALYSIS (Aug. 2011) [hereinafter “HDV PHASE 1 RIA”], HDV PHASE 2 RIA. 68
See EIA, ANNUAL ENERGY OUTLOOK 2015 (“Energy-related carbon dioxide emissions”). 69
WITH
PROJECTIONS
TO
2040, at 26 (Apr. 2015), http://1.usa.gov/1OUP2p6
Eric G. O’Rear et al., Analysis of Impacts of Alternative Policies Aimed at Increasing US Energy Independence and Reducing GHG Emissions, 37 TRANSPORT POL’Y 121, 125 (2015). 70
In addition to this variable reflecting variations in the price of gas, it will also increasingly reflect the price of electric charging. 71
Analysts have found that demand elasticity relating to fuel costs and “rebound” are distinct phenomena. See KENNETH A. SMALL & KENT HYMEL, EPA, THE REBOUND EFFECTS FROM FUEL EFFICIENCY STANDARDS: MEASUREMENT AND PROJECTION TO 2035, at 16–17 (July 2015); see also JOSHUA LINN, RESOURCES FOR THE FUTURE, THE REBOUND EFFECT FOR PASSENGER VEHICLES, DP 13-19-REV, at 3 (Nov. 2013). Analysts have also lately settled some of the debate over proper rebound estimates. Linn 72
Sabin Center for Climate Change Law | Columbia Law School
15
How Much Does the Existing Regulatory Patchwork Reduce U.S. Greenhouse Gas Emissions?
variable’s future behavior is difficult to predict with confidence, not least because new technologies are expected to enter into the market and displace some of the technologies on which current projections are based.73 Notably, however, interactions with other policies do not seem to add to the uncertainty arising from the variables used to predict future vehicle miles traveled.74
1.5 Tax Credits Federal and state tax credits have supported spending on renewable energy sources over the past decade, and thereby indirectly supported GHG emissions reduction efforts as well.75 These nearly all fall into two categories: production and investment tax credits (PTCs and ITCs). State and federal PTCs compensate renewable generation owners by authorizing a tax deduction for the volume of kilowatts supplied to the grid by the renewable source. That deduction is generally limited in one or more of three ways: the volume of electricity supplied, duration of the tax benefit, and cumulative financial value of the tax benefit. State and federal ITCs compensate renewable generation owners based on the cost of development and also tend to be limited based on duration of the tax benefit.
argues that the 10% rebound rate EPA used in its 2012 rule is too low, and should be as much as 20 or 40%. Id. at 23. But Small & Hymel’s 2015 analysis for EPA finds otherwise. Although that 2015 analysis stipulates a short-run rebound effect of 4.6–4.7% and a long-run effect of about 28-30%, it also notes that the rebound effect in general has fallen in recent years and is likely to continue falling. SMALL & HYMEL at 63. See EPA, Transportation and Climate: Midterm Evaluation of Light-duty Vehicle Standards for Model Years 2022-2025, http://1.usa.gov/1Mc8Vcz (last visited Oct. 22, 2015) (“EPA will examine a wide range of factors, such as developments in powertrain technology, vehicle electrification, light-weighting and vehicle safety impacts, the penetration of fuel efficient technologies in the marketplace, consumer acceptance of fuel efficient technologies, trends in fuel prices and the vehicle fleet, employment impacts, and many others.”). 73
Allen A. Fawcett et al., Carbon Taxes to Achieve Emissions Targets: Insights from EMF 24, in IMPLEMENTING A US CARBON TAX: CHALLENGES AND DEBATES 78 (Ian Perry et al., eds. 2015) (“The models find that policies such as a CAFE standard or RPS, when combined with a quantity-based emissions target, do not change the amount of emissions reductions, but instead change the way in which those reductions are achieved, which generally lowers allowance prices but increases overall costs.”). 74
The Database of State Incentives for Renewable Energy (DSIRE) tracks the dozens of corporate and individual tax credits for various forms of renewable energy that are currently in force. DSIRE also notes, however, that “[a]t the state level, the general trends are that solar rebate incentives are decreasing, solar tax incentives are expiring, renewable portfolio standards are nearing their targets, net metering caps are being reached, and net metering and rate design are undergoing regulatory and legislative review.” DSIRE, THE 50 STATES OF SOLAR: A QUARTERLY LOOK AT AMERICA'S FASTEVOLVING DISTRIBUTED SOLAR POLICY CONVERSATION 4 (May 2015), http://bit.ly/1VmRGte. 75
Sabin Center for Climate Change Law | Columbia Law School
16
How Much Does the Existing Regulatory Patchwork Reduce U.S. Greenhouse Gas Emissions?
The most financially sizeable and politically salient of these tax credits are the federal Production Tax Credit (“PTC”) and the Investment Tax Credit (“ITC”).76 Though each is available for numerous forms of renewable energy, it has generally been the case that wind generation makes use of the PTC and solar of the ITC.77 Lately, they have been renewed for short durations of one or two years—or, as in the case of the wind PTC, not renewed at all since 2014.78 Currently, the ITC for solar is due to expire in 2016.79 The Senate Finance Committee has voted to extend the PTC for wind through to the end of 2016, but the House has yet to act.80 This latest chapter in what has long been stuttering approach to both tax credits has led to large swings in spending on renewable generation capacity.81 Have the federal PTC and ITC reduced emissions? While the answer to this question is clearly yes,82 few further details about PTC- and ITC-related emissions reduction are clear.83 How much? An answer to this question requires devising numeric estimates for several relationships that resist accurate numeric specification,84 but the National Academies of Science
These shorthand titles actually refer to the Renewable Electricity Production Tax Credit, the Business Energy Investment Tax Credit, and the Residential Renewable Energy Tax Credit. 76
See GAO, GAO-15-302, ELECTRICITY GENERATION PROJECTS: ADDITIONAL DATA COULD IMPROVE UNDERSTANDING OF THE EFFECTIVENESS OF TAX EXPENDITURES 30–36 (Apr. 2015) (discussing effects of PTC and ITC on wind and solar respectively). 77
78
Id. at 23 n.55 (noting that tax would still apply in 2015 to facilities on which construction began before Dec. 31, 2014).
79
DSIRE, BUSINESS ENERGY INVESTMENT TAX CREDIT PROGRAM OVERVIEW, http://bit.ly/1R9xa8Y (last updated May 15, 2015).
80
American Wind Energy Association, Senate committee votes 23-3 to extend federal tax credits
AWEA applauds strong bipartisan support for American wind power, renewable energy tax incentives, July 21, 2015, http://bit.ly/1COknHh. Daniel Cusick, Solar industry could face sharp decline without full tax credit -- studies, ENERGY & ENV'T, Sept. 16, 2015, http://bit.ly/1MpcZ3s (“PV solar is not expected to go off an economic cliff similar to what the wind industry experienced two years ago, when the sector's 2.3-cent-per-kilowatt-hour production tax credit (PTC) expired in December 2012 and was renewed only after the beginning of 2013.”). 81
82
See WILLIAM D. NORDHAUS ET AL., NAT’L ACAD. SCI., EFFECTS OF U.S. TAX POLICY ON GREENHOUSE GAS EMISSIONS 3, 58 (2013) (quantifying reductions from tax credits); Brian C. Murray et al., How Effective are US Renewable Energy Subsidies in Cutting Greenhouse Gases?, 104 AM. ECON. REV. 569 (2014) (echoing NAS conclusions). GAO-15-302, supra note 78, at 16 (“limited data hinder an understanding of the[ tax credits’] contributions to new generating capacity and ultimately, their effectiveness”). 83
See Murray et al., supra note 83, at 570 (“We found a few papers that econometrically estimated the effects of the production tax credit on wind capacity in the United States … but found nothing that connected changes in renewable capacity to emissions through power and fuel market-clearing mechanisms.”). Such an estimation would have to specify relationships between a) tax credits and increases in spending on renewable generation over and above those attributable to other incentives like RPSs, b) additional spending on renewable generation and the change in volume of renewably 84
Sabin Center for Climate Change Law | Columbia Law School
17
How Much Does the Existing Regulatory Patchwork Reduce U.S. Greenhouse Gas Emissions?
attempted to answer it nonetheless.85 The NAS’s 2013 report concluded that a scenario in which the tax credits were extended through 2035 would reduce national GHG emissions by 0.3% both annually and cumulatively relative to the EIA’s baseline and “high growth” scenarios for the years 2010-2035. 86 In terms of volume, this meant the tax credits were estimated to reduce GHG emissions by about 15 to 16 Mt CO2e annually and 360 to 393 Mt CO2e across the full 25-year period.87 How certain are we? Somewhat. Intuitively, the NAS estimate seems low, given that renewable generation construction is evidently responsive to the availability of the PTC and ITC,88 and that the PTC and ITC contributed to the development of over 28,000 MW of new utility-scale renewable generation capacity from 2009 to 2014 alone. 89 But the model from which the NAS derived its results seems to capture this responsiveness: NEMS-NAS projects that if the PTC/ITC are eliminated, then by 2035 utilities will add more than twice as many combustion turbines and nearly 50 percent more natural gas combined cycle plants while retiring 25 fewer coal-fired plants . . . . [T]he No-PTC/ITC scenario projects about half as many new utility-scale renewable installations and one-fifth as much new end-use renewables.90 Murray et al. (2014), after conducting a follow-up examination of the NAS 2013 report, emphasized that, while tax credits seemed to reduce GHG emissions in some circumstances, in others they would seem not to lead to any reduction at all. 91 This observation fits well with findings by GAO and others that tax credits’ effect on renewable development is sensitive to the generated electricity actually consumed, c) the change in volume of consumed renewable electricity and the volume of displaced non-renewable generation; and d) the GHG-emissions intensity of displaced non-renewable generation. 85
NORDHAUS ET AL., supra note 83, at 3, 58.
86
Id. at 3, 58.
87
Id. at 59.
MADELINE YOZWIAK ET AL., BLOOMBERG NEW ENERGY FINANCE, HOW EXTENDING THE INVESTMENT TAX CREDIT WOULD AFFECT US SOLAR BUILD 1 (2015), http://bit.ly/1FTQXn5 (“A pending reduction of the 30% investment tax credit (ITC) in 2017 will reduce build rates from an average of 8GW/year from 2014-16 to 6GW/year from 2017-22.”); ERIC LANTZ ET AL., NAT’L RENEWABLE ENERGY LAB’Y, IMPLICATIONS OF A PTC EXTENSION ON U.S. WIND DEPLOYMENT, 3 (2014) (“Past PTC expirations have resulted in reductions in year on year installations between 73% and 93%”). 88
89
GAO-15-302, supra note 78, at 16–18.
90
NORDHAUS ET AL., supra note 83, at 63.
91
Murray et al., supra note 83, at 572.
Sabin Center for Climate Change Law | Columbia Law School
18
How Much Does the Existing Regulatory Patchwork Reduce U.S. Greenhouse Gas Emissions?
presence of a state RPS.92 Whether or not it helps to explain the seemingly modest size of the effect estimated by NAS, it certainly echoes what NAS, GAO, and others report about the difficulty of detecting tax credits’ effect on emissions.
1.6 Regional Greenhouse Gas Initiative (“RGGI”) RGGI launched in 2005,93 expanded to include 10 states in 2007, and imposed a downwardratcheting GHG emissions cap-and-trade scheme starting in 2009.94 The scheme covered the 168 facilities within those states’ borders that can generate at least 25 megawatts of electricity; it did not cover emissions from smaller facilities in RGGI states and from all facilities located in nonmember states, even those that generated electricity imported into RGGI states. 95 A substantial portion—by some estimates, half96—of the proceeds from emissions permits auctioned pursuant to RGGI have funded renewable energy and energy efficiency initiatives in RGGI member states. Thus RGGI both raises the cost of emitting GHGs and supports efforts to emit less of them. Three significant things changed in RGGI’s first years. First, drops in the price of natural gas led to substantial displacements of coal-fired generation, reducing regional GHG emissions even before the 2009 cap entered into effect. Second, New Jersey withdrew from RGGI. And third, the remaining states agreed in 2012 to reset the cap to a lower level starting in 2014. Notably, because RGGI’s design included a “reserve price” for tradable emissions permits, the difference between the cap and actual emissions from 2009 to 2013 did not cause RGGI’s system of payments to grind to a halt. 97 Instead, that system simply functioned as a sort of carbon tax on subject
See GAO-15-302, supra note 78, at 10–14; see also KAREN PALMER ET AL., RESOURCES FOR THE FUTURE, FEDERAL POLICIES FOR RENEWABLE ELECTRICITY: IMPACTS AND INTERACTIONS (2011). 92
93
Regional Greenhouse Gas Initiative, Memorandum of Understanding (2005), http://bit.ly/1Q81D7i.
94
RGGI, Program Design, http://www.rggi.org/design/history.
J.L. RAMSEUR, CONG. RES. SERV., THE REGIONAL GREENHOUSE GAS INITIATIVE: LESSONS LEARNED AND ISSUES FOR CONGRESS 2 (July 2015). 95
Brian C. Murray et al., Why Have Greenhouse Gas Emissions in RGGI States Declined? An Econometric Attribution to Economic, Energy Market, and Policy Factors, Duke Environmental and Energy Economics Working Paper Series, No. EE 14-01 (May 2014). 96
97
RAMSEUR, supra note 96, at 9–10.
Sabin Center for Climate Change Law | Columbia Law School
19
How Much Does the Existing Regulatory Patchwork Reduce U.S. Greenhouse Gas Emissions?
facilities and their host states, generating over $2 billion from allowances despite an emissions cap set well above actual emissions levels.98 Has RGGI reduced emissions? Yes, RGGI has reduced GHG emissions. Several analyses of RGGI’s role in regional emissions reduction have come to broadly consistent conclusions: 99 although several factors affected regional GHG emissions since RGGI’s inception, RGGI appears to have been the cause of significant emissions reductions. How much? Because the reasons for GHG emissions reductions in RGGI states since 2009 are somewhat complex,100 their precise estimation is difficult.101 The following discussion explains the direct and indirect components of this paper’s approximate estimate—on average, 4.19 Mt CO2e annually since 2009. Direct Reductions. RGGI, Inc. reports that the average emission rate from sources subject to RGGI was 32.5% lower from 2011–2013 than from 2006–2008, and that the rate from sources from which RGGI states import electricity was 0.5% lower across those time periods.
102
The
corresponding reductions in emissions by mass are 40.8 Mt for RGGI sources and 0.214 Mt for sources that exported to RGGI states.103 Data from 2014 should be published by August of 2016— but Ramseur, writing for the Congressional Research Service, warns that the revised emissions cap, which took effect in January 2015, will make any comparison of results under the different caps “apples to oranges.”104 Fell & Maniloff (2015) examines changes from January 2004 to December 2012 in emissions from coal- and natural gas-fired electricity generators that are subject to RGGI and that export to
98
Id. at 9.
See, e.g., Man-Keun Kim & Kangil Lee, Dynamic Interactions Between Carbon and Energy Prices in the U.S. Regional Greenhouse Gas Initiative Region, 5 INT'L J. ENERGY, ECON. & POL'Y 494 (2015); P.J. HIBBARD ET AL., THE ANALYSIS GROUP, THE ECONOMIC IMPACTS OF THE REGIONAL GREENHOUSE GAS INITIATIVE ON TEN NORTHEAST AND MID-ATLANTIC STATES (2015), http://bit.ly/1j8zXnX; Murray et al., supra note 97. 99
HARRISON FELL & PETER MANILOFF, BENEFICIAL LEAKAGE: THE EFFECT OF THE REGIONAL GREENHOUSE GAS INITIATIVE ON AGGREGATE EMISSIONS, COLORADO SCHOOL OF MINES DIVISON OF ECONOMICS AND BUSINESS WORKING PAPER 2015-06 (June 2015). 100
101
See generally RAMSEUR, supra note 96.
RGGI, Inc., CO2 EMISSIONS FROM ELECTRICITY GENERATION AND IMPORTS IN THE REGIONAL GREENHOUSE GAS INITIATIVE: 2013 MONITORING REPORT 20–21 (Aug. 2015). 102
103
Id.
104
RAMSEUR, supra note 96, at 16.
Sabin Center for Climate Change Law | Columbia Law School
20
How Much Does the Existing Regulatory Patchwork Reduce U.S. Greenhouse Gas Emissions?
RGGI. Their paper isolates multiple factors that make it possible to estimate the effects on electricity supply and emissions from “generation leakage” owing to RGGI, i.e., electricity generation that took place beyond the RGGI region. Briefly stated, they find the following:
RGGI did not prompt fuel-switching within RGGI states;
“a primary compliance mechanism was to turn down coal plants in RGGI,” and coal generators subject to RGGI saw 7–10% capacity factor reductions;
Meanwhile, thanks to fuel switching in Pennsylvania and Ohio (major electricity exporters to RGGI members), those coal capacity factor reductions were chiefly offset by increases in the capacity factors of non-RGGI natural gas generators; and
Gross GHG emissions reductions owing to RGGI were 7.98 Mt annually; net reductions were 3.9 Mt, or 1.4% of the RGGI and non-RGGI total of 268.5 Mt annually.
Murray et al. (2014) put RGGI’s contribution to GHG emissions reductions into a national context, estimating that it accounted for almost 2% of the emissions decline seen nationally from 2009 to 2011.105 Indirect reductions. Only RGGI, Inc. has attempted a comprehensive estimate of indirect emissions reductions resulting from all RGGI-funded renewable energy and energy efficiency projects. It reports that the amounts spent on such projects are: $ 9.15 million on “clean technology R&D,” $ 582.58 million on energy efficiency efforts, and $ 152.17 million on renewable energy generation. RGGI, Inc. estimates the combined result of these investments to be a reduction of 1.18 Mt CO2e so far and anticipates a further reduction of 9.12 Mt CO2e, based on estimated lifetime contributions of renewable energy sources and energy efficiency investments.106 New York’s State Energy Research and Development Authority (“NYSERDA”) publishes estimates of GHG emissions reductions it attributes to RGGI-funded projects in New York. Those estimates are broadly consistent with RGGI, Inc.’s estimates: 0.19 Mt CO2e reduced so far, and anticipating a cumulative 5.79 Mt CO2e over the lifetime of RGGI-funded investments. No other 105
Murray et al., supra note 97, at 22.
RGGI, Inc., Investment of RGGI Proceeds Through 2013, at 7 (Aug. 2015), http://bit.ly/1N8V9EG; see also NYSERDA, NEW YORK’S REGIONAL GREENHOUSE GAS INITIATIVE INVESTMENT PLAN (2014 OPERATING PLAN) FINAL REPORT, at S-2 (Dec. 2014), http://on.ny.gov/1LqWIhQ (providing similar estimates of GHG reductions resulting from investment of RGGI auction proceeds). 106
Sabin Center for Climate Change Law | Columbia Law School
21
How Much Does the Existing Regulatory Patchwork Reduce U.S. Greenhouse Gas Emissions?
RGGI state produces this sort of comprehensive report, but some have reported on estimated GHG emissions reductions in piecemeal fashion.107 How certain are we? With respect to RGGI’s direct effects, fairly certain. The most likely statistical confounds identified by those who have analyzed RGGI’s effect on emissions are (i) reduced electricity demand amid the economic recession that started in 2008, (ii) fuel-switching, and (iii) leakage. Questions about each of these have largely been answered. Murray et al. (2014)’s careful econometric decomposition of GHG emissions data found that the effect of the recession was minimal and statistically insignificant. 108 That analysis also found that fuel-switching was highly significant and explained at least one-third of recorded emissions reductions. This is consistent with Fell & Maniloff’s description of the role of fuel switching as an important factor— chiefly via the importation of electricity from non-RGGI states like Pennsylvania and Ohio where natural gas substantially replaced coal from 2004 to 2013. With respect to RGGI’s indirect effects, there is little doubt that RGGI-funded investments in energy efficiency and renewable energy will not increase GHG emissions. However, because estimates of RGGI’s indirect effects on GHG emissions are few and difficult to substantiate, their accuracy is less certain.
1.7 California’s AB 32 AB 32 deals comprehensively with California’s GHG emissions,109 setting an overarching goal for their reduction and assigning California’s Air Resources Board (“CARB”) the task of devising a Scoping Plan that specifies reduction goals for particular sectors. 110 That Plan is reviewed and updated every five years.111 Notably, CARB’s First Update to the Scoping Plan in 2014 recalibrated the initial plan’s baseline because—as with RGGI—exogenous factors had caused
See, e.g., Massacusetts Dep't of Energy & Envtl. Affairs, Massachusetts Leads the Way in Greenhouse Gas Emissions Reduction Efforts; Successful RGGI Program Advocated as Model for Other States, http://1.usa.gov/1hm0NGi (last visited Oct. 22, 2015) (reporting cumulative reduction of 0.43 Mt CO2e to date from RGGI-funded energy efficiency projects); NEW HAMPSHIRE DEP'T OF ENVTL. SERVS., RGGI ANNUAL REPORT 8 (Oct. 21, 2014), http://1.usa.gov/1jWLTJH (estimating reduction of 7.26 Mt CO2e over lifetime of RGGI-funded investments). 107
108
Murray et al., supra note 97, at 21.
AB 32 regulates the same six GHGs as EPA’s CPP, as well as one more: nitrogen trifluoride (NF 3). CARB, Assembly Bill 32 Overview, http://bit.ly/1d7gp99 (last updated August 5, 2014). 109
110
Global Warming Solutions Act, 2006 Cal. Stat. ch. 488, http://bit.ly/1jR79Rx.
111
CARB, First Update to the AB 32 Scoping Plan, May 24, 2014, http://bit.ly/1sBi2UF.
Sabin Center for Climate Change Law | Columbia Law School
22
How Much Does the Existing Regulatory Patchwork Reduce U.S. Greenhouse Gas Emissions?
California’s emissions to decline.112 While the goal remains a return to 1990 emissions levels by 2020, the First Update has revised the 2020 baseline down to 509 Mt CO2e from 596. This means reducing emissions by 15% or 78 Mt CO2e over the next four years.113 CARB’s 2014 First Update parcels out the following reduction responsibilities among California’s “economic sectors.” 114 Those responsibilities are: 25 Mt CO2e from energy, comprised of electricity and natural gas facilities and infrastructure; 23 from transportation; 5 from high-GWP emissions;115 2 from waste; and 23 from AB 32’s cap and trade scheme,116 which covers electricity generators, large industrial facilities, and (as of January 2015) fuel distributors. California’s Governor pushed AB 32’s goal further still with an April 2015 Executive Order directing California to reduce GHG emissions to 40% below 1990 levels by 2030117—a goal and a timeframe that align California with jurisdictions committing to emissions reductions in advance of the 21st Conference of the Parties to the United Nations Framework Convention on Climate Change.118 That Executive Order indicates that its 2030 goal is actually an interim step toward emissions 80% below 1990 levels by 2050.119 Achieving these goals would mean that California would emit no more than 258.6 Mt CO2e in 2030—291.4 Mt CO2e less than a 2030 baseline of 550 Mt
CARB premised that 87 Mt reduction on three changes. It ascribed about 34% of the reduction to new policies: passage of the “Pavley” bill, which imposed emissions limits on motor vehicles for model years 2009-16, and California’s then20% RPS. It ascribed the remaining 66% to the economic downturn of 2008-2010. CARB, 2020 STATEWIDE GREENHOUSE GAS EMISSIONS AND THE 2020 TARGET 1 (May 2014), http://bit.ly/1WPIgUp. 112
This goal revises the initial one of 427 Mt CO2e as a result of CARB’s adoption of the Fourth IPCC Integrated Assessment Reports updated GWP values. CARB, 2020 BUSINESS-AS-USUAL EMISSIONS PROJECTION, 2014 EDITION (May 2015), http://bit.ly/1OnRztk. CARB continues to use the Fourth reports values, even though the Fifth report revised them again. See G. Myhre et al., ANTHROPOGENIC AND NATURAL RADIATIVE FORCING, IN CLIMATE CHANGE 2013: THE PHYSICAL SCIENCE BASIS. CONTRIBUTION OF WORKING GROUP I TO THE FIFTH ASSESSMENT REPORT OF THE INTERGOVERNMENTAL PANEL ON CLIMATE CHANGE (T.F. Stocker et al. eds. 2013). This means, for instance, that CARB calculates methane’s radiative forcing over a 100-year period to be 21 times that of CO2 instead of 28 times. 113
114
CARB, Economic Sectors Portal, http://bit.ly/1FVhRjU (last updated Sept. 14, 2015).
This category includes substances with a GWP of 150 times CO2 or higher. Their use has grown steadily in recent years as they have filled in for the ozone-depleting substances prohibited by the Montreal Protocol. See First Update to the AB 32 Scoping Plan, supra note 112, at 90. 115
116
See CARB, Overview of ARB Emissions Trading Program (Feb. 9, 2015), http://bit.ly/1R1xDdq.
117
Cal. Exec. Order B-30-15 (Apr. 29, 2015), http://bit.ly/1In2D5S.
Press Release, Office of the Governor, New California Goal Aims to Reduce Emissions 40 Percent Below 1990 Levels by 2030, Apr. 29, 2015, http://bit.ly/1KmIVsi. 118
119
Cal. Exec. Order B-30-15, supra note 118.
Sabin Center for Climate Change Law | Columbia Law School
23
How Much Does the Existing Regulatory Patchwork Reduce U.S. Greenhouse Gas Emissions?
CO2e,120 and 250.4 Mt CO2e less than CARB’s current baseline for 2020—and no more than 86.2 Mt CO2e in 2050. Has AB 32 reduced emissions? Unequivocally, yes, the suite of policies ushered in and/or encouraged by AB 32 has reduced the level of California’s GHG emissions. CARB maintains a GHG emissions inventory using data collected pursuant to California’s GHG reporting mandate— another feature of AB 32—and that inventory reflects clear reductions owing to AB 32’s provisions.121 How much? CARB reports that California sources emitted 459.3 Mt CO2e in 2013, a reduction of 35.7 Mt CO2e or 7.2% from the peak of 495 Mt CO2e emitted in 2004.122 On that basis CARB—and independent observers123—anticipate that California will meet AB 32’s 2020 goal of 509 Mt CO2e or less. However, specifying what of that reduction owes to AB 32’s interventions requires distinguishing their effects from the effects of exogenous variables like changes in emissions owing to the Great Recession124 and policies not counted among AB 32’s decarbonizing initiatives.125 Each is discussed in turn here.
This number uses as its 2030 baseline an extrapolation of CARB’s 2020 baseline. See MAX WEI ET AL., LAWRENCE BERKELEY NAT'L LAB'Y, SCENARIOS FOR MEETING CALIFORNIA'S 2050 CLIMATE GOALS--CALIFORNIA’S CARBON CHALLENGE PHASE II VOLUME I: NON-ELECTRICITY SECTORS AND OVERALL SCENARIO RESULTS 16 (2014), http://bit.ly/1NrFvV2. 120
See CARB, CALIFORNIA GREENHOUSE GAS EMISSION INVENTORY - 2015 EDITION, http://bit.ly/1jepEyC (last updated June 30, 2015). 121
122
CARB, 2020 BUSINESS-AS-USUAL EMISSIONS PROJECTION, 2014 EDITION, supra note 114, at 1.
See, e.g., Christopher S. Yang et al., Achieving California's 80% Greenhouse Gas Reduction Target in 2050: Technology, Policy and Scenario Analysis Using CA-TIMES Energy Economic Systems Model, 77 Energy Pol’y 118 (2015) (noting that costeffective means are already in place in energy and transport sectors for achieving interim 2030 goal); Jeffrey B. Greenblatt, Modeling California policy impacts on greenhouse gas emissions, 78 Energy Pol’y 158, 158 (2015); Mark Roelfsema, Are Major Economies on Track to Achieve Their Pledges for 2020? An Assessment of Domestic Climate and Energy Policies, 67 ENERGY POL’Y 781, 793 (2014) (anticipating 90-100% compliance with goals for California’s emissions trading scheme, which covers 85% of the state’s emitters); see also Ann E. Carlson, Regulatory Capacity and State Environmental Leadership: California's Climate Policy, 24 FORDHAM ENVTL. L. REV. 63 (2013) (describing CARB’s proven institutional capacity and prospective ability to handle ongoing GHG emissions reduction efforts). 123
The most striking evidence of the relationship between the downturn and emissions levels comes from cement plants, whose production and emissions levels fell steeply between 2007 and 2010, but have since recovered substantially as the housing market has rebounded. See id. at 7 (noting more than 30% drop in emissions from 2008 to 2009 alone). 124
CARB’s 2014 adjustment to its projection for a 2020 “business as usual” emissions scenario confirms this: CARB divides the 87 Mt CO2e difference between the 2006 and 2014 baseline scenario estimates into 57 Mt CO 2e attributable to the 2008-11 “severe and prolonged economic downturn” and 30 Mt CO2e to complementary non-AB-32 policies. See CARB, 2020 Statewide Greenhouse Gas Emissions and the 2020 Target 1, 5 (May 2014), http://bit.ly/1WPIgUp. 125
Sabin Center for Climate Change Law | Columbia Law School
24
How Much Does the Existing Regulatory Patchwork Reduce U.S. Greenhouse Gas Emissions?
Does the Great Recession deserve the credit for emissions reductions since passage of AB 32? Nelson et al. (2012) answers a nationwide version of this question by conducting a multiple regression analysis of the EIA’s post-recession revision of U.S. GHG emissions baseline projections for 2020 and 2030.126 That analysis seeks to detect the relative importance of economic activity and policy interventions, and concludes that while the 2008–2009 dip in economic activity accounts for roughly 20% of the EIA’s downward revision to its emissions baseline, policy interventions account for over 40% of that revision.127 It attributes the remaining 40% to fuel switching, energy efficiency improvements in building stock,128 and “unattributed reductions” that did not have any clear cause.129 California being home to the most aggressive GHG reduction policies in the country, this paper takes Nelson et al.’s findings as indicating that the effect of California’s GHG emissions reduction policies was at least twice that of the recession. This conclusion would seem to be confirmed by the downward-sloping trend of California emissions per capita, which became steeper after the recession (see Figure 3 at right).130 CARB’s 2014 recalibration of its 2020 baseline also took into account the emissions effects of California’s low carbon fuel standard and RPS, which are part of the Second Scoping Plan but were not included in the initial Scoping Plan. 131 It estimated that those policies had
Hal T. Nelson et al., The Great Recession or progressive energy policies? Explaining the decline in US greenhouse gas emissions forecasts, J. ENVTL. PLANNING & MGMT., May 2015. 126
127
Id. at 16.
128
It distinguishes these improvements from changes attributable to state energy efficiency portfolio standards. Id.
129
Id. at 15–17.
Figure from CARB, CALIFORNIA GREENHOUSE GAS EMISSION INVENTORY - 2015 EDITION, supra note 122, at 1; trend lines added by author. 130
131
CARB, 2020 STATEWIDE GREENHOUSE GAS EMISSIONS AND THE 2020 TARGET 1, (May 2014).
Sabin Center for Climate Change Law | Columbia Law School
25
How Much Does the Existing Regulatory Patchwork Reduce U.S. Greenhouse Gas Emissions?
yielded emissions reductions of 30 Mt CO2e, reducing what would be required of AB 32 policies to achieve the goal of reaching 1990 emissions levels by 2020.132 How certain are we? Of projections up to 2020, somewhat certain; of 2030 projections, less certain. Beyond 2030, that certainty erodes sharply. 133 This reflects an evolving but incomplete understanding of how effective and cost-effective particular technological and operational changes will be in the sectors CARB regulates.134 For instance, whereas there is growing confidence about California’s ability to accommodate a large proportion of variable renewable electricity generation sources into its electric grid, less is currently understood about what it will take to electrify the transportation sector and to prevent the replacement of ozone-depleting refrigerants with highGWP substitutes. This increasing degree of uncertainty owes also to emissions reduction policies potentially becoming competitive rather than complementary as downward-ratcheting emissions limits push California’s various sectors to make increasingly expensive changes.135
1.8 State Renewable Portfolio Standards (“RPSs”) Twenty-nine states and Washington, DC have adopted renewable portfolio standards (“RPSs”) requiring that their electrical utilities purchase a minimum quotient of electricity from renewable sources.136 Another eight states have legislated non-binding renewable portfolio goals.137
See id. (reducing earlier 2020 baseline scenario by 32 Mt CO2e to account for effect of low carbon fuel standard and RPS). Thirty-two is 5% of the revised 2020 baseline of 509 Mt CO2e. 132
See Geoffrey M. Morrison et al., Comparison of low-carbon pathways for California, 131 CLIMATIC CHANGE 545 (2015) (identifying key features and factors of energy and emissions models employed in the following studies: C. Yang, Achieving California’s 80% greenhouse gas reduction target in 2050: technology, policy and scenario analysis using CA-TIMES energy economic systems model, 77 ENERGY POL’Y 118 (2015); M.Z. Jacobson et al., A roadmap for repowering California for all purposes with wind, water, and sunlight, 73 ENERGY 875 (2014); J.H. NELSON ET AL., SCENARIOS FOR DEEP CARBON EMISSIONS REDUCTIONS FROM ELECTRICITY BY 2050 IN WESTERN NORTH AMERICA USING THE SWITCH ELECTRIC POWER SECTOR PLANNING MODEL (VOL. II, CALIFORNIA’S CARBON CHALLENGE PHASE 2), CAL. ENERGY COMM’N PIER REPORT (2014); M. WEI M ET AL., NON-ELECTRICITY SECTORS AND OVERALL SCENARIOS FOR MEETING 80 % EMISSIONS REDUCTION IN 2050 (VOL. I, CALIFORNIA’S CARBON CHALLENGE PHASE 2) CAL. ENERGY COMM’N PIER REPORT (Mar. 2014)). 133
TODD SCHATZKI & ROBERT N. STAVINS, BEYOND AB 32: POST-2020 CLIMATE POLICY FOR CALIFORNIA (Jan. 2014); James H. Williams et al., The Technology Path to Deep Greenhouse Gas Emissions Cuts by 2050: The Pivotal Role of Electricity, 335 SCIENCE 53, 54 (2012) (“Without electrification, the other measures combined produced at best 2050 emissions of 210Mt CO2e, about 50% below the 1990 level.”). 134
See Severin Borenstein et al., Expecting the Unexpected: Emissions Uncertainty and Environmental Market Design, NBER Working Paper 20999 (Mar. 2015) (finding that AB 32 policies compelling particular investments yield sharp and sudden price changes in emissions trading scheme model). 135
136
DSIRE, Renewable Portfolio Standard Policies (June 2015), http://bit.ly/1XhTUry.
Sabin Center for Climate Change Law | Columbia Law School
26
How Much Does the Existing Regulatory Patchwork Reduce U.S. Greenhouse Gas Emissions?
Those commitments range widely in their particulars. Seven states have chosen 2015 as their target year, 10 have chosen 2020, and another 12 have chosen 2025 or 2026 (states generally also employ interim targets). Though most states have set a percentage to achieve by those dates, Iowa and Texas have specified a volume of megawatts instead. Of those that specify a percentage, some apply it generally to all utilities while others apply it only to investor-owned utilities, thereby excluding, for instance, rural electric cooperatives. The percentages specified range widely, with South Carolina committing to 2% by 2021 and Hawaii committing to 100% by 2045. Twenty-five of the 38 states with a percentage-based RPS/RPG have committed to achieving 10 to 25% renewable power. If one ignores the highest (100%) and lowest (2%) percentages, the average is 21%.138 As Yin & Powers (2010) find, however, “some seemingly aggressive RPS policies in fact provide only weak incentives, while some seemingly moderate RPS policies are in fact relatively ambitious.”139 While Yin and Powers’ data and analysis disproves the argument that RPSs are merely symbolic,140 they also highlight that an RPS’s effectiveness turns substantially on whether it permits utilities to comply by purchasing renewable energy credits—especially if those credits can be purchased from out-of-state.141 EPA has summarized the analytic steps necessary to estimate how an RPS/RPG affects GHG emissions:
Determine the “load profile” or operating characteristics of the renewable source;
Identify marginal generating units, that is, relatively costly units that would be the first to go if a utility were required to purchase from a different source instead;
137
Id.
138
Id.
Determine avoided emissions factors for those marginal units; and
Haitao Yin & Nicholas Powers, Do State Renewable Portfolio Standards Promote In-State Renewable Generation?, 38 ENERGY POL’Y 1140 (2010). 139
See id. at 1141 (citing Joshua Kneifel, Effects of State Government Policies on Electricity Capacity from Non-Hydropower Renewable Sources, unpublished manuscript, Univ. Florida (2008), http://bit.ly/1OSuoGl, and J. Bushnell et al., California’s Greenhouse Gas Policies: Local Solutions to a Growing Problem?, Univ. Cal. Energy Inst., Berkeley (Apr. 2007)), 1149 (“on average, RPS policies have had a significant and positive effect on in-state renewable energy development.”). 140
141
Id. at 1149.
Sabin Center for Climate Change Law | Columbia Law School
27
How Much Does the Existing Regulatory Patchwork Reduce U.S. Greenhouse Gas Emissions?
Calculate emissions reductions by multiplying the volume of avoided dirty generation by the appropriate emissions factor, subtracting as appropriate for emissions from whatever cleaner sources displace the marginal dirty ones.142
Because RPSs are not the only thing that displaces marginal generating units, even this stepwise analysis can be expected to only roughly approximate the relationship between RPSs and GHG emissions reductions. Have RPSs reduced emissions? Yes, they have. Though analyses differ as to the amount, there is strong evidence that GHG emissions are lower—and have fallen faster—as a result of states’ imposition of RPSs on their electricity sectors.143 How much? Different examinations of this question have provided somewhat divergent answers. Sekar & Sohngen (2014) examine RPSs’ effect on GHG emissions from 1997 to 2010 and conclude that the effect is substantial—a reduction in national annual emissions of approximately 4%144 or 224.76 Mt CO2e in 2010.145 As the authors observe, “[g]iven that by 2010 the RPS have been in effect for only a few years in many states, this is a fairly significant impact.” 146 Their model estimates that, in general, a 1% increase in an RPS requirement will reduce carbon intensity in that state by 0.6%.147 This is at odds with what Nelson et al. (2015) finds after examining EIA’s 2011 revision of its 2007 projections.148 Based on a decomposition analysis of EIA’s revised estimate, Nelson et al. infer that RPSs can be expected to account for a 49.5 Mt CO2e reduction in annual emissions by
EPA, BACKGROUND http://bit.ly/1QPtzgu. 142
AND
DRAFT METHODOLOGY
FOR
ESTIMATING ENERGY IMPACTS
OF
EE/RE POLICIES (Feb. 2014),
See SAMANTHA SEKAR & BRENT SOHNGEN, RESOURCES FOR THE FUTURE, DP 14-10, THE EFFECTS OF RENEWABLE PORTFOLIO STANDARDS ON CARBON INTENSITY IN THE UNITED STATES, (Apr. 2014), http://bit.ly/1OQs9mV; Luke J.L. Eastin, An Assessment of the Effectiveness of Renewable Portfolio Standards in the United States, 27 ELECTRICITY J. 1040 (2014); Yin & Powers, supra note 140. 143
144
Sekar & Sohngen, supra note 144.
EIA, MONTHLY ENERGY REVIEW, DOE/EIA-0035, fig.36 (Nov. 2014) (historical and projected energy-related CO2e emissions). 145
146
Sekar & Sohngen, supra note 144, at 10.
147
Id. at 11.
Hal T. Nelson et al., The Great Recession or progressive energy policies? Explaining the decline in US greenhouse gas emissions forecasts, J. ENVTL. PLANNING & MGMT., May 2015. 148
Sabin Center for Climate Change Law | Columbia Law School
28
How Much Does the Existing Regulatory Patchwork Reduce U.S. Greenhouse Gas Emissions?
2020.149 That amount is 0.06% of the emissions that EIA’s AEO 2007 projected would occur in 2020 and 0.09% of emissions EIA’s AEO 2015 projects for 2020. It is significantly lower than the 4% estimated by Sekar & Sohngen, which also predicted that increasingly numerous and demanding RPSs would push that 4% estimate higher in years after 2010. How certain are we? As the disagreement between analyses noted above makes clear, we cannot be fully certain of the amount. Such disagreement is understandable, given that research has not even converged on estimates of RPS requirements’ effects on renewable generation capacity,150 much less on their effects on GHG emissions. However, this paper does not give equal weight to the two estimates above, because the latter one is not focused on deriving such an estimate. Consequently, its estimate of 0.06% is a wholly indirect statistical inference based on an analysis of EIA’s revision of a pre-recession AEO to a post-recession one. This in contrast to Sekar & Sohngen, which arrives at a 4% estimate using retrospective empirical data and an analysis designed to estimate how RPSs relate to GHG emissions. In sum, this paper views Sekar & Sohngen’s analysis as a source of substantial certainty.
2. CONCLUSION This paper examines estimates of how effective various regulatory interventions have been and are expected to be for the purpose of reducing U.S. GHG emissions. In addition to arriving at estimates, it characterizes those estimates’ quality. An important subtext of this paper is that the effectiveness (and cost-effectiveness) of the existing patchwork of regulatory interventions for the purpose of GHG emissions reduction is unwieldy even to measure, much less to ensure.
149
Id. at 16.
See WARREN LEON, THE STATE OF STATE RENEWABLE PORTFOLIO STANDARDS 5 (June 2013) (“The exact contribution of RPS policies to the growth in renewable energy capacity is therefore impossible to quantify with precision, but there can be no doubt that it has been significant.”); see also GALEN BARBOSE, LAWRENCE BERKELEY NAT'L LAB'Y, RENEWABLES PORTFOLIO STANDARDS IN THE UNITED STATES: A STATUS UPDATE 8 (Nov. 2013) (“Renewable additions are counted as ‘RPS-motivated’ if and only if they are located in a state with an RPS policy and commercial operation began no more than one year before the first year of RPS compliance obligations in that state.”). 150
Sabin Center for Climate Change Law | Columbia Law School
29