J PROD INNOV MANAG 2012;29(6):1000–1011 © 2012 Product Development & Management Association DOI: 10.1111/j.1540-5885.2012.00976.x
Directive Deficiencies: How Resource Constraints Direct Opportunity Identification in SMEs* Elco van Burg, Ksenia Podoynitsyna, Lien Beck, Tinne Lommelen
Previous studies show that resource constraints have mixed effects on innovation and opportunity identification by entrepreneurs. Sometimes, resource constraints lead to identifying more opportunities, whereas in other cases, entrepreneurs see fewer opportunities. This study explores a new approach to reconcile this inconsistency. Using a sample of 219 small- and medium-sized enterprises (SMEs), we explore relationships between supply and demand constraints, on the one hand, and identifying supply and demand opportunities, on the other hand. The results show that supply constraints have a positive effect on identifying supply opportunities but a negative effect on identifying demand opportunities. Similarly, demand constraints have a positive effect on identifying demand opportunities but a negative effect on identifying supply opportunities. Thus, this study shows that resource constraints direct the entrepreneur’s attention toward opportunities inside the constrained domain rather than outside the constrained domain. An important consequence for theory is that a complete explanation of the mixed effects of resource constraints should consider different types of resource constraints and different sources of opportunities simultaneously. For practicing entrepreneurs, being aware of this mechanism can prevent missing out on promising opportunities outside the constrained domains.
Introduction
E
ntrepreneurs act upon opportunities they envision. Therefore, one of the fundamental questions of entrepreneurship research is: when do entrepreneurs identify opportunities, and which opportunities do they identify? Extant research has shown that prior knowledge and entrepreneurial experience channel opportunity identification (Shane, 2000; Shepherd, Zacharakis, and Baron, 2003). In addition, some studies have started to explore how the amount of resources at hand shapes opportunity identification (Baker and Nelson, 2005; Garmaise, 2008; Haynie, Shepherd and McMullen, 2009). The amount of available resources appears to have both negative and positive effects on opportunity identification by entrepreneurs. On the one hand, abundant resources enable experimentation resulting in more new
Address correspondence to: Elco van Burg, Faculty of Economics and Business Administration, VU University Amsterdam, De Boelelaan 1105, 1081 HV Amsterdam, the Netherlands. E-mail:
[email protected]. Tel: +31 20 59 82510. * The authors are grateful to the editor Tony Di Benedetto, Scott Shane, participants of the 18th International Product Development Management Conference, and seminar participants at EPFL for their helpful comments. Any remaining errors are courtesy of the authors. Financial support for this research was provided by “Strategisch Innoveren,” a large-scale SME support project sponsored by the European, Flemish, and Dutch government, and coordinated by Maastricht University and Hasselt University.
ideas and more innovation (Paladino, 2007; Song, Podoynitsyna, van der Bij, and Halman, 2008; Voss, Sirdeshmukh, and Voss, 2008). On the other hand, resource constraints can spur necessity-driven creativity and lead to identifying promising opportunities (Katila and Shane, 2005; Ward, 2004). To reconcile this inconsistency, it is proposed that the relationship between the availability of resources and opportunity identification follows an inverted U-shape (Renko, Reynolds, and Carsrud, 2010) or is moderated by, for instance, the innovation team’s cohesion and potency (Hoegl, Gibbert, and Mazursky, 2008). Following a new approach, this article explores how particular types of resource constraints direct identifying opportunities from different sources. We study the relationship between resource constraints and opportunity identification in small- and medium-sized enterprises (SMEs) while controlling for the fact that team-level diversity might influence creativity of entrepreneurial teams (Song and Parry, 1997). We distinguish between supply and demand constraints, and relate those to the propensity to identify opportunities from related supply and demand categories. As a particularly interesting demand opportunity, this study tests whether entrepreneurs identify sustainable opportunities: opportunities related to preventing environmental degradation or improving the natural or social environment (Cohen and Winn, 2007; Patzelt and Shepherd, 2011; Zahra,
CONSTRAINTS AND OPPORTUNITY IDENTIFICATION
Gedajlovic, Neubaum, and Shulman, 2009). Relating the specific constrained domain with the source of the identified opportunities, the results show that resourceconstrained entrepreneurs do identify more opportunities within the constrained domain but fewer opportunities outside the constrained domain.
Theoretical Background Resource Constraints and Creativity The effects of resource constraints on creativity, opportunity identification, and resulting innovative performance are mixed. A lack of financial resources can limit firms’ innovative performance, as they cannot afford to develop (multiple) technologies or to experiment with new ideas (Agarwal, Sarkar, and Echambadi, 2002; De Carolis, Yang, Deeds, and Nelling, 2009; Nohria and Gulati, 1996; Voss et al., 2008). Missing specific capabilities caused by a shortage of qualified managers and employees also reduces innovativeness (Díaz-Díaz,
BIOGRAPHICAL SKETCHES Dr. Elco van Burg is an Assistant Professor of Entrepreneurship and Organization at the Faculty of Economics and Business Administration at VU University in Amsterdam. He received his Ph.D. from Eindhoven University of Technology in 2010. His research particularly concerns the cooperative behavior of (academic) entrepreneurs and the process of imagining entrepreneurial opportunities. He has published in, among others, Organization Science, Production and Operations Management, and the Journal of Product Innovation Management. Dr. Ksenia Podoynitsyna is an Assistant Professor of Entrepreneurship at Eindhoven University of Technology (TU/e). Her research interests include entrepreneurial cognition and opportunity identification, uncertainty management strategies of technology ventures, and business model innovation. Recently, Ksenia got funding for a number of research and teaching initiatives in the area of sustainable energy. She has published in such journals as Journal of Product Innovation Management, Journal of Business Venturing, and Entrepreneurship Theory and Practice. Ms. Lien Beck is a doctoral researcher in the Centre of Entrepreneurship and Innovation (KIZOK) at Hasselt University. She is also a member of the team that coordinates “Strategisch Innoveren,” a large-scale project that encourages SMEs to participate in a strategic review process to (re)define their strategy and enhance their innovation capacity. Her research interests include market orientation, marketing capabilities, and innovation. She has published in, among others, Family Business Review. Dr. Tinne Lommelen is project manager at Hasselt University. She received her Ph.D. from Hasselt University in 2004, with a dissertation on the internationalization of service companies. Today, Tinne coordinates large-scale projects in which university, industry, and government interact to enhance innovation in SMEs.
J PROD INNOV MANAG 2012;29(6):1000–1011
1001
Aguiar-Díaz, and De Saá-Pérez, 2008). In particular, small firms and young ventures experience that these resource constraints have far-reaching consequences. For instance, small firms with financial constraints are not able to hire the required employees, which reduces their innovativeness and viability (Eisenhardt and Schoonhoven, 1996; Rao and Drazin, 2002). Yet, studies also confirm that necessity is the mother of innovation. The psychological mechanism of “bounded creativity” predicts that the human mind will be more productive when restrictions apply, resulting in identifying not only more but also more diverse and creative opportunities (Finke, Ward, and Smith, 1992; Goldenberg, Lehmann, and Mazursky, 2001; Moreau and Dahl, 2005). Thus, resource constraints appear also to drive creativity and innovative behavior (Hoegl et al., 2008; Mosakowski, 2002). Katila and Shane (2005) found that new ventures, although possessing fewer resources, are more innovative than their established peers in industries with high competition and in small markets. Resource-constrained entrepreneurs appear to be more resourceful to take profit from any emerging opportunity while employing their scarce resources (Baker and Nelson, 2005; Renko et al., 2010). While a venture’s resource endowments may result in less efficient operations (Debruyne, Frambach, and Moenaert, 2010; George, 2005; Hvide and Møen, 2010) and turn the firm’s innovative strategy into core rigidities (Mosakowski, 2002), resource-constrained firms are rather forced to break away from existing paths and to imagine new opportunities (Musso and Schiavo, 2008; Stevenson and Jarillo, 1990). Researchers have proposed three different solutions for these mixed effects of resource constraints on creativity and innovative performance (Mellahi and Wilkinson, 2010). Most studies have followed the level-ofresources explanation, which proposes that the relationship between resource availability and creativity is curvilinear (Bourgeois, 1981). A significant lack of resources may hamper innovative activity, while entrepreneurs with too many resources become lazy, inefficient, and lose their fit with the market (Bradley, Wiklund, and Shepherd, 2011; Mellahi and Wilkinson, 2010; Nohria and Gulati, 1996). The contingency explanation proposes that positive and negative effects of resource constraints are moderated by individual- and team-level characteristics, such as the knowledge of the firm’s employees, and the composition and cohesion of the innovation team (Hoegl et al., 2008). Moreover, firm-level contingencies, such as strategic choices (Mishina, Pollock, and Porac, 2004) or
1002
J PROD INNOV MANAG 2012;29(6):1000–1011
management practices (Bradley et al., 2011), may explain the effect of resource availability. The type-of-resources explanation is a third and rather new approach, which is further explored in this study. This approach argues that different types of resource constraints have different effects on identifying specific new ideas (Mellahi and Wilkinson, 2010; Mishina et al., 2004). For instance, the value of human resources is much more task- and context-dependent than is the value of financial resources (Mishina et al., 2004). A lack of skilled employees may limit creativity and impact the ability to pursue alternative strategies (Voss et al., 2008), while the lack of adequate financing may rather stimulate resourcefulness (Baker and Nelson, 2005) and creative bootstrapping strategies (Carter and Van Auken, 2005). To explore the effect of different types of resources on opportunity identification, two categories of constraints are distinguished. First, deficiencies in the internal processes in the firm create supply constraints, which include the lack of financial resources, such as cash, cash flow, inventory, and accounts receivable (Bradley et al., 2011; George, 2005). Moreover, the lack of skilled and well-performing employees (Mishina et al., 2004) and deficiencies in the production processes, production equipment, or products (Hoegl et al., 2008; Hoegl, Weiss, and Gibbert, 2010) can cause difficulties to supply (new) products to the market. Second, demand constraints concern shortages of customer demand, and difficult or insufficient relationships with clients (Sirdeshmukh, Singh, and Sabol, 2002; Voss et al., 2008).
Opportunity Identification In the domain of entrepreneurship, the identification and pursuit of opportunities is a key notion that researchers seek to understand (Shane and Venkataraman, 2000; Short, Ketchen, Shook, and Ireland, 2010). An entrepreneurial opportunity is an idea or dream that is discovered or created by an entrepreneurial entity (Short et al., 2010). Entrepreneurial opportunities can originate from changes in supply and from changes in demand (Eckhardt and Shane, 2003; Stevenson and Gumpert, 1985). First, supply opportunities originate from changes in market supply, such as the withdrawal of competitors, emerging mismatches between supply and demand, and new ways of organizing production processes (Eckhardt and Shane, 2003; Schumpeter, 1934; Stevenson and Gumpert, 1985). Second, demand opportunities stem from changes in market demand, for instance, as a result of demographic developments, regulatory changes, and changing customer preferences (Christensen and Bower, 1996;
E. VAN BURG ET AL.
Drucker, 1985). A specific type of demand opportunities, which is becoming more and more important for entrepreneurs, is sustainable opportunities. The growing desire of many individuals to prevent environmental degradation or even gradually improve the natural and social environment provides opportunities for entrepreneurial action to fulfill new demand (Cohen and Winn, 2007; Patzelt and Shepherd, 2011; Zahra et al., 2009). Extant literature has shown that the identification of particular opportunities is influenced by the entrepreneur’s prior knowledge (Gruber, MacMillan, and Thompson, 2008; Shane, 2000; Shepherd and DeTienne, 2005), previous entrepreneurial experience (Baron, 2004; Ucbasaran, Westhead, and Wright, 2009), and engagement in experiential learning processes (Corbett, 2005; Lumpkin and Lichtenstein, 2005). These antecedents explain opportunity identification from behavior, experiences, and knowledge that have accumulated during past activities. Other studies considered the influence of circumstances at the moment of opportunity identification, among which are the availability of resources. Available resources direct the entrepreneur’s attention toward particular opportunities: entrepreneurs are attracted to opportunities that are in line with their existing resources (Haynie et al., 2009; Sarasvathy, 2001). In view of promising opportunities, however, resource-constrained entrepreneurs may also want to collect more resources (Baker, 2007; Baker and Nelson, 2005; Haynie et al., 2009). As such, the link between the creative identification of opportunities and resource constraints seems to be a key mechanism driving innovation in and performance of entrepreneurial ventures. Yet, the interaction between specific types of resource constraints and the identification of particular opportunities has not received much attention, while this may provide more insight in the effect of resource constraints and help understanding when particular opportunities are identified.
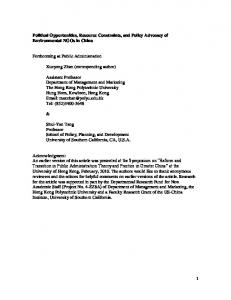
Relatedness of Constraints and Opportunities To identify how experiencing different types of resource constraints directs attention toward identifying opportunities from different sources, we develop exploratory hypotheses. Relating the two different types of resource constraints (supply and demand constraints) to the two sources of opportunities (supply and demand opportunities) leads to Figure 1. Matching resource constraints to opportunity sources raises the fundamental question whether constraints in a particular domain A lead to identifying more opportuni-
CONSTRAINTS AND OPPORTUNITY IDENTIFICATION
J PROD INNOV MANAG 2012;29(6):1000–1011
Source of Opportunities Supply
Demand
Supply
Related: Identifying more opportunities (H1a)
Unrelated: Identifying fewer opportunities (H1b)
Demand
Unrelated: Identifying fewer opportunities (H2a)
Related: Identifying more opportunities (H2b)
Type of Constraints
Figure 1. Mapping Constraint Types to Opportunity Sources
ties in the related opportunity domain A' or rather stimulate identifying more opportunities in an unrelated domain B. In other words, does the entrepreneur’s creativity unleashed by the perceived boundaries address the constrained domain or circumvent the constraints by identifying new rather unrelated opportunities? Gibbert and Scranton (2009) describe how during and after the Second World War German and French teams were developing aircraft turbofans. Both teams had to find a cooling solution for the turbofan. The French turbofan engineers avoided solving the problem within the given boundaries and did not identify their own solution for the cooling problem, but they circumvented the problem by copying and simplifying the design of the German team (Gibbert and Scranton, 2009). Thus, entrepreneurs may seek new opportunities that navigate away from the constraints and come up with something entirely different (see Audia and Goncalo, 2007). In contrast, the German team did not have access to other solutions and to appropriate alloys, and thus could not replace the steel with more heat-resistant alloys. Because of this material constraint, they altered the design of the turbofan, resulting in a cooling solution. Thus, the opportunity was identified precisely because there was a cooling problem, and domain-relevant skills and knowledge were leveraged toward finding a solution within the problem domain (Hoegl et al., 2008). Similarly, Moreau and Dahl (2005) found that consumers design more creative solutions in the area where they experience input constraints—a phenomenon they later coined “thinking inside the box” as opposed to the “thinking outside the box” (Dahl and Moreau, 2007). This seems to be the most common behavior of entrepreneurs, as they use the resources at hand—even if they experi-
1003
ence a significant lack of those resources—to create new and innovative solutions (Baker, 2007; Baker and Nelson, 2005). Thus, we expect that supply constraints increase the likelihood of identifying opportunities from the related source of supply opportunities, while entrepreneurs identify fewer opportunities from other, unrelated opportunity sources. This leads to the following hypotheses: H1a: Experiencing supply constraints leads to identifying more supply opportunities. H1b: Experiencing supply constraints leads to identifying fewer demand opportunities.
Similarly, experiencing demand constraints will trigger thinking about solutions for the demand problems. Thus, entrepreneurs experiencing demand constraints are likely to identify more demand opportunities, while identifying fewer opportunities from unrelated sources. Thus, we predict: H2a: Experiencing demand constraints leads to identifying more demand opportunities. H2b: Experiencing demand constraints leads to identifying fewer supply opportunities.
Method Sample The data originate from the project “Strategic Innovation” in Belgium and the Netherlands, which started in 2008 and finished in 2011. This government-funded project stimulated companies to participate in a strategic review process. The project’s main objective was to help companies rethink their strategy. The only selection criterion for companies to participate in the project was that the company qualified as an SME. Following the European Commission’s definition of SMEs (European Commission, 2003), SMEs are defined as companies with no more than 250 employees, an annual maximum turnover of 50 million Euro or a balance sheet total of no more than 43 million Euro. The SMEs were invited to the project through mailings, SME fairs, and existing networks of project partners, consultants, and employers’ organizations. The project’s protocol included three steps to collect data from the SME and to create an in-depth discussion within the SME’s management. This data collection was performed by interviewers who were first trained in the research and intervention methodology of the project.
1004
J PROD INNOV MANAG 2012;29(6):1000–1011
E. VAN BURG ET AL.
Table 1. Sample Distribution across Size, Age, and Industry Characteristic Size (full-time equivalent employees) Micro companies (1–10 employees) Small companies (11–50 employees) Medium-sized companies (51–250 employees) Age (number of years) ⱕ5 years 6–10 years 11–20 years ⱖ21 years Industry Service industry Manufacturing Other industries Total
Number of firms 90 (41.1%) 100 (45.7%) 29 (13.2%) 41 29 52 97
(18.7%) (13.2%) (23.7%) (44.3%)
82 85 52 219
(37.5%) (38.8%) (23.7%) (100%)
of size, age, and industry (De Jong and Vermeulen, 2006). This revealed that our sample has a similar age distribution. However, the firms in our sample tended to be smaller and more active in the manufacturing sector. Because the analysis controls for size and industry, this is not a significant concern for this study. Additionally, the companies that did participate in the project could have a different profile than those that did not participate. Therefore, a control group was created, containing 109 companies. These companies decided not to participate in the full project but did complete the questionnaire, which is the second step of the protocol. No significant differences are found between the companies included in the full project and the control group. Thus, selection bias in this study appears to be limited.
Dependent Variables The first step was an interview of approximately two hours with the firm’s chief executive officer (CEO). In this interview, information was collected about the company in general, its customers and products, and the strategic changes that took place in the company over the past 10 years. Second, a questionnaire was filled out by the CEO. This questionnaire contained financial and sales questions. The information collected through the interview and the questionnaire was used in the third step, where strategic conversation sessions were performed. In these sessions, the firm’s management team discussed the internal and external environment in which the company operated. This discussion was finished by composing a ranking of five firm-specific strengths, weaknesses, opportunities, and threats. This study employs data from these three protocol steps. The average time between the data collection steps was two weeks. Both qualitative and quantitative data are included from the interview, the questionnaire, and the coded strategic sessions. Because different sources of data are used and there is time separation between data collection moments, the concerns for potential common method variance are limited (Podsakoff, MacKenzie, Lee, and Podsakoff, 2003; Podsakoff and Organ, 1986). The total study included 237 Dutch and Belgian SMEs. Because of missing values, the final study sample includes 219 SMEs. The detailed statistics of the sample can be found in Table 1. The fact that the entrepreneurs had to volunteer themselves for the project could introduce a self-selection bias. Therefore, we compared our sample’s characteristics with a large-scale (1250 firms) study, with a similar focus on innovation in SMEs in the same region, in terms
For the dependent variables, the sources of opportunities, this study relies on data collected in the strategic conversation sessions. In these sessions, the opportunities as perceived by the SME’s management team were discussed, and finally, the team listed at maximum five opportunities. Entrepreneurship literature emphasizes that entrepreneurial opportunities are perceived by people rather than objectively existing in the outside world. Thus, our measure for opportunities as perceived and reported by the entrepreneurial team fits with existing entrepreneurship theory (see Shane, 2003; Short et al., 2010). In order to obtain insights into the different sources of opportunities, the opportunities reported by each company’s management team were coded by two raters. These coders used standardized coding instructions, which were developed by exploratory coding a number of interviews and by interaction with existing innovation literature (see Locke, 2001; Miles and Huberman, 1994). These coding instructions differentiated between sources of opportunities stemming from supply and demand sources, where demand is in particular related to demand concerning environment-related products and services. QSR NVivo software was used to build the coding database. The simple inter-rater agreement between the two raters was 86%, while Cohen’s k was .71, confirming that the coding was reliable (Fleiss, 1981). Remaining differences in coding were subsequently resolved by discussions between the coders involving the other authors as independent coders, until consensus was reached. Table 2 gives an overview of all the variables and the corresponding data sources. Table 3 illustrates the coding process by providing code definitions and exemplary quotes for each of the codes.
CONSTRAINTS AND OPPORTUNITY IDENTIFICATION
J PROD INNOV MANAG 2012;29(6):1000–1011
1005
Independent Variables
Table 2. Data Sources Variables
Data sources
Dependent variables Demand opportunities
Strategic conversation session with the venture’s top management team.
Supply opportunities Independent variables Financial constraints, demand constraints and product or service constraints Customer relational constraints Sales decreases Control variables Size, age and manufacturing dummy Team diversity
Strategic conversation session with the venture’s top management team. CEO interview CEO survey CEO survey Strategic conversation session with the venture’s top management team.
CEO, chief executive officer.
For the independent variables used in this study, we rely on data from three different sources: the CEO interview, the questionnaire completed by the CEO, and the strategic conversation sessions. The fact that these constraints were reported by the entrepreneurs themselves enabled us to measure resource constraints as perceived constraints. This is an important advantage, as the effect of the availability of resources depends on the perceived value to the beholder rather than the actual amount of resources at hand (Baker and Nelson, 2005; Hoegl et al., 2010; Penrose, 1959). From the CEO survey, the perceived sales decreases in percentage points relative to 100% in year zero are used, where the year zero is a firm-specific reference year. The reference year is identified by the respondent and thus functions as a reference point in the perception of the entrepreneur (Kahneman, 1992; Kahneman and Tversky, 1979). Customer relational constraints and demand con-
Table 3. Coding of Opportunity Sources and Constraint Types Definition
Exemplary quotes
Supply opportunities
Opportunities arising from changes in the value chain and the cooperation with other parties (Schumpeter, 1934).
Demand opportunities
Opportunities arising from changes in the market demand caused by changing customer preferences related to preventing degradation of the natural and/or communal environment and help sustain this environment (Dean and McMullen, 2007; Patzelt and Shepherd, 2011).
“There is a scarcity of suppliers which makes backward integration possible.” “Cooperation with some other good performing regional companies can boost our reputation.” “Corporate social responsibility is becoming increasingly important in the current economy, and we can anticipate this by using sustainable wood for our products.” “The society is becoming more and more conscious about the environment. As such, using environmental friendly products for treating and washing clothes is an opportunity for our company.”
Supply constraints Financial constraints
Product or service constraints Demand constraints Demand constraints in general
Customer relational constraints
Constraints related to the SME’s finances, such as financial capacity, liquid assets, and cash flow (Hoegl et al., 2008).
Constraints related to the SME’s end-product or service, such as product/service quality and product/ service knowledge. Constraints related to abrupt changes in market demand (as a consequence of economic downturn), shrinking markets, and reduced turnover.
Constraints related to relationships with clients, which are perceived as difficult or insufficient (Voss et al., 2008).
“[We have] a lack of finance because of a large debt caused by wrong investment choices.” “The management of outgoing and ingoing payments is not optimal, which has consequences for our cash flow.” “We have insufficient knowledge about the product.” “Our product does not completely fit the customer’s needs.” “The economic downturn has hit the construction sector, in which we are operating, quite hard. As a result, our turnover is lowered.” “We have lost a lot of demand as a result of the economic crisis. Our sales volume has decreased with 15%.” “The parents of the children observed that [the founder] was no longer providing the training, and they got disappointed. . . . This resulted in a substantial loss of customers.” “At this moment, all efforts are directed towards keeping existing clients.”
1006
J PROD INNOV MANAG 2012;29(6):1000–1011
E. VAN BURG ET AL.
Table 4. Descriptive Statistics
1. 2. 3. 4. 5. 6. 7. 8. 9. 10. 11.
Supply opportunities Demand opportunities Financial constraints Product/service constraints Customer relational constraints Demand constraints Sales decreases Firm age Firm size Manufacturing dummy Team diversity
Mean
Standard deviation
1
2
3
4
5
6
7
8
9
10
.62 .24 .12 .15 .08 .13 -8.57 25.77 1.84 .38 3.17
.67 .46 .33 .36 .28 .33 19.40 25.11 .68 .49 1.16
-.07 .19*** -.01 -.10 -.09 -.03 .08 .11 .02 -.03
-.09 -.14** -.03 .13** .14** .14** .17*** .24*** .16**
-.05 .12 .13** .03 -.05 -.08 .05 -.12
-.04 -.02 -.15** -.04 -.08 .01 .08
.07 -.10 -.11 -.08 -.05 -.07
.03 .04 .04 .07 .02
.18*** .18*** .09 .04
.40*** .23*** .25***
.19*** .21***
.14**
** p < .05; *** p < .01.
straints in general were coded in the reports of the intake interview and the strategic conversation sessions by two independent raters, using a detailed coding protocol similar to the one employed for coding the sources of opportunities. The reliability of the coding was confirmed by the inter-rater agreement of 84%, which corresponds to a Cohen’s k of .74.
Control Variables The following control variables are included. Studies show that domain expertise has a key role in the opportunity identification process (Gruber et al., 2008; Shane, 2000) and that team diversity influences creativity (Song and Parry, 1997). Therefore, we control for team diversity by counting the number of different functions (e.g., finance, marketing and sales, production, human resource management) that were represented during the strategic conversation session. Finally, age and size of the firm are included as control variables. To control for the industry of the firm, a dummy variable was used, indicating whether a firm was active in the manufacturing sector or not.
Results Analysis The correlations between all constraint types and opportunity sources are reported in Table 4. The dependent variables measure the number of identified opportunities representing an integer count without normal distributions and with restricted ranges (a maximum of five opportunities). Ordinary least squares regression becomes inappropriate because it relies on the assump-
tion of normality of the residuals (Hair, Tatham, Anderson, and Black, 1998). Consequently, negative binomial regressions were used to test the predicted relationships more accurately (Gardner, Mulvey, and Shaw, 1995; Gruber et al., 2008). The overview of the negative binomial regression results can be found in Tables 5 and 6. The significance of the model’s improvement after adding the new variables was assessed by the Chi-square statistic. The Chi-square statistic was calculated on the basis of two times the difference between the log likelihood of the two models, with degrees of freedom equal to the number of added variables (cf. Gruber et al., 2008). Models 1 to 2 and models 4 to 5 in Table 5, and models 2 to 3, 4 to 5, and 5 to 6 in Table 6 provide indeed a significant overall model improvement when adding a significant constraint.
Hypotheses Tests H1a predicts that entrepreneurs who experience supply constraints will identify an increased number of opportunities at the supply side. The results do clearly support this hypothesis, as a very significant positive relationship (p < .001) is found for the relationship between financial constraints and the identification of supply opportunities. In addition, supply constraints, in the form of product and service constraints, reduce the tendency to identify demand opportunities, thus supporting H1b. H2a argues that demand constraints lead to identifying fewer opportunities from supply sources. This hypothesis is supported: entrepreneurs experiencing customer relational constraints appear to identify fewer supply opportunities. Its counterpart, H2b, is also supported, as demand constraints and sales decreases show a positive relationship with demand opportunities.
-235.335
-.658 (.252) .002 (.003) .164 (.106) -.002 (.152) -.658 (.252)** 4.319/4 -233.345
.003 (.003) .193 (.103)† -.070 (.150) -.034 (.064) -.875 (.258)** 13.986/5*
.612 (.184)**
Model 2
-233.345
.003 (.003) .193 (.103)† -.071 (.150) -.035 (.064) -.876 (.259)** 13.932/6*
.613 (.184)** .011 (.224)
Model 3
-232.520
.002 (.003) .195 (.102)† -.084 (.149) -.040 (.063) -.811 (.257)** 17.925/6**
-.557 (.317)†
.658 (.179)***
Model 4
-125.692
.001 (.005) .432 (.201)* .899 (.254)*** .174 (.109) -3.335 (.542)*** 25.537/4*** -125.375
.001 (.005) .421 (.208)* .910 (.255)*** .157 (.108) -3.219 (.551)*** 26.133/5***
-.443 (.524)
Model 2
-123.234
.001 (.005) .415 (.197)* .944 (.246)*** .218 (.105) -3.345 (.550)*** 35.326/5***
-1.259 (.477)**
Model 3
-123.227
.001 (.005) .417 (.198)* .947 (.245)*** .219 (.106) -3.361 (.570)*** 35.182/6***
.070 (.472)
-1.257 (.477)**
Model 4
-122.737
.001 (.005) .399 (.196)* .946 (.244)*** .216 (.104) -3.371 (.554)*** 36.122/6***
.434 (.257)†
-1.260 (.492)*
-121.962
.000 (.005) .378 (.196)** .935 (.245)*** .219 (.106)* -3.246 (.555)*** 38.083/7***
.454 (.251)† .012 (.007)†
-1.201 (.489)*
Model 6
-232.204
.003 (.003) .213 (.103)* -.081 (.149) -.044 (.064) -.882 (.267)** 19.419/7**
-.005 (.003)
-.603 (.300)*
.667 (.178)***
Model 6
-121.364
-.000 (.005) .361 (.205)† .943 (.245)*** .194 (.105)† -3.082 (.572)*** 4.238/9***
.533 (.250)* .013 (.006)*
.068 (.468)
-.620 (.474) -1.194 (.482)*
Model 7
-231.920
.003 (.003) .217 (.104)* -.065 (.149) -.040 (.064) -.880 (.269)** 2.574/9*
-.265 (.239) -.005 (.004)
-.615 (.292)*
.715 (.195)*** -.056 (.221)
Model 7
J PROD INNOV MANAG 2012;29(6):1000–1011
The coefficients are exponentiated betas. Standard errors are in parentheses. † p ⱕ .10; ** p < .05; *** p < .01; **** p < .001
Supply constraints Financial constraints Product/service constraints Demand constraints Customer relational constraints Demand constraints Sales decreases Controls Firm age Firm size Manufacturing dummy Team diversity Constant Likelihood ratio chi-square/df Log likelihood
Model 1
Model 5
-232.269
.002 (.003) .199 (.102)† -.072 (.148) -.038 (.063) -.808 (.257)** 19.057/7**
-.255 (.240)
-.559 (.310)†
.709 (.193)***
Model 5
Table 6. Overview of the Negative Binomial Regression Results (n = 219) for Demand Opportunities
The coefficients are exponentiated betas. Standard errors are in parentheses. † p ⱕ .10; * p < .05; ** p < .01; *** p < .001.
Supply constraints Financial constraints Product/service constraints Demand constraints Customer relational constraints Demand constraints Sales decreases Controls Firm age Firm size Manufacturing dummy Team diversity Constant Likelihood ratio chi-square/df Log Likelihood
Model 1
Table 5. Overview of the Negative Binomial Regression Results (n = 219) for Supply Opportunities
CONSTRAINTS AND OPPORTUNITY IDENTIFICATION 1007
1008
J PROD INNOV MANAG 2012;29(6):1000–1011
Among the controls, the results confirm that team diversity sometimes has a positive effect on opportunity identification, namely on identifying demand opportunities (Hoegl et al., 2008; Song and Parry, 1997). The age of the firm may be interpreted as a proxy for the entrepreneurial experience of the founder-owner—which is quite typical for SMEs. In contrast with earlier studies that found a positive relationship between previous entrepreneurial experience and the identification of opportunities (Baron, 2004; Ucbasaran et al., 2009), the results do not show a relationship between age and the identification of opportunities from the two opportunity sources. In addition, the size of the company appears to have a positive effect on opportunity identification by entrepreneurs. The manufacturing context seems to increase the likelihood of identifying demand opportunities but has no effect on identifying supply opportunities.
Discussion and Conclusion This study joins recent efforts to explore more finegrained explanations of the effect of resource constraints (Hoegl et al., 2008; Mellahi and Wilkinson, 2010) and therefore related different types of constraints to different sources of opportunities. The results show that the entrepreneur’s creativity unleashed by the perceived constraints addresses the constrained domain itself rather than circumventing the constraints by focusing on opportunities outside the constrained domain. The key contribution of this study to the literature on resource constraints is that resource constraints direct the attention of entrepreneurs toward opportunities related to the constraints they are experiencing. This effect could only be identified by relating different types of constraints to different sources of opportunities. As a consequence, a type-of-resources explanation (Mellahi and Wilkinson, 2010) does not offer a complete explanation of the effect of resource constraints on opportunity identification. Instead, we find that one type of resource constraints can have both negative and positive effects on opportunity identification (see the rows in Tables 5 and 6). The positive relationships between constraints and the number of identified opportunities are in line with earlier studies, which observed that constraints can spur creativity (Goldenberg et al., 2001; Moreau and Dahl, 2005) and that entrepreneurs see new opportunities when they experience resource constraints (Baker and Nelson, 2005; Bradley et al., 2011). However, as multiple studies already showed (e.g., Nohria and Gulati, 1996; Voss et al., 2008), this study also demonstrates that constraints can have negative effects on identifying
E. VAN BURG ET AL.
opportunities. For instance, in our results, customer relational constraints have a negative effect on identifying opportunities. Similarly, the results show that only distinguishing between different sources of opportunities does not provide a complete explanation for the effect of resource constraints on opportunity identification. The results show that within one particular source of opportunities, constraints both increase and decrease the likelihood of identifying opportunities (see the columns in Tables 5 and 6). Thus, only the combination of particular resource types with different opportunity sources gives a complete picture of the relationship between resource constraints and identified opportunities. The effect of the relatedness of resource types and opportunities sources opens a new area of research on the effects of resource constraints. Existing studies have argued that entrepreneurs are attracted to opportunities that are in line with their available resources (Haynie et al., 2009; Sarasvathy, 2001; see also Audia and Goncalo, 2007; March, 1991). Our study presents an important additional insight: entrepreneurs are not only attracted to opportunities that are in line with their available resources but also to opportunities that are in line with their resource deficiencies. Entrepreneurs appear to identify opportunities in a particular domain precisely because they perceive constraints in that domain (see Dahl and Moreau, 2007; Gibbert and Scranton, 2009; Moreau and Dahl, 2005). This is an interesting specification of the bounded creativity approach (see Hoegl et al., 2008): the more constrained the entrepreneurs were, the more they tended to stay inside the “problem box.” In our results, the relatedness argument explains all relationships between resource constraints and the number of identified opportunities, indicating that this explanation is indeed a powerful one. Thus, the relatedness argument may also explain many mixed findings regarding the relationship between resource constraints and innovation. The demand opportunities in this study were related to opportunities that appear currently very interesting for entrepreneurs, namely sustainable opportunities. Societal concerns regarding climate change and degrading biodiversity create opportunities in the market that can be pursued by entrepreneurs (Patzelt and Shepherd, 2011; Shepherd and Patzelt, 2011). Moreover, entrepreneurs seem to become more interested in reducing environmental problems and making a positive contribution to the community (Dean and McMullen, 2007; Marcus and Fremeth, 2009). Recently, theoretical explanations for sustainable entrepreneurship have been proposed, but
CONSTRAINTS AND OPPORTUNITY IDENTIFICATION
empirical work in this area is still scarce. This study contributes to this domain by showing how the resource constraints of entrepreneurs might impact their propensity to identify demand opportunities related to environmental sustainability concerns.
Implications for Practice For practicing entrepreneurs, these results imply that constraints can have a positive role in SMEs. Awareness of the fact that perceived difficulties spur creativity can help to create positive energy to overcome the existing constraints by identifying new opportunities. Proverbially, entrepreneurs should “never waste a good crisis” to move away from mental “paths of least resistance” (Moreau and Dahl, 2005), stimulating them to identify innovative new products and services. This study observes that entrepreneurs have the tendency to identify opportunities that are related to the constrained domains. Awareness of this mechanism can prevent them from missing out on promising opportunities that are unrelated to the perceived constraints.
Limitations and Future Research Directions This study is not without limitations. First, the study design did not allow for controlling the entrepreneurs’ engagement in experiential learning processes (Corbett, 2005; Lumpkin and Lichtenstein, 2005). As these learning processes are quite essential, more in-depth studies of the opportunity identification process under the condition of different constraints could rule out the effect of this antecedent as well. Second, part of the data on constraints was derived from the same data source (namely strategic sessions) as the dependent variables, meaning that the results may be subject to common method bias. We aimed to reduce this potential bias by using constraints that were derived from different data sources, such as the intake interview with the SME’s CEO prior to the strategic session and the CEO survey. Thus, as a remedy for common method bias, temporal separation was applied, and multiple data sources were used for the independent variables (Podsakoff et al., 2003; Podsakoff and Organ, 1986). Moreover, a potential common method bias in the data would lead to more significant relationships between constraints and opportunities from the same data source. Because this is clearly not the case, we can conclude that common method variance is not substantial in our dataset. In sum, this study explores relationships between particular types of resource constrains and the identifi-
J PROD INNOV MANAG 2012;29(6):1000–1011
1009
cation of entrepreneurial opportunities from different sources. The results show that this way of approaching the relationship between constraints and opportunity identification is promising, as this study highlights that resource constraints direct the entrepreneur’s attention in identifying opportunities. Rather than circumventing the constraints, entrepreneurs appear to see new opportunities within the constrained area.
References Agarwal, R., M. B. Sarkar, and R. Echambadi. 2002. The conditioning effect of time on firm survival: An industry life cycle approach. Academy of Management Journal 45 (5): 971–94. Audia, P. G., and J. A. Goncalo. 2007. Past success and creativity over time: A study of inventors in the hard disk drive industry. Management Science 53 (1): 1–15. Baker, T. 2007. Resources in play: Bricolage in the toy store(y). Journal of Business Venturing 22 (5): 694–711. Baker, T., and R. E. Nelson. 2005. Creating something from nothing: Resource construction through entrepreneurial bricolage. Administrative Science Quarterly 50 (3): 329–66. Baron, R. A. 2004. The cognitive perspective: A valuable tool for answering entrepreneurship’s basic “why” questions. Journal of Business Venturing 19 (2): 221–29. Bourgeois, L. J. 1981. On the measurement of organizational slack. Academy of Management Review 6 (1): 29–39. Bradley, S. W., J. Wiklund, and D. A. Shepherd. 2011. Swinging a doubleedged sword: The effect of slack on entrepreneurial management and growth. Journal of Business Venturing 26 (5): 537–54. Carter, R. B., and H. Van Auken. 2005. Bootstrap financing and owners’ perceptions of their business constraints and opportunities. Entrepreneurship and Regional Development 17 (2): 129–44. Christensen, C. M., and J. Bower. 1996. Customer power, strategic investment, and the failure of leading firms. Strategic Management Journal 17 (3): 197–218. Cohen, B., and M. I. Winn. 2007. Market imperfections, opportunity and sustainable entrepreneurship. Journal of Business Venturing 22 (1): 29–49. Corbett, A. C. 2005. Experiential learning within the process of opportunity identification and exploitation. Entrepreneurship: Theory and Practice 29 (4): 473–91. Dahl, D. W., and C. P. Moreau. 2007. Thinking inside the box: Why consumers enjoy constrained creative experiences. Journal of Marketing Research 44 (3): 357–69. Dean, T. J., and J. S. McMullen. 2007. Toward a theory of sustainable entrepreneurship: Reducing environmental degradation through entrepreneurial Action. Journal of Business Venturing 22 (1): 50–76. Debruyne, M., R. T. Frambach, and R. Moenaert. 2010. Using the weapons you have: The role of resources and competitor orientation as enablers and inhibitors of competitive reaction to new products. Journal of Product Innovation Management 27 (2): 161–78. De Carolis, D. M., Y. Yang, D. L. Deeds, and E. Nelling. 2009. Weathering the storm: The benefit of resources to high-technology ventures navigating adverse events. Strategic Entrepreneurship Journal 3 (2): 147– 60. De Jong, J. P. J., and P. A. M. Vermeulen. 2006. Determinants of product innovation in small firms. International Small Business Journal 24 (6): 587–609. Díaz-Díaz, N. L., I. Aguiar-Díaz, and P. De Saá-Pérez. 2008. The effect of technological knowledge assets on performance: The innovative choice in Spanish firms. Research Policy 37 (9): 1515–29.
1010
J PROD INNOV MANAG 2012;29(6):1000–1011
Drucker, P. 1985. Innovation and entrepreneurship. New York: Harper & Row. Eckhardt, J. T., and S. Shane. 2003. Opportunities and entrepreneurship. Journal of Management 29 (3): 333–49. Eisenhardt, K. M., and C. B. Schoonhoven. 1996. Resource-based view of strategic alliance formation: Strategic and social effects in entrepreneurial firms. Organization Science 7 (2): 136–50. European Commission. 2003. The new SME definition: User guide and model declaration. Official Journal of the European Union L 124: 36–41. Finke, R. A., T. B. Ward, and S. M. Smith. 1992. Creative cognition: Theory, research, and applications. Cambridge, MA: MIT Press.
E. VAN BURG ET AL.
Mellahi, K., and A. Wilkinson. 2010. A study of the association between level of slack reduction following downsizing and innovation output. Journal of Management Studies 47 (3): 483–508. Miles, M. B., and A. M. Huberman. 1994. Qualitative data analysis: An expanded sourcebook. Thousand Oaks, CA: Sage Publications. Mishina, Y., T. G. Pollock, and J. F. Porac. 2004. Are more resources always better for growth? Resource stickiness in market and product expansion. Strategic Management Journal 25 (12): 1179–97. Moreau, C. P., and D. W. Dahl. 2005. Designing the solution: The impact of constraints on consumers’ creativity. Journal of Consumer Research 32 (1): 13–22.
Fleiss, J. L. 1981. Statistical methods for rates and proportions, 2nd edn. New York: Wiley.
Mosakowski, E. 2002. Overcoming resource disadvantages in entrepreneurial firms: When less is more. In Strategic entrepreneurship: Creating a new mindset, ed. M. A. Hitt, R. D. Ireland, S. M. Camp, and D. L. Sexton, 106–26. Oxford: Wiley-Blackwell.
Gardner, W., E. P. Mulvey, and E. C. Shaw. 1995. Regression analyses of counts and rates: Poisson, overdispersed Poisson, and negative binomial models. Psychological Bulletin 118 (3): 392–404.
Musso, P., and S. Schiavo. 2008. The impact of financial constraints on firm survival and growth. Journal of Evolutionary Economics 18 (2): 135– 49.
Garmaise, M. J. 2008. Production in entrepreneurial firms: The effects of financial constraints on labor and capital. Review of Financial Studies 21 (2): 543–77.
Nohria, N., and R. Gulati. 1996. Is slack good or bad for innovation? Academy of Management Journal 39 (5): 1245–64.
George, G. 2005. Slack resources and the performance of privately held firms. Academy of Management Journal 48 (4): 661–76.
Paladino, A. 2007. Investigating the drivers of innovation and new product success: A comparison of strategic orientations. Journal of Product Innovation Management 24 (6): 534–53.
Gibbert, M., and P. Scranton. 2009. Constraints as sources of radical innovation? Insights from jet propulsion development. Management and Organizational History 4 (4): 385–99.
Patzelt, H., and D. A. Shepherd. 2011. Recognizing opportunities for sustainable development. Entrepreneurship Theory and Practice 35 (4): 631–52.
Goldenberg, J., D. R. Lehmann, and D. Mazursky. 2001. The idea itself and the circumstances of its emergence as predictors of new product success. Management Science 47 (1): 69–84.
Penrose, E. G. 1959. The theory of the growth of the firm. New York: Wiley.
Gruber, M., I. C. MacMillan, and J. D. Thompson. 2008. Look before you leap: Market opportunity identification in emerging technology firms. Management Science 54 (9): 1652–66. Hair, J., R. Tatham, R. Anderson, and W. Black. 1998. Multivariate data analysis. Upper Saddle River, NJ: Prentice Hall. Haynie, J. M., D. A. Shepherd, and J. S. McMullen. 2009. An opportunity for me? The role of resources in opportunity evaluation decisions. Journal of Management Studies 46 (3): 337–61. Hoegl, M., M. Gibbert, and D. Mazursky. 2008. Financial constraints in innovation projects: When is less more? Research Policy 37 (8): 1382– 91. Hoegl, M., M. Weiss, and M. Gibbert. 2010. The influence of material resources on innovation project outcomes. In 5th IEEE International Conference on Management of Innovation and Technology, ICMIT2010, 450–54. Hvide, H. K., and J. Møen. 2010. Lean and hungry or fat and content? Entrepreneurs’ wealth and start-up performance. Management Science 56 (8): 1242–58. Kahneman, D. 1992. Reference points, anchors, norms, and mixed feelings. Organizational Behavior and Human Decision Processes 51 (2): 296– 312. Kahneman, D., and A. Tversky. 1979. Prospect theory: An analysis of decision under risk. Econometrica 47 (2): 263–91. Katila, R., and S. Shane. 2005. When does lack of resources make new firms innovative? Academy of Management Journal 48 (5): 814–29. Locke, K. D. 2001. Grounded theory in management research. London: Sage Publications Ltd. Lumpkin, G. T., and B. B. Lichtenstein. 2005. The role of organizational learning in the opportunity-recognition process. Entrepreneurship: Theory and Practice 29 (4): 451–72. March, J. G. 1991. Exploration and exploitation in organizational learning. Organization Science 2 (1): 71–87. Marcus, A. A., and A. R. Fremeth. 2009. Green management matters regardless. Academy of Management Perspectives 23 (3): 17–26.
Podsakoff, P. M., S. B. MacKenzie, J.-Y. Lee, and N. P. Podsakoff. 2003. Common method biases in behavioral research: A critical review of the literature and recommended remedies. Journal of Applied Psychology 88 (5): 879–903. Podsakoff, P. M., and D. W. Organ. 1986. Self-reports in organizational research: Problems and prospects. Journal of Management 12 (4): 531–44. Rao, H., and R. Drazin. 2002. Overcoming resource constraints on product innovation by recruiting talent from rivals: A study of the mutual fund industry, 1986–94. Academy of Management Journal 45 (3): 491–507. Renko, M., P. D. Reynolds, and A. L. Carsrud. 2010. Financial slack resources, firm birth, and early growth. Paper presented at the 2010 Academy of Management Annual Meeting, Montreal. Sarasvathy, S. D. 2001. Causation and effectuation: Toward a theoretical shift from economic inevitability to entrepreneurial contingency. Academy of Management Review 26 (2): 243–63. Schumpeter, J. 1934. The theory of economic development. Oxford: Oxford University Press. Shane, S. 2000. Prior knowledge and the discovery of entrepreneurial opportunities. Organization Science 11 (4): 448–69. Shane, S. 2003. A general theory of entrepreneurship: The individualopportunity nexus. Cheltenham: Edward Elgar. Shane, S., and S. Venkataraman. 2000. The promise of entrepreneurship as a field of research. Academy of Management Review 25 (1): 217–26. Shepherd, D. A., and D. R. DeTienne. 2005. Prior knowledge, potential financial reward, and opportunity identification. Entrepreneurship Theory and Practice 29 (1): 91–112. Shepherd, D. A., and H. Patzelt. 2011. The new field of sustainable entrepreneurship: Studying entrepreneurial action linking “what is to be sustained” with “what is to be developed.” Entrepreneurship Theory and Practice 35 (1): 137–63. Shepherd, D. A., A. L. Zacharakis, and R. A. Baron. 2003. VCs’ decision processes: Evidence suggesting more experience may not always be better. Journal of Business Venturing 18 (3): 381–401.
CONSTRAINTS AND OPPORTUNITY IDENTIFICATION
Short, J. C., D. J. Ketchen, C. L. Shook, and R. D. Ireland. 2010. The concept of “opportunity” in entrepreneurship research: Past accomplishments and future challenges. Journal of Management 36 (1): 40–65.
J PROD INNOV MANAG 2012;29(6):1000–1011
1011
Sirdeshmukh, D., J. Singh, and B. Sabol. 2002. Consumer trust, value, and loyalty in relational exchanges. Journal of Marketing 66 (1): 15–37.
Stevenson, H. H., and J. C. Jarillo. 1990. A paradigm of entrepreneurship: Entrepreneurial management. Strategic Management Journal 11: 17–27. Ucbasaran, D., P. Westhead, and M. Wright. 2009. The extent and nature of opportunity identification by experienced entrepreneurs. Journal of Business Venturing 24 (2): 99–115.
Song, M., K. Podoynitsyna, H. van der Bij, and J. I. M. Halman. 2008. Success factors in new ventures: A meta-analysis. Journal of Product Innovation Management 25 (1): 7–27.
Voss, G. B., D. Sirdeshmukh, and Z. G. Voss. 2008. The effects of slack resources and environmental threat on product exploration and exploitation. Academy of Management Journal 51 (1): 147–64.
Song, X. M., and M. E. Parry. 1997. A cross-national comparative study of new product development processes: Japan and the United States. Journal of Marketing 61 (2): 1–18.
Ward, T. B. 2004. Cognition, creativity, and entrepreneurship. Journal of Business Venturing 19 (2): 173–88.
Stevenson, H. H., and D. E. Gumpert. 1985. The heart of entrepreneurship. Harvard Business Review 64: 85–94.
Zahra, S. A., E. Gedajlovic, D. O. Neubaum, and J. M. Shulman. 2009. A typology of social entrepreneurs: Motives, search processes and ethical challenges. Journal of Business Venturing 24 (5): 519–32.