How to Monitor and Control Resource Usage in Mobile Agent Systems Paolo Bellavista, Antonio Corradi DEIS - University of Bologna {pbellavista, acorradi}@deis.unibo.it
Abstract The Mobile Agent technology has already shown its advantages, but at the same time has already remarked new problems currently limiting its diffusion in commercial environments. A key issue is to control the operations that foreign mobile agents are authorized to perform on hosting execution environments. It is necessary not only to rule the MA access to resources but also to control resource usage of admitted agents at execution time, for instance to protect against possible denial-of-service attacks. The paper presents a solution framework for the on-line monitoring and control of Java-based MA platforms. In particular, it describes the design and implementation of MAPI, an on-line monitoring component that we have integrated within the SOMA system. The paper shows how to use MAPI as the building block of a distributed monitoring tool that gives application- and kernel-level information about the state of mobile agents and their resource usage, thus enabling the enforcement of management policies on MA resource consumption.
1.
Introduction
While the Mobile Agent (MA) technology has demonstrated its suitability in many application domains and the number of MA platforms is increasing, there are still a limited number of examples of medium- and largescale MA-based "industrial" services. The main motivation stems from the fact that software companies still do not trust completely the MA technology because of potential problems introduced by hosting the execution of foreign active entities. The research has obtained significant results in the MA security area, both in protecting hosting sites from running agents and in defending agent code and state from their current execution environments [1, 2]. Most MA platforms exploit traditional security techniques to admit/deny the MA access to currently local resources. However, these techniques are not targeted to protect
Cesare Stefanelli Dip. Ingegneria - University of Ferrara
[email protected]
against denial-of-service attacks caused by mobile agents that engage resources making them unavailable for other activities. The same applies to the techniques for keeping track of resources in the sense of quantitatively associating them with users for billability sake: this aspect is mostly disregarded by MA frameworks that tend not to support tools for the accounting of MA resource consumption to bill agent responsible users. The confidence in MA systems can only be built by embodying components to support measurement, monitoring and eventual limitation of resource usage of mobile agents while they execute. For instance, even if several agents of the same responsible user are authorized to execute on one host, the local administrator may want to give a maximum percentage threshold to the total CPU time they can engage, in order to preserve the CPU availability (in a significant percentage) to other local activities and services. Similarly, once authenticated, an agent may obtain the permission to open network connections toward some specified hosts, but its network usage should be eventually accounted for the generated amount of traffic. We claim that agent on-line monitoring is a critical factor for the acceptance and diffusion of the MA technology and for the enlargement of the core of MAbased industrial applications. The availability of an online monitoring component should be considered crucial for any MA platform, in order to observe the behavior of mobile agents at runtime and to permit corrective management operations that enforce the required policies for MA resource usage. Most recent MA platforms adopt Java as the implementation language because Java presents obvious advantages in the support of mobile agents (dynamic class loading, serialization, security mechanisms and policies, directly provided as basic facilities of the language environment). However, the Java Virtual Machine (JVM) abstraction tends to hide platform-dependent information and seems an obstacle when dealing with on-line monitoring. Some extensions of the Java technology can help in overcoming this transparency: the JVM Profiler Interface (JVMPI) [3] exports several JVM internal events
for debugging and monitoring purpose, while the Java Native Interface (JNI) [4] permits to integrate Java programs with platform-dependent executable code. In addition, the Java framework has already faced the necessity of integrating with components and tools compliant with widespread Internet protocols, such as SNMP [5], and has shown its suitability to encapsulate specific aspects of legacy components [6]. The paper describes the Monitoring Application Programming Interface (MAPI) and its implementation to build a monitoring component for Java-based MA environments. In particular, MAPI has been integrated in the Secure Open Mobile Agent (SOMA)* platform [7, 8]. MAPI exploits JVMPI to collect several application-level events produced by Java applications (e.g., object allocation and method invocation). In addition, it employs the JNI technology to make possible the integration with platform-dependent native monitoring mechanisms, which we have currently implemented for Windows NT, Solaris and Linux. MAPI encapsulates also legacy SNMP components and filters their information to yield aggregated monitoring indicators, thus limiting the overhead due to long sequences of SNMP requests/ responses. SOMA exploits MAPI to obtain monitoring information about MA resource usage, both local and remote. If MAPI is responsible for local indicators, SOMA has visibility of the global state of distributed resources by using ad-hoc mobile monitoring agents. They are in charge of collecting, filtering and transporting requested data to build a distributed framework that employs monitoring information as the knowledge base for the enforcement of suitable management policies. Monitoring indicators are exploited to control, and possibly to deny, the operations of specific mobile agents on available resources with fine granularity. For instance, in case of locally congested situation, SOMA administrators can dynamically limit the number of operations available for authorized agents of remote users, up to their complete block. The paper finally reports measurements of the overhead introduced by MAPI monitoring over the different supported operating systems. The overhead depends mainly on the granularity of monitoring indicators and on the time interval for their update, and can be tuned dynamically by SOMA administrators in response to service/system runtime conditions. The presented performance shows the feasibility of the MAPI approach that does not impose any modification to the standard JVM. This should be considered a basic requirement for any MA platform that aims at working *
SOMA is available at: http://lia.deis.unibo.it/Research/SOMA/
over global and open distributed environments such as the Internet.
2.
Technologies for On-line Monitoring of Java-based Mobile Agents
The MA programming paradigm is a promising technology for the design and implementation of applications in the Internet scenario. However, mobile agents require establishing a trusted relationship between involved parties, in order to protect both agents and execution environments. For instance, it is necessary to control the amount of resources used by mobile agents at runtime in order to protect agent execution environments against attacks such as denial of service, a major threat to the availability of MA platforms. This scenario stresses the importance of on-line measurement and control of resource consumption in MA systems. As most current MA platforms are implemented in Java, we have decided to classify resources in JVM resources and Operating System (OS) ones. We define the formers as the resources supported by the JVM and visible to a Java-based running agent. The set of JVM resources consists of all local and remote resources accessible as Java objects. The latter are the execution resources of the hosting operating system and are at a lower abstraction layer than the former. As an example, authorized Javabased mobile agents use CPU and in/out bandwidth of their current execution environment, even if JVM hides the visibility of their usage, e.g., the effective CPU time consumed by a specific agent. Java-based MA platforms can exploit Java mechanisms to control the access to JVM resources. In particular, they usually take advantage of the SecurityManager, either in its basic version or in a proprietary specialization, that is part of the Java programming environment. The SecurityManager controls the JVM resource access by defining suitable permission classes and security policies. Nevertheless, it can only control Java code access permissions, while mobile agents also require other mechanisms and tools, able to dynamically ascertain the quality of usage in the access to both JVM and OS resources. Two solution guidelines are viable. The first is to build ad-hoc resource managers for any type/instance of resource potentially accessible by mobile agents, and to force agents to work on resources only via these intermediary entities. In this case, agents have no direct visibility and should always use resource manager mediators. This solution requires writing at least one manager for each type of recognized resource, and also imposes the overhead of a proxy for any access. The second possibility is to organize an on-line monitoring service that inspects the state of both JVM and
OS resources during agent execution. This is possible by exploiting new Java technologies (JVMPI and JNI) that extend the visibility available within the JVM, and by integrating with external and standard SNMP monitoring components, either Java-based or not. JVMPI can help in monitoring and controlling the consumption of JVM resources. JVMPI is an experimental interface featured by the Java 2 platform and mainly designed to help developers in debugging Java applications. JVMPI is a two-way API between the JVM and a dedicated profiler agent. In one direction, the JVM notifies several internal events (e.g., Java thread state change, class loading operations, object allocation/ deallocation) to the profiler agent. In the other direction, the profiler agent can enable/disable the notification of specific types of events and can perform some limited management actions on the JVM (e.g., suspend/resume Java threads and enable/disable/force the garbage collector execution). JNI permits to achieve visibility of OS resources by providing a standard way to invoke platform-dependent code from the JVM. JNI is a two-way API interface that permits Java threads to invoke native methods, i.e., platform-specific functions typically written in C/C++, usually available as Windows NT Dynamic Link Libraries (DLL) and as Shared Object (SO) libraries under Solaris and Linux. In one direction, any Java program can invoke a native method, simply by declaring the method with the keyword native and with no body. After the binding obtained by calling the System.loadLibrary() method, the JVM uses JNI to call the requested function in the native library during the execution. JNI specifies the mode of method invocation: for instance, it rules how to perform parameter marshalling/unmarshalling between the Java invoking thread and the invoked native method. In the other direction - from the native library to call JVM entities - JNI provides native methods with callbacks to the Java environment and to the invoking Java object, which can access and modify object values, call Java methods, and raise Java exceptions. SNMP is currently the most diffused monitoring solution in the network management domain. It is a specialized request/reply protocol between two types of possibly remote entities, SNMP managers and SNMP agents. The SNMP manager uses this protocol to request values of state indicators to one of its SNMP agents. SNMP agents play the role of servers that reply to manager requests by extracting the indicator values from their local MIBs. The MIB specifies the organization and formats of the maintained state indicators. Recent research work shows an increasing trend in exploiting Java as a basic technology in the systems management area [6]. The main motivation is the capacity of Java of supporting rapid prototyping of SNMP-compliant wrappers and
integrators (the same does Java with other recognized management technologies, such as CORBA and CMIP). In addition, some proposals start to choose Java as the platform both for implementing new SNMP components and for putting together legacy management sub-systems and solutions [9, 10].
3.
Local Monitoring and Control of SOMA Mobile Agents
The Secure and Open Mobile Agents (SOMA) is a programming framework designed and implemented to support the deployment of services in the global, open and untrusted Internet environment [7]. It exhibits a modular organization in a set of layered middleware services and is implemented in Java to achieve portability (see Figure 1). SOMA provides services for agent migration, naming, communication, security and interoperability. In addition, SOMA agents allow the dynamic installation and the extension of infrastructure/service components by permitting code and state migration during service provision. To achieve the scalability that is crucial in the global Internet scenario, SOMA offers locality abstractions to describe any kind of interconnected system. Any node hosts at least one place for agent execution; several places are grouped into domain abstractions that correspond to network localities. In each domain, a default place is in charge of inter-domain routing functionality and integration with legacy components via CORBA. The mobile place is the locality abstraction used to support mobile devices: it enhances the normal place with specific features for automatic reconfiguration when changing domain of attachment [11]. SOMA-based Applications
SOMA Middleware Services
Multimedia Distribution
Information Retrieval
Security
Interoperability
Systems Management
MAPI
Migration
Naming
Communic.
Control/ Management Monitoring
Java Virtual Machine Heterogeneous Distributed System
Figure 1. The modular service architecture of the SOMA platform While other papers [7, 8] give a general presentation of the SOMA platform and of its middleware services, here we focus on the specific solutions adopted for the monitoring and control of SOMA agents.
We claim that the diffusion of the MA technology in industrial and commercial applications is still slowed down by the limited confidence that organizations are willing to concede to MA execution. This makes crucial not only to have flexible mechanisms and tools to admit/deny agent access to resources, such as the rolebased policies expressed in Ponder [12], but also to dynamically observe and control of the amount of resources consumed by MA execution. In other words, MA platforms should provide functions for the on-line monitoring and management of mobile agents to enable system administrators to control the operations of either malicious or badly programmed admitted agents. These are the reasons for the design and the implementation of the on-line MAPI component and for its integration within the SOMA programming framework. MAPI inspects the state of local (both JVM and OS) resources and permits to operate simple management actions on SOMA agents. MAPI monitors the state of resources used by agents at any single host, and exploits the SOMA platform itself to coordinate different local monitoring entities (see Section 5). This organization produces a global vision of the monitored distributed infrastructure and performs the online management of SOMA-based services. Figure 2 shows the MAPI architecture that provides a uniform monitoring interface independent of platform heterogeneity. It is implemented by the ResourceManager class that integrates three different components: the MAPI Profiler Agent, the MAPI SNMP Agent, and the MAPI*ResManager.
Monitoring Application Programming Interface (MAPI)
Resource Manager class MAPI SNMP Agent class
MAPI NT MAPI SVR4 MAPI Linux ResManager class ResManager class ResManager class
MAPI Profiler Agent JVM Profiler Interface
Java Virtual Machine Java Native Interface MAPI WindowsRM DLL
SNMPv3 agent
Windows NT OS
MAPI platform-independent components
MAPI SolarisRM SO
SNMPv3 agent
Solaris OS
MAPI platform-dependent components
MAPI LinuxRM SO
SNMPv3 agent
SuSE Linux OS
Off-the-shelf components
Figure 2. Architecture of the Java-based MAPI The MAPI Profiler Agent is able to gather monitoring information about JVM resources of the monitored target. It not only collects JVMPI events but also filters and
processes them on-line, to offer concise monitoring indicators during service execution. The JVMPI-based monitoring functions are immediately portable on any host that runs the JVM version 2. According to the SNMP terminology, the MAPI SNMP Agent acts as an SNMP manager that interrogates the standard SNMP agent available on a target to obtain monitoring data about local OS resources. The MAPI SNMP Agent not only provides a uniform Java interface by wrapping possibly non-Java SNMP agents, but also implements several local optimizations of the SNMP protocol, as described in the following section. In addition, it simplifies the configuration phase of the security parameters needed in SNMPv3, by integrating with the SOMA distributed security infrastructure [7]. In addition, the ResourceManager can exploit the MAPI*ResManager classes to achieve visibility of OS resources by integrating with platform-dependent monitoring functions via JNI. These functions are implemented as native libraries with the same interfaces for different platforms (MAPI WindowsRM DLL on Microsoft Windows NT 4.0, MAPI SolarisRM SO on SUN Solaris 7, and MAPI LinuxRM SO on SuSE Linux 6.2). ResourceManager is in charge of loading at run-time the correct native library for the current monitored target, to provide platform independence. In this way, MAPI*ResManager permits to obtain OS resource monitoring data also when SNMP agents are not available on the target host. Figure 3 shows the MAPI set of methods that provide monitoring parameters summarizing the current state of the monitored target, and in particular of the SOMA agents running on it. Administrators of SOMA-based services (or even autonomous software-based service managers) can use MAPI to obtain management information at runtime to adapt service provision. In a runtime scenario, the overhead is obviously critical, and monitoring results should be promptly and immediately available to managers (see Section 6). For this reason, MAPI can tune its intrusion to service-specific time constraints: all MAPI methods have a msec invocation parameter that indicates the time interval for refreshing monitoring indicators. This time interval is propagated to all MAPI components to update the statistics of collected JVMPI events, to interrogate SNMP agents, and to invoke native monitoring libraries. MAPI methods return either an object or an array of ProcessInfo, objects of the three classes NetworkInfo, and FileSystemInfo shown in Figure 3. The ProcessInfo object maintains all data related to the current pid process. Monitored data include the CPU usage (percentage and total time) for any specified process, its allocated memory (physical and virtual), and miscellaneous information on its composing threads. In
addition, for JVM threads, MAPI maintains the reference to the Java thread object, its lifetime, and the number of loaded classes, used monitors, allocated objects, invoked methods, network and file system operations. For nonJava threads, MAPI provides the thread identifier and the percentage/effective time of CPU usage.
Package res; public class ResourceManager{ String getOS(); // current operating system ProcessInfo[] getProcessInfo(long msec); ProcessInfo getProcessInfo(int pid,long msec); ThreadInfo getThreadInfo(Thread thread,long msec); NetworkInfo getNetworkInfo(long msec); FileSystemInfo[] getFSInfo(long msec); FileSystemInfo getFSInfo(int pid,long msec); }
Public class ProcessInfo{ int pid; // Process ID String name; // Name Float cpu; // %CPU long time; // CPU time long physMem; // Physical memory long virtMem; // Virtual memory long totalMem; // Total phys. memory ThreadInfo[] thread; // Thread info }
public class JavaThreadInfo extends ThreadInfo{ Thread thread; // thread object Int classLoad; // # loaded classes int monContended; // # monitors int objAlloc; // # objects int objLiveAlloc; // # live objects int objSize; // heap allocation int objLiveSize; // live heap alloc. Int methodCall; // # invoked methods int tcpRead; // # TCP read ops int tcpWrite; // # TCP write ops int udpReceive; // # UDP read ops int udpSend; // # UDP write ops int FSRead; // # file read ops int FSWrite; // # file write ops long time; // life time }
public class ThreadInfo{ int tid; // thread id float cpu; // %CPU long time; // CPU time } public class NetworkInfo{ int udpPackIn; // # UDP packets in int udpPackOut; // # UDP packets out int udpPackInErr; // % UDP in errors int udpPackOutErr;// % UDP out errors int tcpConn; // # TCP connections int tcpSegIn; // # TCP segments in int tcpSegOut; // # TCP segments out int ipPackIn; // # IP packets in int ipPackOut; // # IP packets out int ipPackInErr; // % IP in errors int ipPackOutErr; // % IP out errors } public class FileSystemInfo{ Int pid; // process ID String name; // process Name long available; // total space avail. float available%; // as above, perc. FileInfo[] openFiles; } public class FileInfo{ String absFileName; // abs. file name long time; // time from opening int modalities; // 0 only reading, // 1 only writing, 2 both }
Figure 3. The ResourceManager class interface The NetworkInfo class reports aggregated monitoring data about the usage of the communication infrastructure on the target host. Monitored data include the total number of sent/received UDP/IP packets, of TCP connections and sent/received segments, the percentage of UDP/IP packets received with errors, and the percentage of discarded UDP/IP output packets. These parameters permit to give an overall evaluation of the host traffic conditions and to identify congestion situations. Finally, the FileSystemInfo class maintains general information about the file system of the target (disk free space and its percentage on total size) and detailed data about currently opened files. In particular, for any active process and for any file opened in the current session, the class returns the opening time and its opening mode (read/write/both/locked).
4.
The MAPI Implementation
A basic guideline in the implementation of the MAPI tool is not to modify the standard JVM. This choice,
together with the possibility to monitor mobile agents without intervening on either their source code or their executables, is fundamental to adopt MAPI for the on-line distributed monitoring of MA-based services over the open Internet infrastructure. MAPI has required the design and implementation of several ad hoc modules: 1) the MAPI Profiler Agent for dynamically configurable on-line monitoring of the JVM state; 2) the MAPI SNMP Agent to obtain monitoring data from SNMP agents in execution on the targets; 3) the MAPI*ResManager and its native libraries (MAPI Windows/Solaris/Linux RM DLL/SO) for uniform data acquisition via heterogeneous platform-dependent monitoring mechanisms.
4.1. The MAPI Profiler Agent The MAPI Profiler Agent permits to configure dynamically the JVMPI-based event notification and to provide the ResourceManager class with concise monitoring indicators obtained by filtering the history of previous performance. In a more detailed view, the MAPI Profiler Agent gives the possibility to change the set of notifiable events with no suspension of the monitoring execution, by implementing methods to enable/disable the event notification related to object allocation/deallocation, method invocation/exit, and lock/unlock of Java monitors. It keeps and updates statistics of the monitored events to provide immediately readable indicators with no need to maintain huge logs of monitoring data. For instance, the profiler traces only the size of the total memory allocated to the threads of a SOMA agent and does not log their full data due to the execution of any system call for memory allocation. In addition, the refresh interval of monitoring indicators can change dynamically to tune the MAPI intrusion depending on service-specific constraints and run-time conditions (see Section 6). Figure 4 sketches a piece of the MAPI Profiler Agent code. When a registered event occurs, JVMPI signals an event ev to the profiler that performs event-specific actions. In particular, the figure shows the initializations done when the class SocketInputStream is loaded. After initializing the internal socketread variable, the profiler can trace any invocation of the method socketRead() by incrementing the stat->tcp_read counter, which maintains the account for the TCP read operations of any SOMA agent in a specified time interval. These data represent a rough estimation of the incoming network traffic produced by Java service components. If more precise information about the traffic due to specific Java threads is needed, ResourceManager can command the MAPI Profiler Agent to examine dynamically the invocation parameters of the
socketRead()/socketWrite() methods. This is possible by setting at the maximum level of detail (JVMPI_DUMP_LEVEL_2) the triggering of JVMPI_ EVENT_OBJECT_DUMP for the specified objects. The default of the MAPI Profiler Agent, of course, is different to avoid the excessive overhead of the dynamic generation and processing of object dumps. JVMPI_Event *ev; jmethodID socketread = NULL;
// JVMPI event reference // method reference
switch(ev->event_type) {... case JVMPI_EVENT_CLASS_LOAD: if(strcmp(ev->u.class_load.class_name, "java/net/SocketInputStream")==0) { JVMPI_Method *meth; for(meth=ev->u.class_load.methods; ...; meth++) if(strcmp(meth->method_name,"socketRead")==0) socketread=meth->method_id; } break; case JVMPI_EVENT_METHOD_ENTRY2: stat = tab1.get(ev->env_id); if(ev->u.method.method_id==socketread) stat->tcp_read++; // update TCP statistics ...
Figure 4. Monitoring the invocation of socketRead()in the MAPI Profiler Agent
discarded IP output packets is obtained by combining five MIB variables: ipPackOutErr =
(ipOutDiscards + ipOutNoRou tes + ipFragFails) *100 ipOutRequests + ipForwDatagrams
where
ipOutDiscards, ipOutNoRoutes and ipFragFails are the number of output IP datagrams
discarded (respectively, for problems in buffer space, in routing and in fragmentation), while ipOutRequests and ipForwDatagrams are the total number of IP datagrams transmitted (respectively, locally generated packets and forwarded ones) [5]. In addition, the MAPI SNMP Agent can perform all the operations needed for the support of mutual authentication in case of interaction with SNMPv3 agents. It can obtain dynamically the needed security information from the public key infrastructure integrated with the SOMA programming framework [7, 15]. Finally, it can locally store configuration parameters specific for its SNMP agent (e.g., the supported MIBs), in order to automate the possibly complex phase of initialization of the MAPI tool.
4.2. The MAPI SNMP Agent 4.3. The MAPI*ResManager The MAPI SNMP Agent refines and extends the SNMP gateway component included in our MA-based framework for the distributed management of heterogeneous network elements [13]. It acts as an SNMP manager that locally interrogates its SNMP agent. The MAPI SNMP Agent is programmed to request monitoring information maintained not only in the standard MIB (monitoring data about network elements and protocols), but also, if supported, in the MIB extensions included in the Host Resources Groups called Storage, Running Software, and Running Software Performance [14]. These groups provide information about resource usage of processes currently in execution to obtain the MAPI ProcessInfo and FileSystemInfo, while NetworkInfo exploits the standard SNMP MIB. The MAPI SNMP Agent can improve the efficiency of standard client/server SNMP operations, especially when dealing with the network transfer of large chunks of monitoring data. It transmits only the changed MAPI indicators to ResourceManager, which maintains old values for the non-received parameters. Most important, the MAPI SNMP Agent locally interrogates its SNMP agent and pre-processes the obtained results to offer concise indicators to possibly remote managers, thus significantly reducing the generated network traffic. In fact, a single MIB variable is usually at a lower level than the MAPI indicators, and an aggregation of multiple variables is required. These aggregations are known as health functions [9]. For instance, the percentage of
When neither the SNMP agent nor the Host Resources MIB extensions are supported on target, ResourceManager can enable the gathering of monitoring data about non-Java processes via native mechanisms. This information is crucial when control actions on SOMA agents mainly depend on runtime conditions of the hosting environment. For instance, a SOMA administrator can enforce a very strict policy on agent CPU usage only when the total CPU usage on the host overcomes a specified threshold. MAPI native modules extract uniform data by exploiting heterogeneous monitoring mechanisms provided by the target operating system. The ResourceManager class employs JNI to load the target-specific native library at runtime. We have currently implemented the native monitoring components for Windows NT (MAPI WindowsRM DLL), Solaris (MAPI SolarisRM SO) and Linux (MAPI LinuxRM SO). Each component integrates with Java via the system-specific classes called MAPI NT ResManager, SVR4 ResManager and Linux ResManager, as depicted in Figure 2. Figure 5 shows a piece of the MAPI WindowsRM DLL that accesses OS resource state indicators maintained in Microsoft system registry keys. In particular, the figure reports the polling of the registry to obtain updated information about the processes in execution. The system RegQueryValueEx(HKEY_PERFORMANCE_DATA, call …) permits to obtain some performance data. The reported invocation returns a reference to the native method, called
perfdata, used to access the whole information about a process with identifier PID. RegQueryValueEx(HKEY_PERFORMANCE_DATA, “232”, NULL, NULL, perfdata, &size); // "232" for process-related data RegCloseKey(HKEY_PERFORMANCE_DATA); pointer = (PBYTE)perfdata + perfdata->HeaderLength; obj = (PPERF_OBJECT_TYPE)pointer; pointer = (PBYTE)obj + obj->HeaderLength; cnt = (PPERF_COUNTER_DEFINITION)pointer; while (cnt->CounterNameTitleIndex != PID) { pointer = (PBYTE)cnt + cnt->ByteLength; cnt = (PPERF_COUNTER_DEFINITION)pointer; } pointer = (PBYTE)obj + obj->DefinitionLength; inst = (PPERF_INSTANCE_DEFINITION)pointer; pointer = (PBYTE)inst + inst->ByteLength + cnt->CounterOffset; value = *((jlong*)pointer);
Figure 5. Monitoring process information in MAPI WindowsRM DLL For Solaris and Linux platforms, we have implemented native monitoring modules as dynamic SO libraries that mainly exploit the /proc feature. /proc is a virtual directory that makes visible OS resource state indicators as a specified sub-tree of the file system. The MAPI SolarisRM/LinuxRM library polls monitoring information about currently executing processes by reading the corresponding files in the /proc directory. For instance, the ioctl()call, with PIOCPSINFO and PIOCUSAGE parameters, permits to obtain prpsinfo and prusage information, which maintain several data about the identity of a specified process and its CPU usage, respectively. Similarly, SolarisRM/LinuxRM native components extract the descriptors of the open files from the /proc/PID/fd virtual directory, where PID is the identifier of the monitored process. File descriptors data are combined with information from the system file table, with an approach similar to the one followed in the implementation of the Unix fuser utility. Aggregated information about the network usage is obtained via the invocation of the standard netstat system call [16].
5.
Distributed Monitoring and Control of SOMA Agents
Any SOMA place can exploit the local MAPI component to achieve visibility of several on-line monitoring indicators, to enforce a local policy for MA resource usage. In addition, since mobile agents usually act as distributed service components over distributed systems, it is necessary to have also a global vision of the distributed state of resource consumption in order to enforce distributed control and management policies. For instance, a SOMA administrator can enforce policies involving a set of distributed resources, e.g., "the total CPU time per day consumed by all SOMA agents of principal A is lower than xxx sec". The MAPI component is also the basic mechanism to provide distributed management in SOMA: monitoring data retrieval/filtering and the coordination between local monitoring entities are
implemented, in their turn, in terms of SOMA mobile agents for the monitoring and control of distributed systems and services, either SOMA-based or not. To provide distributed monitoring and control of SOMA agents, we have designed and implemented two types of interworking agents: Managers and Explorers. Each Explorer agent is in charge of collecting monitoring data from one set of targets (i.e., target domain) usually belonging to the same network locality. The Manager agent commands the Explorers, combines their monitoring results and presents a global view of monitored domains to system administrators. In addition, the Manager can delegate management operations to its Explorers, in a way similar to [17]. Several organizations are possible, with different hierarchical levels and numbers of Managers/Explorers per target domain. In our organization, each system administrator can delegate several management operations to one or more Managers that operate autonomously. To collect information about the overall state of its administered domains, the Manager coordinates the operations of its Explorer agents. In particular, it can ask Explorers to gather specified monitoring data, with specific alert thresholds and refresh time intervals, and can also command management operations. In addition, a Manager can create new monitoring Explorers at run-time to go and control new target domains. Explorer agents periodically migrate to their target domain hosts to invoke locally MAPI functions, in order to collect monitoring indicators about both JVM resources and OS ones. Explorers can respect alert thresholds the responsible Manager can modify dynamically: when thresholds are exceeded, the Explorer can either notify its Manager or take autonomously corrective operations on service components. Explorers can reduce network traffic due to distributed monitoring by performing locally management operations without intervention of either Managers or system administrators. Explorers can also invoke the MAPI Profiler Agent functions to control and manage local Java threads. In particular, they can modify the priority of running threads and can force thread suspension/termination. In addition, when controlling SOMA agents, they can suspend agents for a specified interval time, by exploiting the SOMA persistency mechanisms [11]. Let us observe that the specification and implementation of the JVM itself limit possible control actions. Additional control functions are recognized as crucial especially in the emerging market of JVM-enabled embedded devices, and are recently stimulating SUN research work to provide separated execution environments for different Java thread groups (task isolation), to permit their independent control. The overhead of the MAPI distributed tool can be tuned at run-time by modifying different monitoring
parameters. It is possible to change dynamically both the visit time interval for Explorers to their target domain hosts and the refresh time interval for MAPI modules. In addition, the Manager can command Explorers to invoke the MAPI Profiler Agent methods to enable/disable the notification of specific kinds of events, thus adapting dynamically the collection of monitoring data to the enforced management policy. The following section presents some experimental results about the overhead of SOMA agent monitoring. SOMA administrators can define agent permissions and duties. Agent permissions specify which actions agents are authorized to perform on a set of target resources, possibly depending on runtime conditions. Agent duties specify the actions agents must perform on a set of target resources when a specified condition takes place [12]. For instance, to control the network resources consumed in a target domain, one administrator can enforce a distributed authorization policy that limits the number of socket operations of a specified SOMA agent during one day over all the target hosts in the domain. The limit on the number of socket operations can also apply to groups of agents, e.g., the whole set of agents of the same responsible principal. As an example of agent duty specification, one administrator can request an Explorer agent to lower automatically the priority of a SOMA agent running on specified host when the total CPU usage percentage on that host is higher than a defined threshold. In this simple case, the Explorer controls a single agent and monitors the state of a single host. SOMA permits to define also duties that impose to monitor the state of a whole target domain and to perform management operations on groups of agents. In the first example, the MAPI-based distributed monitoring tool ascertains the number of socket operations of the agent (or the agent set) in the different nodes of the domain. The Manager commands the Explorer to probe the target domain at any request of socket operation by one of the controlled agents. This introduces a delay in the control of agent authorizations but permits to specify policies that depend on the current distributed state and are enforced on several distributed agents. In the second example, the MAPI-based distributed tool enables the monitoring of the CPU usage and the triggering of the management operation. In particular, the Manager commands the Explorer to control the state of the CPU usage on the specified host periodically, depending on the interval time indicated in the duty specification. When the threshold is overcome, the Explorer acts on the specified agent by exploiting MAPI
functions to modify dynamically the priority of Java threads. The conditions to be controlled in SOMA agent permissions and duties can be expressed as even complex functions of the MAPI monitoring indicators. As shown by the examples, it is often necessary to monitor not only the current state of SOMA agents and of their Java threads, but also of systems and service components external to the JVM.
6.
Experimental Evaluation of Agent Monitoring and Control
SOMA
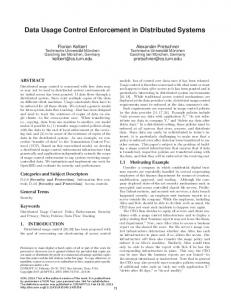
To validate the applicability of the MAPI-based distributed monitoring and control to mobile agents, we have measured the overhead of the MAPI component on different platforms, e.g., Intel PentiumIII 600MHz PCs with either Microsoft Windows NT 4.0 or SuSE Linux 6.2, and SUN Ultra5 400MHz workstations with Solaris 7. The hosts are interconnected via 10 Mb Ethernet Local Area Networks (LANs). This section reports the costs of each MAPI module. With regard to the MAPI Profiler Agent and the MAPI*ResManager, we have used a Java benchmark application that stresses CPU and memory usage by generating a fixed number of different threads and objects. In particular, the measurements reported in the following refer to the case of 50 benchmark processes in execution, each one with an average number of 5 threads. We have measured the overhead of the two modules depending on the time period to refresh monitoring indicators. We define the overhead percentage (Overhead%) introduced by the monitoring tool as: Tmon − 1 ∗100 Overhead % = T noMon
where TMon and TnoMon are the average completion times of the Java benchmark on unloaded targets, respectively, with and without the MAPI tool in execution. Let us note that unloaded targets represent the worst possible case for Overhead%. In fact, as soon as the load increases, TnoMon grows faster than Tmon, and their ratio consequently tends to decrease. This has been validated by taking Overhead% measurements with several generalpurpose benchmark tests running: the measurements have confirmed the expected behavior, with an average decrease of about 1.0-1.5% of the Overhead% parameter in conditions of average load. Figure 6 depicts the Overhead% introduced by the MAPI*ResManager to monitor all the information contained in ProcessInfo for the three supported platforms. The diagram of Overhead% is drawn function of the refresh time that represents the interval between
two successive invocations of the native monitoring modules via JNI. Overhead% exhibits a linear dependence on the reciprocal of the refresh time. We have obtained analogous trends in intrusion measurements in case of NetworkInfo and native monitoring of FileSystemInfo.
requires to receive and collect in the profiler. In any case, the total overhead can be kept under 2.0% when the refresh interval is greater than 2 seconds and object tracing is disabled. JVMPI monitoring 7.00
Data reading Object trace
6.00
ProcessInfo
10.00
Overhead%
5.00
MAPI Window s ResManager MAPI Solaris ResManager MAPI Linux ResManager
8.00
Overhead%
12.00
Method trace Class/Monitor Trace
4.00 3.00 2.00 1.00
6.00
0.00 1.0
4.00
2.0
3.0
4.0
5.0
6.0
7.0
8.0
Sample Time (sec)
JVMPI monitoring (without object tracing)
2.00 3.00
Data reading Method trace
0.00
Class/Monitor trace
2.50
2.0
4.0
6.0
8.0
10.0
12.0
Refresh Time (sec)
Figure 6. Overhead% of MAPI*ResManagers for process monitoring In general, all tests show that the MAPI*ResManager causes a limited overhead (Overhead% lower than 3%) when the refresh time interval is greater than 3 seconds. This can be considered acceptable because the refreshing of monitor indicators with this time period is sufficient for the enforcement of most resource usage policies. In fact, native modules continuously collect monitored events, and the refresh interval represents only the period between successive interrogations of native monitoring results. We have also measured the overhead introduced by the MAPI Profiler Agent. In this case, the JVM notifies continuously certain kinds of events (not only at polling times), and the refresh time represents the interval to process the collection of observed events in order to obtain the desired concise monitoring indicators. Figure 7 depicts the different contributions of the Overhead% related to data access and to the JVMPI notification mechanisms, i.e., monitor, method and object tracing. The results obtained for the Solaris platform are very similar to the ones for Windows NT and Linux, with differences lower than 3% of the maximum Overhead%. The figure shows that the JVMPI notification is scarcely intrusive under different load conditions and independent of refresh times. The refresh time affects only the overhead due to the processing of collected events and to the reading of MAPI indicators. Object tracing has shown to be the most relevant factor in the MAPI Profiler Agent intrusion because of the large amount of data it
Overhead%
0.0
2.00
1.50
1.00
0.50
0.00 1.0
2.0
3.0
4.0
5.0
6.0
7.0
8.0
Sample Time (sec)
Figure 7. Overhead% of the MAPI Profiler Agent Finally, we have considered the distributed monitoring and control of SOMA agents, which exploits mobile Explorer agents to migrate and to interrogate locally the MAPI modules. The size of Explorers vary from about 8kB (at the first migration, without carrying any monitoring indicator) to 15kB (at the end of exploration, including all the monitoring state of the target domain). Figure 8 reports the time an Explorer needs to collect monitoring indicators by using MAPI SNMP Agents, depending on the number of hosts in the target domain. The MAPI SNMP Agent filters and pre-processes the monitoring data to collect. For several policies about MA resource consumption, we have experienced that the MAPI SNMP Agent operations significantly reduce the size of MAPI indicators collected by the Explorer with respect to the size of corresponding raw MIB values (1:3 reduction). This optimization is impossible in a traditional Client/Server (C/S) approach where a fixed and centralized manager remotely interrogates the different SNMP agents involved (SNMP C/S graph in the figure). In addition, the MA technology is particularly suitable
when the target domain includes different LANs, interconnected by low bandwidth links (in our measurements, two Ethernet LANs with n/2 hosts and connected via a 56kb modem link). In this case, Explorer uses the slow link only once to migrate from one LAN to the other, while the C/S solution should use the link at least in n/2 SNMP requests and n/2 SNMP replies, wherever the centralized manager is located. MAPI Explorer vs. SNMP Client/Server 12000
Explorer agent SNMP Client/Server Explorer agent (different LANs) SNMP Client/Server (different LANs)
10000
Time (msec)
8000
6000
4000
2000
0 0
2
4
6
8
10
12
14
#hosts in target domain
Figure 8. MAPI Explorer vs. SNMP Client/Server to monitor SOMA agents in one target domain
7.
Related Work
Even if the monitoring and control of agent operations during execution are closely related to an enlargement of acceptance of the MA technology, they are still open issues for state-of-the-art MA platforms. To the best of our knowledge, there are no Java-based MA programming environments yet to provide mechanisms to measure, control and account agent resource consumption without imposing modifications to the standard JVM [18, 19]. Several research activities have worked, instead, on the exploitation of mobile agents as a suitable implementation technology for monitoring and managing distributed systems/services. In this area, recent research experiences have demonstrated the MA flexibility and effectiveness to decentralize and to automate the control of distributed service components [9, 17]. Not only the introduction of the MA technology, but also the diffusion of Java for the implementation of Web services are recently changing the perspective in the monitoring area, where significant research work has been accomplished in the last years. Several distributed instrumentation systems have achieved very interesting results, especially to limit monitoring intrusion [20, 21]. However, they require instrumenting either the source code or the binary of monitored applications, and tend to
be language- and platform-specific. This is not suitable for the monitoring of either mobile agents or, more generally, Web-based services that consist of distributed heterogeneous components not to be suspended during execution. Some efforts have specifically addressed on-line monitoring. They have concentrated on producing effective tools by generally exploiting ad-hoc mechanisms available only for specific operating systems [22, 23]. These solutions are too platform-dependent to be suitable for open and intrinsically heterogeneous distributed environments such as the Internet. In the area of network monitoring and management, many researchers have used standard protocols to interrogate the state of network equipment. The most diffused protocol is still SNMP, mainly because of its simplicity. Other approaches start to be common: some of them provide network traffic monitoring with the granularity of a whole network segment (Remote MONitoring - RMON [5]); others exploit platformdependent libraries and commands (such as the UNIX libpcap library) to enable network packet capture, filtering and analysis at general-purpose hosts [24]. The goal of these tools, however, is mainly the dynamic observation of network traffic, with no provision of online monitoring of service components at the application level. With regard to Java-based monitoring, some activities have simply addressed the enhancement of standard SNMP solutions with Web accessibility. Then, some proposals have started to exploit Java networking facilities and code mobility to provide an integrated middleware for distributed monitoring [6]. Probably due to the novelty of the technology, there are few examples of Java monitoring tools based on JVMPI. Perfanal [25] exploits the SUN HPROF profiler agent to perform an off-line analysis of collected monitoring data and to obtain a user-level concise view for debugging Java applications. JProf [26] implements its own profiler agent and profiler process, and provides a large set of functions to present the results of an off-line data analysis in user-level interoperable formats, such as tables and diagrams organized by using XML.
8.
Lessons Learned Future Work
and
Directions
of
First results in monitoring and controlling resource consumption of SOMA agents have shown, on the one hand, the feasibility of Java-based on-line monitoring, and, on the other hand, the necessity to enable the dynamic tuning of the monitoring overhead by adjusting both the sample frequency and the set of collected data. In normal working conditions, all tests indicate that
monitoring SOMA agents causes a negligible overhead when the sample frequency goes under 0.3 Hz. Notwithstanding the encouraging results obtained, much work is still to be done to achieve a complete and flexible control of SOMA agent resource consumption. Apart from improving the performance of the local MAPI component by adopting filtering strategies to maintain only the monitoring indicators currently of interest, we are working at: adopting the Ponder policy specification language to express obligation and permission policies for SOMA agents. These policies permit to specify control thresholds that depend on the runtime state of managed distributed systems, and to trigger automatically management operations when controlled conditions become valid; extending the distributed monitoring and control of SOMA agents to permit the accounting and billing of registered SOMA users for the effective resource usage of their agents. Accounting and billing can exploit the large set of monitoring information provided by the MAPI component at runtime, but do not require the evaluation and processing of monitoring data on-line. This suggests differentiated strategies for data collection, with possibly significant overhead reductions.
Acknowledgements Investigation supported by the Italian Ministero della Ricerca Scientifica e Tecnologica in the framework of the Project "MUSIQUE: Infrastructure for QoS in Web Multimedia Services with Heterogeneous Access".
[9]
[10] [11]
[12]
[13]
[14] [15] [16]
[17]
[18]
[19]
References [1] [2]
[3]
[4] [5] [6]
[7]
[8]
G. Vigna (ed.), Mobile Agents and Security, Lecture Notes in Computer Science, Vol. 1419, Springer Verlag, 1998. A. Corradi, M. Cremonini, R. Montanari, and C. Stefanelli, "Mobile Agents Integrity for Electronic Commerce Applications", Information Systems, Elsevier, Vol. 24, No. 6, 1999. Sun Microsystems - Java Virtual Machine Profiler Interface (JVMPI), http://java.sun.com/ products/jdk/1.3/ docs/guide/jvmpi/jvmpi.html. R. Gordon, Essential Java Native Interface, Prentice Hall, 1998. W. Stallings, SNMP, SNMPv2, SNMPv3, and RMON 1 and 2, Addison Wesley, 1998. J. Lee, "Enabling Network Management Using Java Technologies", IEEE Communications, Vol. 38, No. 1, Jan. 2000. P. Bellavista, A. Corradi, and C. Stefanelli, "Protection and Interoperability for Mobile Agents: A Secure and Open Programming Environment", IEICE Transactions on Communications, Vol. E83-B, No. 5, May 2000. P. Bellavista, A. Corradi, and C. Stefanelli, "An Integrated Management Environment for Network Resources and
[20]
[21]
[22] [23]
[24]
[25]
[26]
Services", IEEE Journal on Selected Areas in Communication, Vol. 18, No. 5, May 2000. D. Gavalas, M. Ghanbari, M. O’Mahony, and D. Greenwood, "Enabling Mobile Agent Technology for Intelligent Bulk Management Data Filtering", IEEE/IFIP Network Operations and Management Symposium (NOMS), USA, Apr. 2000. AdventNet Inc., AdventNet SNMP API, http://www. adventnet.com/products/snmpbeans/. P. Bellavista, A. Corradi, and C. Stefanelli, "Mobile Agent Middleware for Mobile Computing", IEEE Computer, Vol. 34, No. 3, Mar. 2001. A. Corradi, N. Dulay, R. Montanari, and C. Stefanelli, "Policy-Driven Management of Agent Systems", Policy Workshop, Great Britain, Jan. 2001. P. Bellavista, A. Corradi, and C. Stefanelli, "An Open Secure Mobile Agent Framework for Systems Management", Journal of Network and Systems Management, Vol. 7, No. 3, Mar. 1999. S. Waldbusser, and P. Grillo, "Host Resources MIB", RFC2790, http://www.ietf.org/rfc/, Mar. 2000. Entrust Technologies - Entrust/PKI, http://www.entrust. com/products/pki/. E. Nemeth, G. Snyder, T. R. Hein and S. Seebass, UNIX System Administration Handbook, Prentice Hall, Sep. 2000. B. Pagurek, Y. Wang and T. White, "Integration of Mobile Agents with SNMP: Why and How", IEEE/IFIP Network Operations and Management Symposium (NOMS), USA, Apr. 2000. G. Czajkowski, and T. von Eicken, "JRes: a Resource Accounting Interface for Java", ACM Conf. ObjectOriented Programming, Systems, Languages and Applications (OOPSLA), USA, 1998. N. Suri, J. M. Bradshaw, M. R. Breedy, P. T. Groth, G. A. Hill, R. Jeffers, and T. S. Mitrovich, "An Overview of the NOMADS Mobile Agent System", ECOOP Workshop On Mobile Object Systems, France, 2000. F. Lange, R. Kroeger, and M. Gergeleit, "JEWEL: Design and Implementation of a Distributed Measurement System", IEEE Transactions on Parallel and Distributed Systems, Vol. 3, No. 6, Dec. 1992. A. Bakic, M. W. Mutka, and D. T. Rover, "BRISK: a Portable and Flexible Distributed Instrumentation System", Software - Practice and Experience, Vol. 30, No. 12, Dec. 2000. B. A. Schroeder, "On-Line Monitoring: A Tutorial", IEEE Computer, Vol. 28, No. 6, June 1998. G. Weiming, G. Eisenhauer, K. Schwan, and J. Vetter, "Falcon: On-line Monitoring for Steering Parallel Programs", Concurrency - Practice and Experience, Vol. 10, No. 9, Sep. 1998. L. Deri, and S. Suin, "Effective Traffic Measurement Using Ntop", IEEE Communications, Vol. 38, No. 5, May 2000. N. Meyers, "PerfAnal: A Performance Analysis Tool", http://developer.java.sun.com/developer/technicalArticles/ GUI/perfanal/index.html. G. Pennington, and R. Watson, "JProf - a JVMPI Based Profiler", http://starship.python.net/ crew/garyp/jProf.html.