Hindawi Publishing Corporation Journal of Electrical and Computer Engineering Volume 2016, Article ID 7341735, 8 pages http://dx.doi.org/10.1155/2016/7341735
Research Article HS-RAID2: Optimizing Small Write Performance in HS-RAID Yongfeng Dong, Jingyu Liu, Jie Yan, Hongpu Liu, and Youxi Wu School of Computer Science and Engineering, Hebei University of Technology, Xiping Road No. 5340, Beichen District, Tianjin 300401, China Correspondence should be addressed to Jingyu Liu;
[email protected] Received 4 December 2015; Accepted 1 February 2016 Academic Editor: Hui Cheng Copyright © 2016 Yongfeng Dong et al. This is an open access article distributed under the Creative Commons Attribution License, which permits unrestricted use, distribution, and reproduction in any medium, provided the original work is properly cited. HS-RAID (Hybrid Semi-RAID), a power-aware RAID, saves energy by grouping disks in the array. All of the write operations in HSRAID are small write which degrade the storage system’s performance severely. In this paper, we propose a redundancy algorithm, data incremental parity algorithm (DIP), which employs HS-RAID to minimize the write penalty and improves the performance and reliability of the storage systems. The experimental results show that HS-RAID2 (HS-RAID with DIP) is faster and has higher reliability than HS-RAID remarkably.
1. Introduction RAID (Redundant Array of Independent Disks) [1, 2] combines multiple disk drives into a logical unit for the purposes of data redundancy or performance improvement. However, storage systems enlarge dramatically with the increasing of data. In April 2014, IDC reported that 4.4 ZB data was created by 2013, and the digital universe will be growing 40% a year into the next decade [3]. To meet the capacity demand, storage systems have grown to petabyte scale [4], and thousands of disks are deployed in storage systems. That caused a problem that cannot be ignored: high power consumption. Many studies focused on power-saving of storage systems in recent years. The reason lies that higher power consumption leads to not only higher power costs in both storage systems and cooling systems, but also increasing operating temperature which can degrade the reliability and stability of the whole systems. Therefore, researchers proposed many kinds of strategies, such as DPM (Dynamic Power Management) algorithms, physical device level, and systems level [5]. DPM algorithm is proposed to turn disk devices into standby state to reduce power consumption during their idle period. However, DPM works only in the independent disk and does not work in RAID. At the physical device level, manufacturers are developing new energy efficient drives and hybrid drives. A hybrid drive combines NAND flash solidstate drive (SSD) with hard disk drive (HDD), with the intent
of adding some of the speed of SSDs to the cost-effective storage capacity of traditional HDDs. The SSD in a hybrid drive acts as a cache for the data stored on the HDD by keeping copies of the most frequently used data on the SSD for improved overall performance and energy-saving. At the system level, a number of integrated storage solutions such as MAID [6] and PERGAMUM [7] have emerged which are based on the general principle of transitioning the disks automatically to a low-power state (standby) after they experience some predetermined period of inactivity. PARAID [8] exploits the free space on the disks to duplicate data and uses a skewed striping pattern to adapt to the system load by varying the number of powered disks, thus needing no specialized hardware. eRAID [9] focuses on conventional disk-based mirrored disk array architectures like RAID 0. The power-saving effect is limited on parity redundant disk arrays like RAID 5. Hibernator [10] makes use of multispeed disk and abstracts the power saving problem into an optimization problem. It exploits the optimum solution in data migration between disks. EERAID [11] is another energy-efficient RAID system architecture which conserves energy by taking advantage of redundant information. S-RAID [12] is an alternative RAID data layout for the kind of application that exhibits a sequential data access pattern. The data layout of S-RAID uses a grouping strategy that makes only part of the whole array active and puts the rest of the array into standby mode. Even in the sequential data
2 access storage system there are lots of random data accesses, and these degrade the performance of S-RAID dramatically. In our prework, we proposed an alternative RAID data layout based on S-RAID and HS-RAID [13], to avoid random data access effects and save the power consumption of the storage systems. HS-RAID is divided into two parts: RAID 1 and SRAID 4/5. The first one is composed by SSDs for metadata storage, while the latter is composed by HDDs for data storage. HS-RAID is designed for the kind of applications that exhibit a sequential data access pattern, uses a grouping strategy that makes part of the whole array active, and puts the rest of the array into standby mode. Hence, HS-RAID can greatly reduce the power consumption and improve the reliability while still satisfying the I/O requirements of applications. However, different RAID levels store data utilizing a variety of striping, mirroring, and parity techniques. RAID schemes based on parity improve the reliability of storage systems by managing a recovery parity disk. But parity calculations degrade performance especially performing smallwrite. The same problem also exists in HS-RAID whose parity schemes utilize RAID 4/5, and all writes in it are small writes. This paper describes and evaluates a powerful parity algorithm, Data incremental parity algorithm (DIP), for eliminating the small write penalty in HS-RAID. DIP calculates parity data with the new data and the old parity and does not read the old data of the blocks which will be written in. The remainder of this paper is organized as follows. Section 2 introduces the HS-RAID data layout. Following that, Section 3 gives detailed discussions of DIP algorithm and the write operation in HS-RAID2 . Then, Section 4 details data recovery in HS-RAID2 . The experimental results are presented in Section 5. Section 6 closes with a summary.
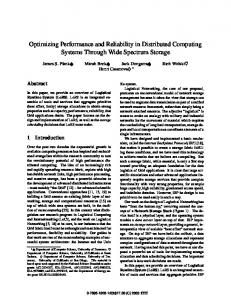
2. HS-RAID Data Layout 2.1. S-RAID. S-RAID [12] is an alternative RAID data layout for the kind of application that exhibits a sequential data access pattern. The data layout of S-RAID uses a grouping strategy that makes only part of the whole array active and puts the rest of the array into standby mode. Therefore, S-RAID can greatly reduce the power consumption and improve the reliability while still satisfying the I/O requirements of the application. S-RAID [12] trades data transfer rate for energy efficiency and reliability and is suitable for the applications like video surveillance which requires moderate data transfer rate but large storage capacity and high reliability. These applications also exhibit a highly sequential data access pattern that SRAID is optimized for. However, even in the sequential data access application, there exist lots of random data accesses which degrade the performance of S-RAID dramatically. In order to avoid the adverse effects of random data access, HS-RAID was proposed in our prework. 2.2. HS-RAID. HS-RAID [12] includes two parts: RAID 1 and S-RAID. RAID 1 is composed of two SSDs, and S-RAID [10] is composed of a group of hard disks, as shown in Figure 1. Hard
Journal of Electrical and Computer Engineering File system
Virtualization manager
SSD1
SSD0
RAID 1
Disk0
Disk1
···
Diskn
S-RAID
Figure 1: Configuration of Hybrid S-RAID.
SSSD /2 + SS-RAID SSSD + SS-RAID − 1
0 SSSD /2
SSD
Superblock
S-RAID
Superblock
Duplicate of metadata
SSD
Figure 2: Address mapping.
disks are grouped in S-RAID and parallel in the group. The random I/O requests are mapped to RAID 1, while sequential I/O requests are mapped to S-RAID. When only one group of hard disks are busy under continuous data access mode, the others can be shut down or put into standby mode for energy-saving because of no requests on them. That can save energy of the whole storage systems and increase the costs slightly. HS-RAID is designed for applications whose I/O characteristics are sequential access. RAID 1 which is composed of SSDs in HS-RAID is divided into three parts: two for storing superblock and one for metadata. The virtualization manager in Figure 1 maps the logical address to the physical address in the way shown in Figure 2. The addresses of two superblock partitions and S-RAID are identical logically, but the metadata partition is managed individually. The logical address 0 ∼ 𝑆SSD /2 − 1 is mapped to the front of RAID 1, and it is 4 KB for superblock of the file system. 𝑆SSD /2 ∼ 𝑆SSD /2 + 𝑆S-RAID − 1 is mapped to S-RAID for data. 𝑆SSD /2 + 𝑆S-RAID ∼ 𝑆SSD + 𝑆S-RAID − 1 is mapped to the second 4 KB of RAID 1 for superblock too. In fact, data of both superblocks is consistent. In the metadata partition, the data is duplication of metadata which is in S-RAID. The metadata writes are done only if it is written in both the S-RAID and the metadata partition. The metadata, which is written once, never modified and read frequently in most sequential storage systems, is located in the metadata partition in order to avoid spinning up disks in standby mode.
Journal of Electrical and Computer Engineering
3
SSD0
SSD1
D0
D1
D2
D3
P
S0,0
S1,0
B0,0
B1,0
B2,0
B3,0
SP0
Stripe0
···
···
B0,1
B1,1
B2,1
B3,1
SP1
Stripe1
S0,q−1
S1,q−1
B0,2
B1,2
B2,2
B3,2
SP2
Stripe2
S0,q
S1,q
B0,3
B1,3
B2,3
B3,3
SP3
Stripe3
···
···
···
···
···
···
···
S0,2q−1
S1,2q−1
B0,m−1
B1,m−1
B2,m−1
B3,m−1
SPm−1
G0
RAID 1
.. . Stripem−1
G1
Figure 3: Data layout of HS-RAID 4.
2.2.1. HS-RAID 4. HS-RAID 4 is composed of a RAID 0 and a S-RAID 4 (shown as in Figure 3). Figure 3 gives an example of data layout of HS-RAID 4. There are two SSDs (SSD0 and SSD1 ) and five HDDs (𝐷0 , 𝐷1 , 𝐷2 , 𝐷3 , and 𝑃) in the storage system. One HDD (𝑃) is the parity disk, and the other four HDDs (𝐷0 , 𝐷1 , 𝐷2 , and 𝐷3 ) are divided into two groups (𝐺0 and 𝐺1 ) every two HDDs. The arrows in Figure 3 denote the data block sequence in the Logic Block Address (LBA) ascending order. 𝑆𝑖,𝑗 denotes a data block in RAID 1 and 𝐵𝑖,𝑗 denotes a data block in S-RAID, where 𝑖 and 𝑗 denote the SSD or HDD number and the stripe number, respectively. Every LBA blkno in SSDs can be computed as {𝑗, blkno (𝑆𝑖,𝑗 ) = { 𝑇 + 𝑗, { 𝑠
0 ≤ 𝑗 < 𝑞 − 1; 𝑞 ≤ 𝑗 < 2𝑞 − 1,
(1)
where 𝑇𝑠 is the amount of blocks in the first part of RAID 1(𝑞) and the total amount of blocks in S-RAID. Obviously, blocks in both SSDs with the same offset have the same LBA: blkno (𝑆0,𝑗 ) = blkno (𝑆1,𝑗 ) .
(2)
Assume that there are 𝑟 groups: 𝐺0 , 𝐺1 , . . . , 𝐺𝑟−1 in SRAID, and 𝑁𝐺 is the amount of disks in each group. Then, we have 𝐿 𝑆 = 0, where 𝐿 𝑆 is the starting LBA of RAID 1, and blkno(𝐵0,0 ) = 𝑞. So the starting LBA of each group in S-RAID can be computed as 𝐿 𝐺𝑘 = 𝑞 + 𝑘 ∗ 𝑚 ∗ 𝑁𝐺
(𝑘 = 0, 1, . . . , 𝑟 − 1) .
(3)
Then, for every LBA blkno in the array, there exists a 𝑘 that satisfies 𝐿 𝐺𝑘 ≤ blkno < 𝐿 𝐺𝑘+1 , and 𝑘 can be calculated as 𝑘=⌊
blkno − 𝑞 ⌋. 𝑚 ∗ 𝑁𝐺
(4)
Then, we can easily have mapping 𝑓: 𝑓stripeS-RAID (blkno) = ⌊
blkno − 𝐿 𝐺𝑘 𝑁𝐺
⌋,
𝑓diskS-RAID (blkno) = (blkno − 𝐿 𝐺𝑘 ) mod 𝑁𝐺 + 𝑘
(5)
× 𝑁𝐺, 𝑓 (blkno) = 𝐵𝑓disk
S-RAID
(blkno),𝑓stripeS-RAID (blkno) .
Every LBA blkno of 𝐵𝑖,𝑗 can be computed as blkno (𝐵𝑖,𝑗 ) = 𝐿 𝐺𝑘 + 𝑗 × 𝑁𝐺 − 𝑘 × 𝑁𝐺.
(6)
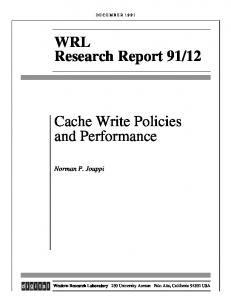
2.2.2. HS-RAID 5. The fixed parity disk is the bottleneck of HS-RAID 4 because it not only degrades the performance but also reduces the system’s reliability. Replacing S-RAID 4 with S-RAID 5 (shown as in Figure 4) in HS-RAID, we can get HSRAID 5 which has uniformly distributed parity blocks among the disks. HS-RAID 5 is composed of a RAID 0 and a S-RAID 5. For simplicity, when we discuss HS-RAID 5 in the rest of this paper, it means the S-RAID 5 partition. Figure 4 gives an example of a part of HS-RAID 5: S-RAID 5. Like in HSRAID 4, we also use a grouping strategy that further divides the stripes into vertical groups in HS-RAID 5. There is no fixed parity disk in HS-RAID 5, instead of that we put parity blocks into different disks in each vertical stripe. The arrows in Figure 4 denote the data block sequence in the Logic Block Address (LBA) ascending order. 𝐵𝑖,𝑗 denotes a data block in S-RAID, where 𝑖 and 𝑗 denote the HDD number and the stripe number, respectively. There are five HDDs (𝐷0 , 𝐷1 , 𝐷2 , 𝐷3 , and 𝐷4 ) in HSRAID 5 which is shown in Figure 4. Five disks are divided into 2 groups. Each group may include different disks in different stripe because the parity blocks locate in different disk. For example, as shown in Figure 4, Group0 includes 𝐷0 and 𝐷1
4
Journal of Electrical and Computer Engineering D0
D1
D2
D3
D4
Stripe0
B0,0
B1,0
B2,0
B3,0
SP0
Stripe1
B0,1
B1,1
B2,1
B3,1
SP1
Stripe2
B0,2
B1,2
B2,2
SP2
B4,2
Stripe3
B0,3
B1,3
B2,3
SP3
B4,3
Stripe4
B0,4
B1,4
SP4
B3,4
B4,4
Stripe5
B0,5
B1,5
SP5
B3,5
B4,5
Stripe6
B0,6
SP6
B2,6
B3,6
B4,6
Stripe7
B0,7
SP7
B2,7
B3,7
B4,7
Stripe8
SP8
B1,8
B2,8
B3,8
B4,8
Stripe9
SP9
B1,9
B2,9
B3,9
B4,9
VGroup 0
VGroup 1 VGroup 2
VGroup 3 VGroup 4
Figure 4: Data layout of S-RAID 5.
in Stripe1 , and Group1 includes 𝐷2 and 𝐷3 in the same stripe. But in Stripe2 , the parity block is transferred into 𝐷3 . Group0 includes the same disks as in Stripe1 , but Group1 includes 𝐷2 and 𝐷4 . For the same reason, in Stripe6 , Group0 includes 𝐷0 and 𝐷2 , and Group1 includes 𝐷3 and 𝐷4 .
3. HS-RAID2 : HS-RAID with New Redundancy Strategy Before going into the detail of redundancy strategy, it is necessary to look at the write operation of HS-RAID. Writing in the RAID 1 of HS-RAID is easy to understand, and it is not the focus of this paper, so it should be noted that when we mention the write operation in HS-RAID on the rest of the paper, it refers to the write operation in the S-RAID of HS-RAID. 3.1. Write Operation in HS-RAID. RAID 4/5 utilizes parity techniques to store data to enhance storage reliability. Write operations in RAID 4/5 are done only if the data and parities have been written. The parity is calculated from the data in the same address of the disks in RAID using XOR operation: 𝑃 = ⨁ 𝐷𝑖 , 𝑖
(7)
where 𝑃 and 𝐷𝑖 are the parity disk and data disks, respectively. When calculating the parity for RAID 4/5, the RAID controller selects a computation based on the write request size. The large-write parity calculation is 𝑃large-write = 𝐷new ⊕ 𝐷remaining ,
(8)
where 𝑃large-write , 𝐷new , and 𝐷remaining are the parity disk, the data on the disk(s) to be written, and the remaining disk(s), respectively. After computing the parity, the data and the new parity are written to the disks and the parity disk, respectively. The small-write parity calculation is 𝑃small-write = 𝐷new ⊕ 𝐷old ⊕ 𝑃old ,
(9)
where 𝑃small-write , 𝐷new , and 𝐷old are the parity disk, the data on the disk(s) to be written, the data to be replaced on the same disk(s), respectively. After computing the parity, the data and the new parity are written to the disks and the parity disk, respectively. The main goal of HS-RAID is energy-saving by dividing disk into groups. Generally, only one group is active at the same time. In HS-RAID, all write operations are small write and select the computation “read-modify-write” to avoid spanning up other disks of groups that are put into standby mode. Small-write parity in HS-RAID can be computed by XORing the old and new data with the old parity the same as in RAID. The parity calculation is 𝑆𝑃new = 𝐷old ⊕ 𝐷new ⊕ 𝑆𝑃old .
(10)
When write requests are sent to HS-RAID, the corresponding disks are selected and made active if needed. Then, all selected blocks and parity blocks in the same stripes are read out. Lastly, HS-RAID recalculates the parity and writes the new data and the new parity back to disk. “Read-modifywrite” brings write penalty severely and degrades the storage system’s performance dramatically. 3.2. HS-RAID2 : HS-RAID with DIP. HS-RAID is designed for the kind of applications that exhibit a sequential data access pattern, such as video surveillance, continuous data protection (CDP), and virtual tape library (VTL). These systems have typical workload characteristics: write-once, read-maybe, and new writes unrelated to old writes. We propose a new parity calculation algorithm applied to those applications workload characteristics: data incremental parity algorithm (DIP). In the rest of the paper, HS-RAID2 is named for HS-RAID with DIP. As Figure 5 shows, data in HS-RAID is always written in a new block in order. We set a pointer𝑃LBA as the last block that is written to. The initial value of 𝑃LBA is “−1”. In HS-RAID2 , the parity data is not calculated from all blocks in the stripe, but only blocks which are written to.
Journal of Electrical and Computer Engineering
Stripe0 Stripe1 Stripe2 Stripe3 .. . Stripem
D0
D1
D2
D3
P
B0,0 B0,1
B1,0 B1,1
B2,0 B2,1
B3,0 B3,1
SP0 SP1
B0,2
B1,2
B2,2
B3,2
SP2
B0,3 .. . B0,m
B1,3 .. . B1,m
B2,3 .. . B2,m
B3,3 .. . B3,m
SP3 .. . SPm
5
PLBA (B3,2 )
4. Data Recovery in HS-RAID2
G1
G0
Then, the data and parity to the array are written. Therefore, it can also minimize the write penalty, because old data does not need to be read while it does in RAID and HSRAID.
Full data block Parity data block Empty data block
Figure 5: Sequential write in HS-RAID.
To maximize the benefit of DIP, write alignment is used: a buffer is set to collect data to be written large enough to write the whole stripe of a group. Writing to the first group and the other groups in HSRAID2 is in different ways:
Disk failure happens every day and even every hour in data centers. As with RAID 4/5, only one disk is allowed to fail in HS-RAID2 . When a disk in the array fails, it must be fixed or replaced in time to avoid another disk failing that causes all the storage system failure. HS-RAID2 not only reduces the workload of write operations and minimizes the write penalty but also reduces the workload during the data recovery. In this section, we will discuss how HS-RAID2 works during the data recovery after the failure disk is fixed or replaced and investigate the benefit in reducing the failure rate. After the failure disk is fixed or replaced, how HS-RAID2 recovers data depends on which disk fails. Generally, there are three cases.
(11)
(1) The Empty Disk. Although empty data disk fails rarely, it does. In this case, we need to replace the failure disk with a new one and initialize it without data written in. It notes that the data recovered from the array must be written into the new disk even if it means nothing in RAID and HS-RAID, because the parity of these arrays is calculated with all disks in it.
where 𝑆𝑃new and 𝐷𝑖 are the parity and all the data that will be written to the array, respectively. In blocks form, it is easy to transform formula (11) into formula (12):
(2) The Disk with Data. If the failure disk is the one that has data written in, the data must be recovered immediately. Stripe numbers and disk numbers of blocks that need to be recovered can be calculated with the pointer 𝑃LBA :
3.2.1. Write to the First Group. When writing to the disks in the first group, blocks and parity blocks are empty, so the parity calculation is 𝑆𝑃new = ⨁ 𝐷𝑖 , 𝑖
𝑁𝐺 −1
𝑆𝑃𝑠 = ⨁ 𝐵𝑖,𝑠 ,
(12)
𝑖=0
where 𝑆𝑃𝑠 and 𝐵𝑖,𝑠 are the parity block and the data block in disks of the first group, respectively. Disk number 𝑖 and stripe number 𝑠 can locate the block exactly. And 𝑁𝐺 is the amount of disks in the group. After calculating the parity, the data and parity in the array are written. We can safely say that it can minimize the write penalty since read operations are not needed. Parity blocks need to be calculated while writing in the first group and the others, but they are different. 3.2.2. Write to the Other Groups. When writing to the disks in the other groups, parity blocks can be computed by XORing the old parity and the new data. Its calculation is 𝑆𝑃new = 𝐷new ⊕ 𝑆𝑃old .
(13)
Suppose that write requests lie in group 𝑔. We can easily transform formula (12) into the following form: 𝑆𝑃𝑠 new = (
𝑔∗𝑁𝐺 −1
⨁
𝑖=(𝑔−1)∗𝑁𝐺
𝐵𝑖,𝑠 ) ⊕ 𝑆𝑃𝑠 old .
(14)
𝑠=⌊
𝑃LBA − 𝐿 𝐺𝑔 𝑁𝐺
⌋, (15)
𝑑 = ((𝑃LBA − 𝐿 𝐺𝑔 ) mod𝑁𝐺𝑔 ) + 𝑔 ∗ 𝑁𝐺, where 𝑁𝐺 and 𝑔 are the amount of disks in a group and the active group number, respectively. 𝑔 can be calculated as 𝑔=⌊
𝑃LBA ⌋, 𝑆 ∗ 𝑁𝐺
(16)
where 𝑆 is the amount of stripes in the array. 𝐿 𝐺𝑔 is the starting logical address of the group: 𝐿 𝐺𝑔 = 𝑔 ∗ 𝑆 ∗ 𝑁𝐺.
(17)
Then, how to recover the data depends on whether the disk is in group 𝑔 or not. (a) The Failure Disk Is in Group 𝑔. Data blocks from stripe0 to stripe𝑠 should be recovered if the failure disk is in group 𝑔. Data is recovered by XORing the blocks from group0 to
6
Journal of Electrical and Computer Engineering
group𝑔 and the parity in the same stripe. Suppose that the number of the failure disks is 𝐼; then,
Table 1: The characteristic of the server.
𝐵𝑖,𝑚 = 𝐵0,𝑚 ⊕ 𝐵1,𝑚 ⊕ ⋅ ⋅ ⋅ ⊕ 𝐵𝑖−1,𝑚 ⊕ 𝐵𝑖+1,𝑚 ⊕ ⋅ ⋅ ⋅ ⊕ 𝐵(𝑔+1)∗𝑁𝐺 −1,𝑚
(0 ≤ 𝑚 ≤ 𝑠) ,
(18)
where 𝑚 is the stripe number. As shown in Figure 5, suppose that disk 𝐷3 fails while data is written to 𝐵2,2 and 𝐵3,2 . After the failure disk is replaced, 𝐵3,0 , 𝐵3,1 , and 𝐵3,2 will be recovered: (𝑚 = 0, 1, 2) .
𝐵3,𝑚 = 𝐵0,𝑚 ⊕ 𝐵1,𝑚 ⊕ 𝐵2,𝑚 ⊕ 𝑆𝑃𝑚
(19)
The rest stripes in the failure disk are empty, so the blocks in these stripes need not be recovered. (b) The Failure Disk Is Not in Group 𝑔. If the failure disk does not belong to group 𝑔, all the blocks in the disk need to be recovered. Suppose that the max. stripe number is 𝑆. Data from stripe0 to stripe𝑠 are recovered by XORing the blocks from group0 to group𝑔 and the parity block in the same stripe using the formula (18). Data from stripe𝑠+1 to stripe𝑆 are recovered by XORing the blocks from group0 to group𝑔−1 and the parity block in the same stripe: 𝐵𝑖,𝑚 = 𝐵0,𝑚 ⊕ 𝐵0,𝑚 ⊕ ⋅ ⋅ ⋅ ⊕ 𝐵𝑖−1,𝑚 ⊕ 𝐵𝑖+1,𝑚 ⊕ ⋅ ⋅ ⋅ ⊕ 𝐵(𝑔+1)∗𝑁𝐺 −1,𝑚 ⊕ 𝑆𝑃𝑚
(𝑠 < 𝑚 ≤ 𝑆) .
(20)
Suppose that disk 𝐷1 fails; data are recovered as follows: 𝐵1,𝑚
{𝐵0,𝑚 ⊕ 𝐵2,𝑚 ⊕ 𝐵3,𝑚 ⊕ 𝑆𝑃𝑚 ={ 𝐵 ⊕ 𝑆𝑃𝑚 { 0,𝑚
(𝑚 = 0, 1, 2) (𝑚 = 3, 4) .
(21)
(3) Parity Disk. If the parity disk fails, the disk should be replaced and the parity data should be recalculated. The parity data from stripe0 to stripe𝑠 is recalculated with the data of group0 to group𝑔 , and the parity data from stripe𝑠+1 to stripe𝑆 is recalculated with the data of group0 to group𝑔−1 in the same stripe: 𝑆𝑃𝑚 = 𝐵0,𝑚 ⊕ 𝐵1,𝑚 ⊕ 𝐵(𝑔+1)∗𝑁𝐺 −1,𝑚 𝑆𝑃𝑚 = 𝐵0,𝑚 ⊕ 𝐵1,𝑚 ⊕ 𝐵𝑔∗𝑁𝐺 −1,𝑚
(0 ≤ 𝑚 ≤ 𝑠) ,
(𝑠 < 𝑚 ≤ 𝑆) .
(22)
For example, if parity disk 𝑃 (as shown in Figure 4) fails, the parity data will be recalculated as follows: {𝐵0,𝑚 ⊕ 𝐵1,𝑚 ⊕ 𝐵2,𝑚 ⊕ 𝐵3,𝑚 𝑆𝑃𝑚 = { 𝐵 ⊕ 𝐵1,𝑚 { 0,𝑚
(𝑚 = 0, 1, 2) (𝑚 = 3, 4) .
(23)
Above all, when a disk in HS-RAID2 fails, data recovery need to read less data and do less calculation than in HSRAID or RAID. It is easy to understand that it can reduce the recovery time, degrade the energy-consuming, and improve the reliability of the storage system.
Description Model CPU Interface
Value HP ProLiant DL180 Xeon E5620, 2.4 GHz SATA/SAS Table 2: The characteristics of the SSD.
Description SSD model Standard interface Size Average access time Startup power
Value Crucial CT128M4SSD2 SATA3.0 128 G