Publications of the Astronomical Society of the Pacific, 110:31–38, 1998 January q 1998. Astronomical Society of the Pacific. All rights reserved. Printed in U.S.A.
Hubble Space Telescope/Faint Object Spectrograph Imaging of Wolf 424 AB: Is This Binary a Double Brown Dwarf System?1 A. B. Schultz, H. M. Hart, J. L. Hershey, F. C. Hamilton, and M. Kochte Astronomy Programs, Computer Sciences Corporation, Space Telescope Science Institute, 3700 San Martin Drive, Baltimore, MD 21218;
[email protected],
[email protected],
[email protected],
[email protected],
[email protected]
F. C. Bruhweiler Institute for Astrophysics and Computational Sciences, Department of Physics, Catholic University of America, Washington, DC 20064;
[email protected]
G. F. Benedict McDonald Observatory, University of Texas, Austin, TX 78712-1083;
[email protected]
John Caldwell and C. Cunningham York University, Toronto, M3J 1P3 Ontario, Canada;
[email protected],
[email protected]
O. G. Franz Lowell Observatory, Flagstaff, AZ 86001;
[email protected]
C. D. Keyes Space Telescope Science Institute, 3700 San Martin Drive, Baltimore, MD 21218;
[email protected]
and J. C. Brandt LASP, University of Colorado, Boulder, CO 80309-0392;
[email protected] Received 1997 July 23; accepted 1997 October 30
ABSTRACT. The low-mass binary system Wolf 424 AB (GJ 473 AB) was spatially resolved in an image obtained on 1996 April 16 with the imaging mode of the Hubble Space Telescope Faint Object Spectrograph. The separation was measured to be 00.42 5 0 0. 03 at a position angle of 3537.2 5 2 7. 5. The new measurement was combined with previously published orbital positions to update the orbital elements and obtain an estimate of the total mass. Spectroscopy and photometry of these objects suggest they are nearly equal in mass. The derived orbital solution, using all of the observations since 1938 appropriately weighted, yields a total mass of m 1 1 m 2 of 0.143 M,, and component masses of ∼0.07 M,, just under the theoretical limit for a brown dwarf. An alternate orbital solution derived solely from speckle observations since 1986 and the Faint Object Spectrograph image yields a total mass of 0.232 M,, placing both components well above the brown-dwarf limit. The mass depends on the value for the semimajor axis, which is controlled in the latter solution by an optical speckle observation made near the last period of maximum separation. Further high-resolution observations during the upcoming maximum separation, and through the next secondary maximum, are needed to constrain the orbit.
1. INTRODUCTION
target acquisition capabilities of the FOS. These capabilities, which are summarized below, together allow efficient use of HST to mask a bright star and observe the region within ∼10 of that star to a fainter limiting magnitude than could be attained with any other instrument on HST at that time. Wolf 424 AB is a known binary with a published orbit (Heintz 1989). The two stars have nearly equal magnitudes and are less than 10. 0 apart at maximum separation. The pair is easy to split in any HST imaging instrument. We observed Wolf 424 AB as a calibration target in order to determine how well the on-board software could position the telescope to occult the
On 1996 April 16, an image was obtained of the low-mass binary system Wolf 424 AB with the Faint Object Spectrograph (FOS) on board the Hubble Space Telescope. The image was made as part of a campaign to search for faint companions to nearby low-mass stars using the coronographic and on-board 1
Based on observations with the NASA/ESA Hubble Space Telescope, obtained at the Space Telescope Science Institute, which is operated by the Association of Universities for Research in Astronomy, Inc., under NASA contract NAS5-26555.
31
32 PASP, 110: SCHULTZ ET AL. brighter of the two stars with the coronographic bar and to determine how well stars with known separations and magnitudes could be distinguished in an FOS image. The target was acquired correctly. Two images were obtained, one with the coronographic bar aperture, and one with the large science aperture. The intended use of the coronographic bar was compromised because the bar occulted both components. The unintended occultation of both components prompted us to make an in-depth analysis of the image obtained with the large science aperture, in which both objects are spatially resolved. The separation and position angle were determined, and new orbital elements were derived. The data obtained with the coronographic aperture will be presented in the summary paper (Hart et al. 1998, in preparation). In this paper, we present the FOS image, updated orbital parameters derived from all the published data, and a dynamical mass determination for the system. 2. WOLF 424 AB: A DOUBLE BROWN DWARF SYSTEM? In recent years, much attention has been devoted to determining the nature of the faint end of the stellar mass-luminosity relation (cf. Basri et al. 1996). An object with a mass higher than the theoretical minimum mass of about 0.08 M, can sustain hydrogen fusion once it reaches the main sequence, while an object with a mass below this limit cannot (D’Antona & Mazzitelli 1985; Stringfellow 1991; Burrows & Liebert 1993). These low-mass objects have been labeled “brown dwarfs” and bridge the gap between low-luminosity stars and giant planets. What presumably distinguishes brown dwarfs from giant planets is that they form like stars and not in a protoplanetary disk about a central object. Brown dwarfs are important not only to understand star formation and the faint end of the luminosity function, but also to constrain stellar models at the low mass-luminosity boundary between stars and the domain of giant planets. In addition, large numbers of unobserved, low-luminosity brown dwarfs may provide some of the “missing mass” inferred by both galactic dynamics and cosmology (Mihalas & Binney 1981; Bahcall 1984; Bahcall et al. 1994; Alcock et al. 1996), one of the most important problems in astrophysics. The binary star Wolf 424 AB (Gliese 473 AB) is a lowmass system where both components may be brown dwarfs. Heintz (1972, 1989) used photographic and visual micrometer observations spanning 50 years (1938–1988) to determine the orbital elements of the system. The orbital period was determined to be 16.2 yr. Heintz (1989) estimated the component dynamical masses for A and B to be 0.059 and 0.051 M,, respectively, well within the realm of brown dwarfs. In subsequent years, observations that resolved the two components were made using optical and infrared speckle techniques. Blazit, Bonneau, & Foy (1987), observing in the optical, made one measurement near the predicted time of apastron. Henry et al. (1992) made several observations in the infrared near the
predicted time of periastron. Henry et al. reported a discrepancy between the observed infrared position of component B and the position predicted from Heintz’s orbit, such that B was always about 207 ahead of the predicted position. They found that a semimajor axis larger than that reported by Heintz was more consistent with their data and with the speckle observation of Blazit et al. They determined that an increase in the reported semimajor axis by 3 j would increase the component masses to 0.093 and 0.082 M,, placing A and possibly B in the stellar mass realm. Balega et al. (1994) reported an optical speckle measurement of the separation and position angle for Wolf 424 AB made near the predicted time of periastron. The observation was made as part of a program to resolve a large number of close binaries, and no orbital interpretations were made. The masses of the Wolf 424 AB components were also estimated spectroscopically (Davidge & Boeshaar 1991) and photometrically (Henry et al. 1992). Davidge & Boeshaar (1991) examined the 2 mm spectrum for three similar stars (Wolf 424 AB, GL 65 AB, and GL 866 AB), comparing the depth of absorption for several features in that region that are sensitive to surface gravity, log(g). The components of GL 65 AB were both found to be stellar with masses of 0.101 and 0.099 M, for A and B, respectively (Geyer, Harrington, & Worley 1988). Davidge & Boeshaar found that the surface gravity of the Wolf 424 AB components was within a factor of 2 of that of the components of GL 65 AB, indicating that the Wolf 424 AB components are also of stellar mass. They noted that the similar surface gravities did not rule out substellar masses for the components of Wolf 424 AB. However, if the components were substellar, then the pair would be highly luminous, which requires that the system be younger than ∼0.1 Gyr. Davidge & Boeshaar conclude that a young age for Wolf 424 AB is possible, but unlikely. Later, Henry et al. (1992) noted that the red/infrared spectrum of the Wolf 424 AB was “virtually indistinguishable” from that of GL 65 A, strengthening the case for similar, hence stellar, masses for Wolf 424 AB. A photometric estimate of the masses of the components of Wolf 424 AB was made by Henry et al. (1992) based on the magnitude difference measured between the individual components in infrared speckle observations made over a period of 8 yr. These magnitude differences were converted to absolute magnitudes, which were used with a mass-luminosity relation and the parallax reported by Heintz (1989) to determine the masses of the Wolf 424 AB components: 0.13 and 0.12 M, for A and B, respectively. Henry et al. pointed out that the mass-luminosity relation had been derived for disk-age stars, and so they could not rule out substellar masses for the components if the Wolf 424 AB system is younger than ∼0.1 Gyr. 3. OBSERVATIONS AND IMAGE ANALYSIS The FOS was rarely used as a camera, so it is appropriate to summarize some of the relevant capabilities here (Hart et al. 1995; Hart et al. 1996). For a detailed description, see the
1998 PASP, 110:31–38
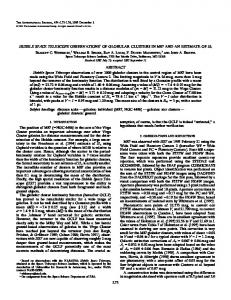
WOLF 424 AB 33 FOS Instrument Handbook (Keyes et al. 1995). The FOS used Digicon detectors. The red-side detector was sensitive to light ˚ , with peak sensitivity shortward of 4500 from 1800 to 8500 A ˚ . The largest aperture was a square 30. 8 on a side. The aperture A wheel included the Large Barred aperture, which was a square 10. 7 on a side bisected by a coronographic bar 00. 27 wide. The detector counted photoelectron pulses in a linear array of silicon diode channels. Each diode had a projected area of 00. 3 # 10. 2. In acqimage mode, the camera mirror was used to focus an image of the aperture onto the photocathode. No filters or gratings were available for use in this mode. The output from the photocathode was substepped across the diode array, with a separate integration readout made at each step. A given point in the aperture was sampled four times in the X-direction, and 16 times in the Y-direction. The FOS plate scale across the image was 00. 0812 5 00. 0002 in the Y-direction and 00. 0752 5 00. 0009 in the X-direction, and the plate scale was nearly uniform across the field of view of the large science aperture (Koratkar et al. 1994). The image of Wolf 424 AB was obtained on 1996 April 16, with the FOS in acqimage mode, using the 30. 8 square large science aperture. The total exposure duration was 20 s, or 0.078 s per pixel. Average counts of 1600 to 1675 per pixel were measured for each star. These pixel counts represent the total counts incident on the diode during an integration step. The background count rate was less than 1 per integration step. Both members of Wolf 424 AB were clearly resolved and detected at ample signal-to-noise. The components were identified from the total counts. Component A was about 5% brighter than B, a difference well above the statistical noise level in the peak pixels. This identification also places B in the expected quadrant of the orbit. The image was processed with the stsdas software task “tarestore” to deconvolve the diode shape, restoring the intensity from a given location in the aperture to the correct pixel in the image. The reconstructed image covers a field of view 30. 8 on a side with a spatial scale of 00. 077 per pixel. The reconstructed image of Wolf 424 AB is shown in Figure 1. The pair is clearly resolved. The FWHM of the stellar point spread function (PSF) in the reconstructed image was found to be 3.18 pixels (or 00. 24). This FOS PSF is comparable to the measured HST radial PSF, as determined from WFPC2 images (70% of the light from a point source within a radius of 00. 1). The position of each object in the image was determined by computing the count-weighted centroid of the region within a 3 pixel radius from the brightest pixel. A 3 pixel radius was chosen because the stars are separated by about 5 pixels. The centroiding technique is accurate to about a quarter of a pixel. The separation between the components was found to be 5.40 5 0.35 pixels, or 00. 416 5 00. 027. The position angle of component B was found to be 3537. 2 5 27. 5. The position angle was derived by first computing the orientation of the components in the image and then
1998 PASP, 110:31–38
Fig. 1.—Reformatted HST FOS image of Wolf 424 AB. The binary pair is resolved in this 20.0 s exposure in the FOS large science aperture. The image scale is ∼07. 08 pixel21. The components have nearly equal brightness. The choppy noise above and below the targets is an artifact of the reconstruction software used to deconvolve the FOS diode shape from the image.
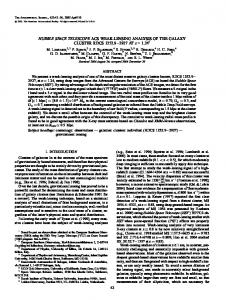
translating this angle to equatorial coordinates. The uncertainty derives from the uncertainties in separation and telescope roll angle and is dominated by the uncertainty in separation. The uncertainty in telescope roll angle was determined to be K07. 5, based on an extreme worst-case scenario for a successful acquisition of the correct guide stars, which would nevertheless leave the telescope roll angle skewed as much as possible. The relative position of component B measured from the FOS image is marked in Figure 2. Also marked is the relative position predicted by Heintz’s (1989) orbit for time of the observation (r 5 07. 22, PA 5 117. 0). The orbital motion of Wolf 424 AB is retrograde, i.e., proceeds toward smaller position angle, so the measured position leads the predicted position by about 187. This difference in predicted and observed position is of the same magnitude and direction as the discrepancy reported by Henry et al. (1992) for their two-dimensional speckle observations. 4. ORBITAL FITTING AND DYNAMICAL MASSES We used the reported photographic, visual, and optical and infrared speckle observations of relative positions of the Wolf 424 AB system (Heintz 1972; Blazit et al. 1987; Heintz 1989; Henry et al. 1992; Balega et al. 1994) combined with the HST FOS position to determine an orbit solution for Wolf 424 AB. The observations are listed in columns (1)–(5) of Table 1. The position angles from Blazit et al. (1987) and Balega et al. (1994) were not specifically reported as equator 2000; however, any correction is small (207. 03 at most) and can be ignored. The published relative positions are shown in Figure 2. Different symbols are used to distinguish the instrumental categories of data: photographic and visual, speckle, and the FOS
34 PASP, 110: SCHULTZ ET AL.
Fig. 2.—Wolf 424 AB observed relative positions and orbital fits. The relative positions are marked by the type of source data (filled triangle, photographic and visual: filled circle, infrared and optical speckle; see also Table 1). The position measured from the FOS image is marked (1); the position at the time of the FOS observation as predicted by the Heintz (1989) orbit is also marked (#). The orbit from Heintz (1989) is indicated with a dotted line. Orbit 1, derived using all the observations, is indicated with a solid line. Orbit 2, derived from the speckle observations and the FOS image only, is indicated with a dot-dashed line.
image. The photographic and visual points are grouped together because they are intermixed over the same observing period and because they form the basis of the orbital derivation made by Heintz (1972, 1989). One of the points from Henry et al. (1992) is a speckle image taken in such good seeing that no Fourier transform was needed; this point is referred to here as a speckle observation. The photographic and visual data extend back to 1938, spanning three orbital periods. These data lie predominantly in the fourth quadrant, in which the maximum separation is located. The components were not resolved in the photographic measurements. The photographic and visual measurements exhibit considerable scatter, by which we mean differences in consecutive measurements that are greater than the reported formal error in the measurements (for example, see the sequence of observations in the 1950s, listed in Table 1). The components were resolved by the speckle observations and by the FOS image. These data extend back only to 1986, near the most recent time of maximum separation, span about 3/4 of an orbital period, and cover all four quadrants. Scatter among the measurements is meaningful only for the sets of IR speckle observations obtained in 1990 and 1991 by Henry et al. (1992). There is some scatter in these measurements (for example, the separations measured in 1991.32), although it is much smaller than that seen in the photographic and visual measurements.
The orbital fit was derived using a computer algorithm that simultaneously solves for the differential corrections to all seven orbital elements and then iterates to convergence (after van den Bos 1926). The individual observations (position angle and separation on a given date) are weighted to reflect their overall quality. This algorithm is quite different than that used by Heintz (1972), who fitted the semimajor axis for the orbit more to the visually measured separations, leaving the photographic separations slightly on the small side and giving better agreement with the observed absence of elongation during certain years. Selective weighting in that manner is not possible when all variables are solved for simultaneously. To compare our algorithm to that used by Heintz, we fitted an orbit to the photographic and visual observations alone, with weights fixed approximately to the year-average weights reported by Heintz (1972). The solution was fairly close to that reported by Heintz. The major differences were the semimajor axis, which was considerably smaller (00. 65 vs. 00. 76 for Heintz 1972 and 00. 71 for Heintz 1989), and the eccentricity, which was also smaller (0.25 vs. 0.28 for Heintz 1972, 1989). This is consistent with the effect we expected, given the differences in the algorithms. In our analysis orbital fits were strongly dependent on the weights assigned to the observations. Several weighting schemes were tried, and a set of rules was devised for choosing among the resulting orbits. An orbital fit for a given weighting scheme was deemed acceptable only if it could meet the following criteria: (1) stability of orbital solution; (2) direct consideration of all existing data; (3) better prediction of the FOS position than the existing orbit; (4) better prediction of the twodimensional positions of Henry et al. (1992) than the existing orbit; (5) agreement with the times when Heintz (1972, 1989) noted an absence of elongation in the photographic images of the pair. Predicted separations smaller than 00. 35 were considered to be consistent with an “absence of elongation in the image.” This limit was determined from analysis of the scatter in the minimum separations reported by Heintz (1972). A statistical approach to assigning the weights resulted in an orbit that met all six of our criteria for a good fit. The weights were assigned in an iterative process. All observations were weighted equally in the first pass. This resulted in an orbit that failed most of the criteria—in particular, the prediction for the time of the FOS observation was much worse than the prediction from the existing orbit. In the next iteration, the weight was set to 0 for all points with residuals more than 4 j from the fit. Many of these points also had large residuals in the fit made by Heintz (1972). Blazit’s point (1986.5), which has a separation larger than all but one of the previous measurements, was also weighted 0 by this criterion. The residuals for the photographic and visual points were found to be about 5 times larger than the residuals for the resolved points. Strict adherence to statistical theory would indicate that in the next fit the photographic and visual points should be weighted at 0.04. Such a low weight essentially removes them from the solution. Because of the concentration of photographic and
1998 PASP, 110:31–38
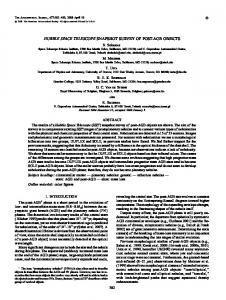
WOLF 424 AB 35 TABLE 1 Wolf 424 Observations and Orbital Fits Orbit 1 Fit and Residualsa
Observations
Orbit 2 Fit and Residualsa
Date (1)
v2000 (deg) (2)
r (arcsec) (3)
Typeb (4)
References (5)
Weight (6)
Dv (deg) (7)
Dr (arcsec) (8)
Weight (9)
Dv (deg) (10)
Dr (arcsec) (11)
1938.34 . . . . . . . . . 1938.42 . . . . . . . . . 1939.18 . . . . . . . . . 1940.16 . . . . . . . . . 1941.18 . . . . . . . . . 1941.48 . . . . . . . . . 1946.20 . . . . . . . . . 1950.13 . . . . . . . . . 1952.29 . . . . . . . . . 1952.37 . . . . . . . . . 1952.53 . . . . . . . . . 1953.21 . . . . . . . . . 1954.15 . . . . . . . . . 1955.38 . . . . . . . . . 1956.17 . . . . . . . . . 1956.33 . . . . . . . . . 1960.30 . . . . . . . . . 1965.18 . . . . . . . . . 1965.40 . . . . . . . . . 1966.29 . . . . . . . . . 1967.18 . . . . . . . . . 1968.20 . . . . . . . . . 1969.16 . . . . . . . . . 1970.32 . . . . . . . . . 1971.30 . . . . . . . . . 1979.18 . . . . . . . . . 1984.50 . . . . . . . . . 1985.32 . . . . . . . . . 1986.4499 . . . . . . 1987.72 . . . . . . . . . 1990.1808 . . . . . . 1990.1838 . . . . . . 1990.3589 . . . . . . 1991.3205 . . . . . . 1991.3233 . . . . . . 1991.4219 . . . . . . 1993.3514 . . . . . . 1996.2923 . . . . . .
321.7 321.2 316.1 311.4 300.3 249.0 126.4 335.6 325.0 326.3 294.2 323.8 316.7 338.7 316.9 315.8 169.3 353.1 0.0 343.5 329.2 326.9 328.6 324.5 320.2 125.8 324.0 330.8 322.7c 312.8 248.0 246.0 226.0 164.0 164.0 161.6 135.8 353.0
0.72 1.10 0.81 0.73 0.29 0.30 0.45 0.70 0.80 0.69 0.51 0.68 0.73 0.73 0.43 0.44 0.80 0.37 0.20 0.56 0.72 0.73 0.77 0.84 0.68 0.35 0.87 0.86 1.098 0.81 0.179 0.177 0.177 0.343 0.374 0.436 0.602 0.41
P V P P P V P P V P V P P P P P V V P P P P P P P P P V opt/spk P ir/spk ir/spk ir/spk ir/spk ir/spk ir/ccd opt/spk FOS
1 1 1 1 1 1 1 1 1 1 1 1 1 1 1 1 1 1 1 1 1 1 1 1 1 2 2 2 3 2 4 4 4 4 4 4 5 6
0.2 0 0.2 0 0 0 0.2 0 0.2 0.2 0 0.2 0 0 0 0 0 0 0.2 0.2 0.2 0.2 0.2 0.2 0.2 0.2 0.2 0.2 0 0.2 0.6 0.6 0.6 0.6 0.6 0.6 0.6 1.
25.7 25.8 27.9 29.0 216.0 265.9 230.7 246.6 28.6 26.8 237.9 24.8 28.0 18.5 20.1 20.5 228.6 237.1 214.1 21.9 26.3 22.5 3.3 3.6 3.1 9.1 20.5 9.3 5.6 2.3 10.6 8.9 6.5 20.3 20.2 20.2 0.1 1.7
20.16 0.21 20.13 20.21 20.58 20.53 0.02 0.49 0.09 20.03 20.24 20.17 20.20 20.21 20.45 20.42 0.59 0.17 20.03 0.11 0.07 20.10 20.15 20.11 20.20 0.03 20.06 20.09 0.21 0.11 20.00 20.01 20.01 20.01 0.02 0.06 0.09 0.03
0 0 0 0 0 0 0 0 0 0 0 0 0 0 0 0 0 0 0 0 0 0 0 0 0 0 0 0 1 0 1 1 1 1 1 1 1 1
20.8 21.1 23.7 23.9 26.2 252.6 23.5 20.4 23.0 21.5 233.2 21.7 26.2 20.0 2.1 1.1 18.7 10.7 19.6 8.7 22.0 21.2 3.2 2.4 1.5 52.3 23.0 6.0 1.2 23.7 25.8 24.1 23.5 0.3 0.4 0.2 22.8 20.3
20.40 20.02 20.20 20.08 20.24 20.14 20.00 20.14 20.35 20.47 20.66 20.50 20.40 20.23 20.36 20.31 0.21 20.25 20.48 20.33 20.33 20.42 20.41 20.27 20.29 0.16 20.30 20.31 0.01 20.05 20.00 20.00 0.01 20.05 20.02 0.01 0.02 0.00
Residuals Dv and Dr are the observed minus the computed (O 2 C) values. Type of observation: photographic (P), Visual (V), optical speckle (opt/spk), infrared speckle (ir/spk), infrared ccd image (ir/ccd), and HST FOS imaging (FOS). c The published position angle was changed by 1807 to bring it into the same quadrant as the predicted position. This altered value is also used in Fig. 2. References.—(1) Heintz 1972; (2) Heintz 1989; (3) Blazit et al. 1987; (4) Henry et al. 1992; (5) Balega et al. 1994; (6) this paper. a
b
visual points in the fourth quadrant and their long time coverage, their removal from the solution would mean a loss of information about the period. To retain some influence from this important subset of the data, we decided to set the weights for the remaining photographic and visual points to 0.2. The remaining speckle points were weighted 3 times as heavily as the photographic and visual points, and the FOS point was
1998 PASP, 110:31–38
weighted 5 times as heavily. The speckle points, as a group, were weighted less than the FOS point for two reasons. First, there is no assigned error for Balega et al.’s point (1993), so we cannot judge it relative to the other speckle points. However, we also cannot find a reason to judge it separately from the other speckle points. Second, the scatter seen in the separations measured on consecutive nights by Henry et al. is more than
36 PASP, 110: SCHULTZ ET AL. TABLE 2 Orbital Elements for Wolf 424 AB Element
Heintz (1989)
Orbit 1
Orbit 2
Period P . . . . . . . . . . . . . . . . . . . . . . . . . . . . . . Epoch of periastron T . . . . . . . . . . . . . . . . Semimajor axis a (arcsec) . . . . . . . . . . . Eccentricity e . . . . . . . . . . . . . . . . . . . . . . . . . Inclination i (deg) . . . . . . . . . . . . . . . . . . . . Argument of periastron q . . . . . . . . . . . . Position angle of node Q (deg) . . . . . . Total mass m1 1 m2 (M,) . . . . . . . . . . . .
16.2 yr 1977.8 0.715 5 0.04 0.28 103 20 151 0.110 5 0.01a
15.2 5 0.1 yr 1977.7 5 0.7 0.747 5 0.02 0.27 5 0.01 105.0 5 1.3 3.79 5 8.0 142.26 5 1.9 0.143 5 0.012b
15.9 5 0.9 yr 1976.6 5 0.9 0.907 5 0.05 0.30 5 0.03 102.3 5 0.8 27.2 5 6.0 143.0 5 1.9 0.232 5 0.046b
a b
Error quoted by Heintz 1989. Error propagated from period and semimajor axis.
twice the quoted error of 4% on at least one occasion (1991.3205 and 1992.3233). These two circumstances lead us to have somewhat less confidence in the speckle points than in the (admittedly singular) FOS point. The resulting orbit, hereafter referred to as orbit 1, matched all our criteria for a good fit. The weights used in the fit, and the residuals to the fit for all points, are shown in columns (6)–(8) of Table 1. The new orbital elements are presented as orbit 1 in Table 2. For comparison, the elements previously derived by Heintz (1989) are also shown. Orbit 1 has a somewhat shorter period than the previous orbit, and a somewhat larger semimajor axis, and the longitude of periastron has shifted by 167. The values for the parallax p 5 00.233 5 00. 004 and the fractional mass f 5 0.47 5 0.01 were taken from Heintz (1989). The semimajor axis of the orbit is thus 3.2 AU. The total mass of the system from Kepler’s third law is 0.143 M,, yielding component masses of 0.076 and 0.067 M,. Several other fits were attempted during our analysis, using subsets of the data or different weighting schemes. These orbits failed the test of stability of the solution, or failed to predict the FOS point better than the existing orbit. One of these alternate fits deserves mention, however. Heintz (1972) noted that the photographic measurements for Wolf 424 AB appeared to underestimate the actual separation. This would create a systematic difference between the photographic points and the rest of the data set, so that any solution that considered all of the data would be subject to error. Such a systematic difference is suggested by the outlying positions of the speckle observations in quadrants 2 and 4. The speckle points outlie even the visual micrometer points against which Heintz was comparing the photographic points, indicating that the visual points might also underestimate the separation. To investigate this possibility, an orbital solution was derived using only the speckle data points and the FOS image. The point measured by Blazit et al. (1987) was included because the ground rules adopted for this new analysis gave us no reason to exclude it. Since there was at least one observation in each quadrant, the possibility of a stable fit was good. Despite the paucity of observations, a very good fit was obtained, which violates only our requirement of direct consideration of all the
data. The residuals for this orbit, hereafter called orbit 2, are included in columns (9)–(11) of Table 1. This orbit predicts much larger separations than those measured from the photographic and visual observations. The FOS point and all of the speckle points were fitted very well. The elements for orbit 2 are listed in Table 2. Again adopting Heintz (1989) values for parallax and fractional mass, the semimajor axis for orbit 2 is 3.9 AU; the total mass of the system from Kepler’s third law is 0.232 M,, yielding component masses of 0.123 and 0.109 M,. 5. DISCUSSION One of our criteria for an acceptable orbital fit was improved prediction of the relative position of component B as measured in our FOS image. The residuals of the fit for orbits 1 and 2 for the FOS measurement (and for all measurements) are listed in Table 1. The residual of the FOS point for Heintz’s orbit is 1187, 100. 20. The residuals for orbits 1 and 2 are much smaller, and both orbital fits predict the FOS point much better than the original orbit. Orbit 1 was derived using all of the data points, excepting outliers, as discussed in the previous section. Most of these outliers also showed large residuals for the original orbit (Heintz 1972). The period for orbit 1 is about 1 year shorter than that found by Heintz. As a result, some of the predictions of when the image of the pair should have been round in the photographic record are slightly shifted. The 1963–1966 round image is predicted better by orbit 1 than by the original orbit, but it also predicts a secondary maximum separation during 1947–1948 when a round image was observed. This 1947–1948 prediction is not much worse than the prediction from Heintz’s orbit. Otherwise, orbit 1 meets all our criteria for an acceptable orbit and is a good fit to the data. Orbit 2 was derived using only the speckle and FOS observations, on the possibility that the photographic observations in general underestimate the separation, as was suggested by Heintz (1972), and that the visual micrometer observations also underestimate the separation, as was suggested in § 4. The period for this orbit is only 0.3 yr shorter than Heintz’s period,
1998 PASP, 110:31–38
WOLF 424 AB 37 and the semimajor axis is 27% larger. It therefore shows the same inconsistencies with the observed round image periods as Heintz’s orbit, only exaggerated by the much larger semimajor axis. This orbit predicts the 1927 observation of a round image very well, and it predicts the maximum separation observed in 1937, although the predicted separation is about 20% larger than the observed (see Heintz 1972). Orbit 2 predicts maximum separations of nearly 10. 2, violating Heintz’s firm upper limit of 10. 0, based on analysis of the shape of the images of the pair in photographs spanning 4 decades (Heintz 1972). This orbit also overestimates the N-S separations seen in the one-dimensional IR speckle observations reported by Henry et al. (1992). We note that Heintz’s 1972 orbit predicts these N-S separations better than either orbit 2 or orbit 1, which underestimates them. The semimajor axis for orbit 2 is obviously too large. The value for the semimajor axis in the fit is controlled by the 1986.5 optical speckle observation of Blazit et al. (1987) and by 1993.35 optical speckle observation by Balega et al. (1994). Blazit’s measurement would need to be reduced by about 10% to bring the orbit in line with a maximum separation less than 10. 0. These problems with orbit 2 lead us to reject it at this time. Observations that resolve the objects are needed during the upcoming years around maximum separation to firmly establish the semimajor axis. The total mass for the system is listed in Table 2 for Heintz’s orbit, and for orbits 1 and 2. The errors quoted for orbits 1 and 2 are the formal errors computed from the uncertainty in the period and the semimajor axis. The total mass reported by Heintz (1989) is about 3 j from the masses derived for orbits 1 and 2, based on the uncertainties for those orbits, not the uncertainty reported for Heintz’s orbit. The mass derived for orbit 2 is almost certainly too large, given the problems with that orbit discussed above. The component masses derived for orbit 1 are 0.076 5 0.008 and 0.067 5 0.008 M, for A and B, respectively. These masses are only 1–2 standard deviations under the theoretical minimum mass of about 0.08 M, required to sustain hydrogen fusion (D’Antona & Mazzitelli 1985; Stringfellow 1991; Burrows & Liebert 1993). The mass error is dominated by the uncertainty in the semimajor axis derived for the orbit. The final classification of these objects currently places them slightly into the realm of brown dwarfs, but the sensitivity of that identification to the size of the semimajor axis underlies the need to continue to make high-resolution measurements of this pair in the upcoming decade. 6. SUMMARY We present new HST FOS imaging that clearly resolves the components of Wolf 424 AB. Relative to A, component B is at a position angle of 3537. 0 5 27. 5 with a separation of 00. 42 5 00. 03.
1998 PASP, 110:31–38
The Wolf 424 AB orbital solution of Heintz (1989) indicates that the masses of the components are substellar. Speckle observations are more consistent with a larger semimajor axis than that derived by Heintz, which, if the original period is correct, indicate that the masses are stellar (Henry et al. 1992). Stellar masses for the Wolf 424 AB components are also consistent with spectral and photometric estimations of the mass, unless the system is very young, which seems unlikely but cannot be ruled out (Davidge & Boeshaar 1991; Henry et al. 1992). The speckle observation made by Blazit et al. (1987), by Balega et al. (1994), and the FOS observation reported here are consistent with the interpretation of Henry et al. (1992). The Wolf 424 AB system can be characterized as two components with nearly equal brightness (luminosity) and mass. The FOS position combined with the reported photographic, visual, and optical and infrared speckle observations yields new orbital elements and a revised estimate of the component masses. Depending upon the points selected and the adopted weights, the total mass estimate of the system (m1 1 m2 ) ranges from a low of 0.143 M, to a high of 0.232 M,. Our best-fit, orbit 1 (see Table 2 and Fig. 2), using all the available data and a semistatistical weighting scheme, indicates the components of Wolf 424 AB are marginally substellar, with a combined total mass of 0.143 M, and likely individual masses of 0.076 and 0.067 M,. Substellar masses for the components of Wolf 424 AB indicate that this system should be very young, less than 0.1 Gyr (Davidge & Boeshaar 1991). The uncertainties in the photographic, visual, and optical and IR speckle data still do not rule out the possibilities that the components are more massive than 0.08 M,, and therefore stellar. Indeed, given the solution for orbit 2, which was derived using only the speckle observations and the FOS image, one can still argue for this interpretation. In any event, the accurate relative position of Wolf 424 AB as measured from the FOS image provides a stringent constraint on any final solution. All acceptable orbital solutions indicate that component B has passed periastron and the separation between the two components is becoming larger. Hopefully, this system will continue to be followed by ground-based and HST observers. Observations during the upcoming maximum separation between 1998 and 2004 are crucial to constrain the size of the semimajor axis. The final determination of the component masses will have to wait for the remainder of the orbit to be covered by high-resolution observations. We wish to thank an anonymous referee for comments on the first draft of this paper, which lead to considerable improvement of the manuscript. Support for this work was provided by NASA through grant number GO-06059.01-94A from the Space Telescope Science Institute, which is operated by the Association of Universities for Research in Astronomy, Inc., under NASA contract NAS5-26555.
38 PASP, 110: SCHULTZ ET AL. REFERENCES Alcock, C., et al. 1996, ApJ, 461, 84 Bahcall, J. N. 1984, ApJ, 276, 169 Bahcall, J. N., Flynn, C., Gould, A., & Kirhakos, S. 1994, ApJ, 435, L51 Balega, I. I., et al. 1994, A&AS, 105, 503 Basri, G. B., Marcy, G. W., & Graham, J. R. 1996, ApJ, 458, 600 Blazit, A., Bonneau, D., & Foy, R. 1987, A&AS, 71, 57 Burrows, A., & Liebert, J. 1993, Rev. Mod. Phys., 65, 301 D’Antona, F., & Mazzitelli, I. 1985, ApJ, 296, 502 Davidge, T. J., & Boeshaar, P. C. 1991, AJ, 102, 267 Geyer, D. W., Harrington, R. S., & Worley, C. E. 1988, AJ, 95, 1841 Hart, H. M., et al. 1995, BAAS, 27, 1383 ———. 1996, BAAS, 28, 919 Heintz, W. D. 1972, AJ, 77, 160 ———. 1989, A&A, 217, 145
Henry, T. J., Johnson, D. S., McCarthy, D. W., & Kirkpatrick, J. D. 1992, A&A, 254, 116 Keyes, C. D., Koratkar, A. P., Dahlem, M., Hayes, J., Christensen, J., & Martin, S. 1995, FOS Instrument Handbook Koratkar, A., Wheeler, T., Evans, I., Lupie, O., Taylor, C., Keyes, C., & Kinney, A. 1994, SMOV Report V: FOS Plate Scale and Orientation (FOS Instr. Sci. Rep. 123) Mihalas, D., & Binney, J. 1981, Galactic Astronomy: Structure and Kinematics (San Francisco: Freeman) Schultz, A. B., et al. 1996, in ASP Conf. Ser. 119, Planets beyond the Solar System and the Next Generation of Space Missions, ed. D. Soderblom (San Francisco: ASP), 127 Stringfellow, G. S. 1991, ApJ, 375, L21 van den Bos, W. 1926, UOC, 2, 356 Worley, C. E., & Behall, A. L. 1973, AJ, 78, 650
1998 PASP, 110:31–38