Hindawi Publishing Corporation Computational and Mathematical Methods in Medicine Volume 2016, Article ID 4073584, 17 pages http://dx.doi.org/10.1155/2016/4073584
Research Article Human Activity Recognition in AAL Environments Using Random Projections Robertas DamaševiIius,1 Mindaugas Vasiljevas,1 Justas ŠalkeviIius,1 and Marcin Wofniak2 1
Department of Software Engineering, Kaunas University of Technology, LT-51368 Kaunas, Lithuania Institute of Mathematics, Faculty of Applied Mathematics, Silesian University of Technology, 44-100 Gliwice, Poland
2
Correspondence should be addressed to Robertas Damaˇseviˇcius;
[email protected] Received 8 February 2016; Revised 29 April 2016; Accepted 19 May 2016 Academic Editor: Ezequiel L´opez-Rubio Copyright © 2016 Robertas Damaˇseviˇcius et al. This is an open access article distributed under the Creative Commons Attribution License, which permits unrestricted use, distribution, and reproduction in any medium, provided the original work is properly cited. Automatic human activity recognition systems aim to capture the state of the user and its environment by exploiting heterogeneous sensors attached to the subject’s body and permit continuous monitoring of numerous physiological signals reflecting the state of human actions. Successful identification of human activities can be immensely useful in healthcare applications for Ambient Assisted Living (AAL), for automatic and intelligent activity monitoring systems developed for elderly and disabled people. In this paper, we propose the method for activity recognition and subject identification based on random projections from high-dimensional feature space to low-dimensional projection space, where the classes are separated using the Jaccard distance between probability density functions of projected data. Two HAR domain tasks are considered: activity identification and subject identification. The experimental results using the proposed method with Human Activity Dataset (HAD) data are presented.
1. Introduction The societies in the developed countries are rapidly aging. In 2006, almost 500 million people worldwide were 65 years of age or older. By 2030, that total number of aged people is projected to increase to 1 billion. The most rapid increase of aging population occurs in the developing countries, which will see a jump of 140% by 2030 [1]. Moreover, the world’s population is expected to reach 9.3 billion by 2050 [2], and people who are above 60 years old will make up 28% of the population. Dealing with this situation will require huge financial resources to support the ever-increasing living cost, where human life expectancy is expected to reach 81 years by 2100. As older people may have disorders of body functions or suffer from age-related diseases, the need for smart health assistance systems increases each year. A common method of monitoring geriatric patients is a physical observation, which is costly, requires a lot of human staff, and is increasingly infeasible in view of massive population aging in the following years. Many Ambient Assisted Living (AAL)
applications such as care-providing robots, video surveillance systems, and assistive human-computer interaction technologies require human activity recognition. While the primary users of the AAL systems are of course the senior (elderly) people, the concept also applies to mentally and physically impaired people as well as people suffering from diabetes and obesity, who may need assistance at home, and people of any age interested in personal fitness monitoring. As a result, the sensor-based real-time monitoring system to support independent living at home has been a subject of many recent research studies in human activity recognition (HAR) domain [3–10]. Activity recognition can be defined as the process of how to interpret sensor data to classify a set of human activities [11]. HAR is a rapidly growing area of research that can provide valuable information on health, wellbeing, and fitness of monitored persons outside a hospital setting. Daily activity recognition using wearable technology plays a central role in the field of pervasive healthcare [12]. HAR has gained increased attention in the last decade due to the arrival of affordable and minimally invasive mobile sensing platforms
2 such as smartphones. Smartphones are innovative platforms for HAR because of the availability of different wireless interfaces, unobtrusiveness, ease of use, high computing power and storage, and the availability of sensors, such as accelerometer, compass, and gyroscope, which meet the technical and practical hardware requirements for HAR tasks [13–15]. Moreover, technological development possibilities of other applications are still arising, including virtual reality systems. Therefore, these machines present a great possibility for the development of innovative technology dedicated for the AAL systems. One of the key motivating factors for using mobile phonebased human activity recognition in the AAL systems is the relationship and correlation between the level of physical activity and the level of wellbeing of a person. Recording and analysing precise information on the person’s activities are beneficial to keeping the progress and status of the disease (or mental condition) and can potentially improve the treatment of person’s conditions and diseases, as well as decreasing the cost of care. Recognizing indoor and outdoor activities such as walking, running, or cycling can be useful to provide feedback to the caregiver about the patient’s behaviour. When following the daily habits and routines of users, one can easily identify deviations from routines, which can assist the doctors in diagnosing conditions that would not be observed during routine medical examination. Another key enabler of the HAR technology is the possibility of providing independent living for the elderly as well as for patients with dementia and other mental pathologies, which could be monitored to prevent undesirable consequences of abnormal activities. Furthermore, by using persuasive techniques and gamification, HAR systems can be designed to interact with users to change their behaviour and lifestyles towards more active and healthier ones [16]. Recently, various intelligent systems based on mobile technologies have been constructed. HAR using smartphones or other types of portable or wearable sensor platforms has been used for assessing movement quality after stroke [17], such as upper extremity motion [18], for assessing gait characteristics of human locomotion for rehabilitation and diagnosis of medical conditions [19], for postoperative mobilization [20], for detecting Parkinson’s disease, back pain, and hemiparesis [21], for cardiac rehabilitation [22], for physical therapy, for example, if a user is correctly doing the exercises recommended by a physician [23, 24], for detecting abnormal activities arising due to memory loss for dementia care [25, 26], for dealing with Alzheimer’s [27] and neurodegenerative diseases such as epilepsy [28], for assessment of physical activity for children and adolescents suffering from hyperlipidaemia, hypertension, cardiovascular disease, and type 2 diabetes [29], for detecting falls [30, 31], for addressing physical inactivity when dealing with obesity [32], for analysing sleeping patterns [33], for estimating energy expenditures of a person to assess his/her healthy daily lifestyle [34], and for recognizing the user’s intent in the domain of rehabilitation engineering such as smart walking support systems to assist motor-impaired persons and the elderly [35].
Computational and Mathematical Methods in Medicine In this paper, we propose a new method for offline recognition of daily human activities based on feature dimensionality reduction using random projections [36] to low dimensionality feature space and using the Jaccard distance between kernel density probabilities as a decision function for classification of human activities. The structure of the remaining parts of the paper is as follows. Section 2 presents the overview of related work in the smartphone-based HAR domain with a particular emphasis on the features extracted from the sensor data. Section 3 describes the proposed method. Section 4 evaluates and discusses the results. Finally, Section 5 presents the conclusions and discusses future work.
2. Overview of HAR Features and Related Work All tasks of the HAR domain require correct identification of human activities from sensor data, which, in turn, requires that features derived from sensor data must be properly categorized and described. Next, we present an overview of features used in the HAR domain. 2.1. Features. While numerous features can be extracted from physical activity signals, increasing the number of features does not necessarily increase classification accuracy since the features may be redundant or may not be class-specific: (i) Time domain features (such as mean, median, variance, standard deviation, minimum, maximum, and root mean square, applied to the amplitude and time dimensions of a signal) are typically used in many practical HAR systems because of being less computationally intensive; thus, they can be easily extracted in real time. (ii) Frequency-domain features require higher computational cost to distinguish between different human activities. Thus, they may not be suitable for real-time AAL applications. (iii) Physical features are derived from a fundamental understanding of how a certain human movement would produce a specific sensor signal. Physical features are usually extracted from multiple sensor axes, based on the physical parameters of human movements. Based on the extensive analysis of the literature and features used by other authors (esp. by Capela et al. [17], Mathie et al. [37], and Zhang and Sawchuk [38]), we have extracted 99 features of data, which are detailed in Table 1. 2.2. Feature Selection. Feature selection is the process of selecting a subset of relevant features for use in construction of the classification model. Successful selection of features allows for simplification of models to make them easier to interpret, to decrease model training times, and to better understand difference between classes. Using feature selection allows removing redundant or irrelevant features without having an adverse effect on the classification accuracy.
Computational and Mathematical Methods in Medicine
3
Table 1: Catalogue of features. Feature number Description
Equation (notation)
4–6
Acceleration (𝑥-, 𝑦-, and 𝑧-axes)
𝑎𝑥 , 𝑎𝑦 , 𝑎𝑧
7–9
Gyroscope (𝑥-, 𝑦-, and 𝑧-axes)
𝑔𝑥 , 𝑔𝑦 , 𝑔𝑧
10–15
Moving variance of 100 samples of acceleration and gyroscope data
𝑁 𝑁 1 (𝑁∑𝑥𝑖2 − (∑𝑥𝑖 ) ), here 𝑥 = 𝑎𝑥 , 𝑎𝑦 , 𝑎𝑧 , 𝑔𝑥 , 𝑔𝑦 , 𝑔𝑧 var = 𝑁 (𝑁 − 1) 𝑖=1 𝑖=1
16-17
Movement intensity of acceleration and gyroscope data
MI𝑔 = √𝑔𝑥2 + 𝑔𝑦2 + 𝑔𝑧2
18
Movement intensity of difference between acceleration and gyroscope data
MI𝑔𝑎 = √ (𝑔𝑥 − 𝑎𝑥 ) + (𝑔𝑦 − 𝑎𝑦 ) + (𝑔𝑦 − 𝑎𝑦 )
19–21
Moving variance of 100 samples of movement intensity data
var =
22–24
Polar coordinates of acceleration data
𝑟𝑎 = √𝑎𝑥2 + 𝑎𝑦2 , 𝑧𝑎 = 𝑎𝑧
25–27
Polar coordinates of gyroscope data
𝑟𝑔 = √𝑔𝑥2 + 𝑔𝑦2 , 𝑧𝑔 = 𝑔𝑧
28–30
Polar coordinates of difference between acceleration and gyroscope data
31
Simple moving average of acceleration data
𝑟𝑎𝑔 = √ (𝑎𝑦 − 𝑔𝑦 ) + (𝑎𝑥 − 𝑔𝑥 ) , 𝑧𝑎𝑔 = 𝑎𝑧 − 𝑔𝑧 1 𝑁 𝑁 𝑁 (∑ 𝑎 + ∑ 𝑎 + ∑ 𝑎 ) SMA𝑎 = 𝑁 𝑖=1 𝑥 𝑖=1 𝑦 𝑖=1 𝑧
32
Simple moving average of gyroscope data
SMA𝑔 =
33
Simple moving average of difference between acceleration and gyroscope data
SMA𝑎𝑔 =
34
First eigenvalue of moving covariance between acceleration data
𝐸𝑎 = eig1 (cov (𝑎𝑥 (1 : 𝑁) , 𝑎𝑦 (1 : 𝑁) , 𝑎𝑧 (1 : 𝑁)))
35
First eigenvalue of moving covariance between gyroscope data
𝐸𝑔 = eig1 (cov (𝑔𝑥 (1 : 𝑁) , 𝑔𝑦 (1 : 𝑁) , 𝑔𝑧 (1 : 𝑁)))
36
First eigenvalue of moving covariance of difference between acceleration and gyroscope data
𝐸𝑎𝑔 = eig1 (cov (𝑎𝑥 − 𝑔𝑥 , 𝑎𝑦 − 𝑔𝑦 , 𝑎𝑧 − 𝑔𝑧 ))
37–42
Moving energy of acceleration and gyroscope data
ME =
43–48
Difference between moving maximum and moving minimum of acceleration and gyroscope data
MinMax = max (𝑥𝑖 ) − min (𝑥𝑖 ), here 𝑥 = 𝑎𝑥 , 𝑎𝑦 , 𝑎𝑧 , 𝑔𝑥 , 𝑔𝑦 , 𝑔𝑧
49
Moving correlation between 𝑥- and 𝑦-axis of acceleration data
MC𝑥𝑦 𝑎 = corr (𝑎𝑥 , 𝑎𝑦 )
50
Moving correlation between 𝑥-axis and 𝑧-axis of acceleration data
MC𝑥𝑧 𝑎 = corr (𝑎𝑥 , 𝑎𝑧 )
51
Moving correlation between 𝑦-axis and 𝑧-axis of acceleration data
MC𝑦𝑧 𝑎 = corr (𝑎𝑦 , 𝑎𝑧 )
52
Moving correlation between 𝑥-axis and 𝑦-axis of gyroscope data
MC𝑥𝑦 𝑔 = corr (𝑔𝑥 , 𝑔𝑦 )
53
Moving correlation between 𝑥-axis and 𝑧-axis of gyroscope data
MC𝑥𝑧 𝑔 = corr (𝑔𝑥 , 𝑔𝑧 )
54
Moving correlation between 𝑦-axis and 𝑧-axis of gyroscope data
MC𝑦𝑧 𝑔 = corr (𝑔𝑦 , 𝑔𝑧 )
2
MI𝑎 = √𝑎𝑥2 + 𝑎𝑦2 + 𝑎𝑧2 2
2
2
2
𝑁 𝑁 1 (𝑁∑𝑥𝑖2 − (∑𝑥𝑖 ) ), here 𝑥 = MI𝑎 , MI𝑔 , MI𝑔𝑎 𝑁 (𝑁 − 1) 𝑖=1 𝑖=1
𝜑𝑎 = arctan (𝑎𝑦 , 𝑎𝑥 ),
𝜑𝑔 = arctan (𝑔𝑦 , 𝑔𝑥 ),
𝜑𝑎𝑔 = arctan (𝑎𝑦 − 𝑔𝑦 , 𝑎𝑥 − 𝑔𝑥 ), 2
2
1 𝑁 𝑁 𝑁 (∑ 𝑔 + ∑ 𝑔 + ∑ 𝑔 ) 𝑁 𝑖=1 𝑥 𝑖=1 𝑦 𝑖=1 𝑧
𝑁 1 𝑁 𝑁 (∑ 𝑎𝑥 − 𝑔𝑥 + ∑ 𝑎𝑦 − 𝑔𝑦 + ∑ 𝑎𝑧 − 𝑔𝑧 ) 𝑁 𝑖=1 𝑖=1 𝑖=1
1 𝑁 2 ∑𝑥 , 𝑁 𝑖=1 𝑖
here 𝑥 = 𝑎𝑥 , 𝑎𝑦 , 𝑎𝑧 , 𝑔𝑥 , 𝑔𝑦 , 𝑔𝑧
1≤𝑖≤𝑁
1≤𝑖≤𝑁
4
Computational and Mathematical Methods in Medicine Table 1: Continued.
Feature number Description
Equation (notation) (𝑔𝑇 𝑎𝑔) 𝑃 = 𝑎 − 2 𝑔 arccos (𝑎𝑥 ⋅ 𝑎𝑦 ) 1 𝑁 MMA = ∑𝜑𝑖 , here 𝜑 = 𝑁 𝑖=1 𝑎𝑥 ⋅ 𝑎𝑦 2 𝑁 𝑁 arccos (𝑎𝑥 ⋅ 𝑎𝑦 ) 1 MVA = ((∑𝜑𝑖 ) − ∑𝜑𝑖2 ), 𝜑 = 𝑁 (𝑁 − 1) 𝑎𝑥 ⋅ 𝑎𝑦 𝑖=1 𝑖=1 𝑁 arccos (𝑎 ⋅ 𝑎 ) 1 𝑥 𝑦 MEA = ∑𝜑𝑖2 , here 𝜑 = 𝑁 𝑖=1 𝑎𝑥 ⋅ 𝑎𝑦 1 𝑁 2 ME𝑎𝑔 = ∑ (𝑥𝑖 − 𝑦𝑖 ) , here 𝑥 = 𝑎𝑥 , 𝑎𝑦 , 𝑎𝑧 , 𝑦 = 𝑔𝑥 , 𝑔𝑦 , 𝑔𝑧 𝑁 𝑖=1
55–57
Projection of gyroscope data onto acceleration data
58
Moving mean of orientation vector of acceleration data
59
Moving variance of orientation vector of acceleration data
60
Moving energy of orientation vector of acceleration data
61–63
Moving energy of difference between acceleration and gyroscope data
64
Moving energy of difference between 𝑥-axis and 𝑦-axis of acceleration data
ME𝑥𝑦 =
65
Moving energy of difference between 𝑥-axis and 𝑧-axis of acceleration data
ME𝑥𝑧 =
66
Moving energy of difference between 𝑦-axis and 𝑧-axis of acceleration data
ME𝑦𝑧 =
2 1 𝑁 ∑ (𝑎 − 𝑎𝑧,𝑖 ) 𝑁 𝑖=1 𝑦,𝑖
67
Moving mean of orientation vector of difference between acceleration and gyroscope data
MMA =
arccos ((𝑎𝑥 − 𝑔𝑥 ) (𝑎𝑦 − 𝑔𝑦 )) 1 𝑁 ∑𝜑 , here 𝜑 = 𝑁 𝑖=1 𝑖 𝑎𝑥 − 𝑔𝑥 ⋅ 𝑎𝑦 − 𝑔𝑦
68
Moving variance of orientation vector of difference between acceleration and gyroscope data
MVA =
𝑁 𝑁 1 ((∑𝜑𝑖 ) − ∑𝜑𝑖2 ), 𝑁 (𝑁 − 1) 𝑖=1 𝑖=1
69
Moving energy of orientation vector of difference between acceleration and gyroscope data
MEA =
arccos ((𝑎𝑥 − 𝑔𝑥 ) (𝑎𝑦 − 𝑔𝑦 )) 1 𝑁 2 ∑𝜑𝑖 , here 𝜑 = 𝑁 𝑖=1 𝑎𝑥 − 𝑔𝑥 ⋅ 𝑎𝑦 − 𝑔𝑦
70
Moving mean of orientation vector of gravity data
MMA𝑔 =
71
Moving variance of orientation vector of gravity data
MVA𝑔 =
72
Moving energy of orientation vector of gravity data
73
Moving mean of orientation vector of difference between acceleration and gravity data
74
Moving variance of orientation vector of difference between acceleration and gravity data
2 1 𝑁 ∑ (𝑎 − 𝑎𝑦,𝑖 ) 𝑁 𝑖=1 𝑥,𝑖
1 𝑁 2 ∑ (𝑎 − 𝑎𝑧,𝑖 ) 𝑁 𝑖=1 𝑥,𝑖
2
1 𝑁 ∑𝜑 , 𝑁 𝑖=1 𝑖
here 𝜑 =
𝜑=
arccos ((𝑎𝑥 − 𝑔𝑥 ) (𝑎𝑦 − 𝑔𝑦 )) 𝑎𝑥 − 𝑔𝑥 ⋅ 𝑎𝑦 − 𝑔𝑦
arccos (𝑔𝑥 ⋅ 𝑔𝑦 ) 𝑔𝑥 ⋅ 𝑔𝑦 2
𝑁 𝑁 arccos (𝑔𝑥 ⋅ 𝑔𝑦 ) 1 ((∑𝜑𝑖 ) − ∑ 𝜑𝑖2 ), 𝜑 = 𝑁 (𝑁 − 1) 𝑖=1 𝑔𝑥 ⋅ 𝑔𝑦 𝑖=1 𝑁 arccos (𝑔 ⋅ 𝑔 ) 1 𝑥 𝑦 MEA𝑔 = ∑𝜑𝑖2 , here 𝜑 = 𝑁 𝑖=1 𝑔𝑥 ⋅ 𝑔𝑦 arccos (𝑎𝑥 ⋅ 𝑎𝑦 ) arccos (𝑔𝑥 ⋅ 𝑔𝑦 ) 1 𝑁 − MMA𝑎𝑔 = ∑𝜑𝑖 , 𝜑 = 𝑁 𝑖=1 𝑎𝑥 ⋅ 𝑎𝑦 𝑔𝑥 ⋅ 𝑔𝑦 2
MVA𝑎𝑔 =
𝑁 𝑁 1 ((∑𝜑𝑖 ) − ∑𝜑𝑖2 ), 𝑁 (𝑁 − 1) 𝑖=1 𝑖=1
arccos (𝑎𝑥 ⋅ 𝑎𝑦 ) arccos (𝑔𝑥 ⋅ 𝑔𝑦 ) − 𝑎𝑥 ⋅ 𝑎𝑦 𝑔𝑥 ⋅ 𝑔𝑦 arccos (𝑎𝑥 ⋅ 𝑎𝑦 ) arccos (𝑔𝑥 ⋅ 𝑔𝑦 ) 1 𝑁 − MEA𝑎𝑔 = ∑𝜑𝑖2 , 𝜑 = 𝑁 𝑖=1 𝑎𝑥 ⋅ 𝑎𝑦 𝑔𝑥 ⋅ 𝑔𝑦
𝜑=
75
Moving energy of orientation vector of difference between acceleration and gravity data
76–81
Moving cumulative sum of acceleration and gyroscope data
MCS = ∑∑𝑥𝑖 , here 𝑥 = 𝑎𝑥 , 𝑎𝑦 , 𝑎𝑧 , 𝑔𝑥 , 𝑔𝑦 , 𝑔𝑧
82
Simple moving average of cumulative sums of acceleration data
SMAMCS𝑎 =
83
Simple moving average of cumulative sums of gyroscope data
SMAMCS𝑔 =
𝑁 𝑗
𝑗=1 𝑖=1
1 𝑁 ∑MCS𝑎,𝑖 𝑁 𝑖=1
1 𝑁 ∑MCS𝑔,𝑖 𝑁 𝑖=1
Computational and Mathematical Methods in Medicine
5
Table 1: Continued. Feature number Description 84
Equation (notation) Simple moving average of cumulative 1 𝑁 sums of difference between accelerometer SMAMCS𝑎𝑔 = ∑ (MCS𝑎,𝑖 − MCS𝑔,𝑖 ) 𝑁 𝑖=1 and gyroscope data 𝑁 𝑗
85–90
Moving 2nd-order cumulative sum of acceleration and gyroscope data
MCS = ∑∑MCS𝑖
91–93
Moving 2nd-order cumulative sum of differences between cumulative sums of acceleration and gyroscope data
MCS 𝑎𝑔 = ∑∑ (MCS𝑎𝑖 − MCS𝑖 )
𝑗=1 𝑖=1
𝑁 𝑗
𝑔
𝑗=1 𝑖=1
𝜑 𝑎 = arctan (MCS𝑎𝑦 , MCS𝑎𝑥 ), 94–96
Polar coordinates of moving cumulative sum of acceleration data
2
2
𝑟 𝑎 = √ (MCS𝑎𝑥 ) + (MCS𝑎𝑦 ) , 𝑧 𝑎 = MCS𝑎𝑧 𝜑 𝑔 = arctan (MCS𝑔𝑦 , MCS𝑔𝑥 ),
97–99
100–102
Polar coordinates of moving cumulative sum of gyroscope data
𝑟 𝑔 = √ (MCS𝑔𝑥 ) + (MCS𝑔𝑦 ) ,
Polar coordinates of moving cumulative sum of differences between acceleration and gyroscope data
𝑟 𝑎𝑔 = √ (MCS𝑎𝑥 − MCS𝑔𝑥 ) + (MCS𝑎𝑦 − MCS𝑔𝑦 ) ,
2
2
𝑧 𝑔 = MCS𝑔𝑧 𝜑 𝑎𝑔 = arctan (MCS𝑎𝑦 − MCS𝑔𝑦 , MCS𝑎𝑥 − MCS𝑔𝑥 ), 2
2
𝑧 𝑎𝑔 = MCS𝑎𝑧 − MCS𝑔𝑧
There are four basic steps in a typical feature selection method [58]: generation of candidate feature subset, an evaluation function for feature candidate subset, a generation stopping criterion, and a validation procedure. Further, we analyse several feature selection methods used in the HAR domain. ReliefF [59] is a commonly used filter method that ranks features by weighting them based on their relevance. Feature relevance is based on how well data instances are separated. For each data instance, the algorithm finds the nearest data point from the same class (hit) and nearest data points from different classes (misses). Matlab’s Rankfeatures ranks features by a given class separability criterion. Class separability measures include the absolute value of a statistic of a two-sample 𝑡-test, KullbackLeibler distance, minimum attainable classification error, area between the empirical Receiver Operating Characteristic (ROC) curve and the random classifier slope, and the absolute value of the statistic of a two-sample unpaired Wilcoxon test. Measures are based on distributional characteristics of classes (e.g., mean, variance) for a feature. Principal component analysis (PCA) is the simplest method to reduce data dimensionality. This reduced dimensional data can be used directly as features for classification. Given a set of 𝑁 features, a PCA analysis will produce new data variables (PCA components) as linear combinations of the features with the highest variance in the subspace orthogonal to the preceding PCA component. As variability of the data can be captured by a relatively small number of PCs, PCA can achieve high level of dimensionality reduction. Several extensions of the PCA method are known such as kernel PCA, sparse PCA, and multilinear PCA.
Correlation-based Feature Selection (CFS) [60] is a filter algorithm that ranks subsets of features by a correlationbased heuristic evaluation function. A feature is considered to be a good one if it is relevant to the target concept but is not redundant to any of the other relevant features. Goodness of measure is expressed by a correlation between features, and CFS chooses the subset of features which has the highest measure. The chosen subset holds the property that features inside this subset have high correlation with the class and are unrelated to each other. Table 2 summarizes the feature selection/dimensionality reduction methods in HAR. A comprehensive review of feature selection algorithms in general as well as in the HAR domain can be found in [58, 61–63]. 2.3. Summary. Related work in the HAR domain is summarized in Table 3. For each paper, the activities analysed, types of sensor data used, features extracted, classification method applied, and accuracy achieved (as given by the referenced papers) are given.
3. Method 3.1. General Scheme. The typical steps for activity recognition are preprocessing, segmentation, feature extraction, dimensionality reduction (feature selection), and classification [24]. The main steps of activity recognition include (a) preprocessing of sensor data (e.g., denoising), (b) feature extraction, (c) dimension reduction, and (d) classification. The preprocessing step includes noise removal and representation of raw data. The feature extraction step is used to reduce large
6
Computational and Mathematical Methods in Medicine Table 2: Summary of feature selection/dimensionality reduction methods in HAR.
Method
PCA
ReliefF Rankfeatures
CFS
Advantages High dimensionality reduction; reduction of noise; lack of redundancy of data due to orthogonality of components Low computational complexity Features highly correlated with already selected features are less likely to be included It evaluates a subset of features rather than individual features
Disadvantages The covariance matrix is difficult to be evaluated accurately; even the simplest invariance could not be captured by the PCA unless the training data explicitly provides for it Unstable due to random selection of instances
Complexity 𝑂(𝑝2 𝑛 + 𝑝3 ), where 𝑛 are data points, each represented with 𝑝 features 𝑂(𝑝 ⋅ 𝑛 ⋅ log 𝑛)
It assumes that data classes are normally distributed
It depends upon class separability criterion
It fails to select locally predictive features when they are overshadowed by strong, globally predictive features
𝑂 (𝑛 (
𝑝2 − 𝑝 )) 2
input sensor data to a smaller set of features (feature vector), which preserves information contained in the original data. The dimensionality reduction step can be applied to remove the irrelevant (or less relevant) features and reduce the computational complexity and increase the performance of the activity recognition process. The classification step is used to map the feature set to a set of activities. In this paper, we do not focus on data preprocessing and feature extraction but rather on dimensionality reduction and classification steps, since these two are crucial for further efficiency of AAL systems. The proposed method for human activity recognition is based on feature dimensionality reduction using random projections [36] and classification using kernel density function estimate as a decision function (Figure 1).
If 𝑥1 , 𝑥2 , . . . , 𝑥𝑁 is a sample of a random variable, then the kernel density approximation of its probability density function is
3.2. Description of the Method. During random projection, the original 𝑑-dimensional data is projected to a 𝑘dimensional (𝑘 ≪ 𝑑) subspace using a random 𝑘 × 𝑑 matrix 𝑅. The projection of the data onto a lower 𝑘-dimensional 𝑅𝑃 = 𝑅𝑘×𝑑 𝑋𝑑×𝑁, where 𝑋𝑑×𝑁 is the original subspace is 𝑋𝑘×𝑁 set of 𝑁 𝑑-dimensional observations. In the derived projection, the distances between the points are approximately preserved, if points in a vector space are projected onto a randomly selected subspace of suitably high dimension (see the Johnson-Lindenstrauss lemma [64]). The random matrix 𝑅 is selected as proposed by Achlioptas [36] as follows:
̂ (𝑥, 𝑦) = 𝑓 ̂ (𝑥) ⋅ 𝑓 ̂ (𝑦) . 𝑓
+1, { { { { { { { 𝑟𝑖𝑗 = {0, { { { { { { {−1,
1 6 2 probability 3 1 probability . 6 probability
(1)
Given the low dimensionality of the target space, we can treat the projection of low-dimensional observations onto each dimension as a set of random variables for which the probability density function (PDF) can be estimated using kernel density estimation (KDE) (or Parzen window) method [65].
̂ (𝑥) = 1 𝐾 ( 𝑥 − 𝑥𝑖 ) , 𝑓 ℎ 𝑁ℎ ℎ
(2)
where 𝐾 is some kernel and ℎ is the bandwidth (smoothing parameter). 𝐾 is taken to be a standard Gaussian function with mean zero and variance 1 of the examined data features: 𝐾 (𝑥) =
1 −(1/2)𝑥2 . 𝑒 √2𝜋
(3)
For a two-dimensional case, the bivariate probability density function is calculated as a product of univariate probability functions as follows: (4)
Here, 𝑥 and 𝑦 are data in each dimension, respectively. However, each random projection produces a different mapping of the original data points which reveals only a part of the data manifold in higher-dimensional space. In case of the binary classification problem, we are interested in a mapping that separates data points belonging to two different classes best. As a criterion for estimating the mapping, we use the Jaccard distance metric between two probability density estimates of data points representing each class. The advantage of the Jaccard distance metric as compared to other metrics of distance such as Kullback-Leibler (KL) divergence and Hellinger distance is its adaptability to multidimensional spaces where compared points show relations to different subsets. Therefore, it is well adapted to the developed model of human activity features, where according to description in the previous section we have divided them into some sets of actions. Furthermore, the computational complexity of the Hellinger distance is very high, while KL divergence might be unbounded. The Jaccard distance, which measures dissimilarity between sample sets, is obtained by subtracting the Jaccard coefficient from 1 or, equivalently, by dividing the difference
Computational and Mathematical Methods in Medicine
7
Table 3: Summary of related works in the HAR domain. Author
Activities
Atallah et al. [39]
Lying down, preparing food, eating and drinking, socialising, reading, dressing, walking, treadmill walking, vacuuming, wiping tables, running, treadmill, running, cycling, sitting down/getting up, and lying down/getting up
Sensor data
Features
Feature selection
Acceleration sensors
Averaged entropy over 3 axes, main FFT frequency (averaged) over 3 axes, energy of the 0.2 Hz window centred around main frequency over total FFT energy (3-axis average), and averaged mean of cross covariance between every 2 axes
ReliefF, Simba, kNN, Bayesian and MRMR classifier
Running, slow walk, fast walk, aerobic dancing, Triaxial Bayat et al. [40] stairs up, and stairs accelerometer down
Standing, sitting, lying, Berchtold et al. walking, climbing stairs, [41] cycling, and being stationary Sitting, standing, and lying; ramp up and ramp Capela et al. down; stairs up and [17] stairs down; transition between activities
Gupta and Dallas [30]
Accelerometer
Leaving house, using toilet, taking shower, sleeping, preparing Hoque and breakfast, preparing Stankovic [43] dinner, getting snack, getting drink, using washing machine, and using dishwasher Walking, running, stairs Iso and up/down, and fast Yamazaki [44] walking Walking, running, Kose et al. [45] biking, sitting, and standing
81%–91%
Variance, mean
Fuzzy inference
97.3%
Na¨ıve-Bayes, Support Vector Machine, and j48 decision tree
97%
kNN, Naive Bayes
98%
90%
None
Mean and standard deviation
None
Rules and threshold based classification
Location sensors (open/closed)
Magnitude
None
Custom clustering method
None
Bayesian probabilities
None
Clustered kNN
Accelerometer
90%
Multilayer perceptron, SVM, Random Forest, and Logit Boost
Accelerometer
Accelerometer
Accuracy
Mean along 𝑧-axis, MinMax, STD, and RMS for Am, APF along 𝑥-axis, 𝑦-axis, and 𝑧-axis, VarAPF, STD along 𝑥-axis, 𝑦-axis, Feature and 𝑧-axis, RMS along clustering 𝑥-axis, 𝑦-axis, and 𝑧-axis, correlation between 𝑧-axis and 𝑦-axis, and MinMax along 𝑥-axis, 𝑦-axis, and 𝑧-axis
Range, mean, standard Linear deviation, kurtosis, moving acceleration, average, covariance matrix, None gravity, and skewness, zero cross rate, velocity sensors and mean cross rate Energy, entropy, mean, variance, mean trend, windowed mean difference, Jumping, running, variance trend, windowed walking, sitting, Triaxial variance difference, ReliefF, SFFS sitting-to-standing, and accelerometer detrended fluctuation standing-to-kneeling analysis coefficients, 𝑋-𝑍-energy, and max. difference acceleration
Henpraserttae Sitting, lying, standing, et al. [42] and walking
Classification method
Wavelet components, periodograms, and information entropy Min., max., average, variance, FFT coefficients, and autocorrelation
64.5%–89.9%
80%
95.2%–97.5%
8
Computational and Mathematical Methods in Medicine
Table 3: Continued. Author
Activities
Kwapisz et al. [46]
Walking, jogging, stairs up/down, sitting, and standing
Driving, being Lane et al. [47] stationary, running, and walking Standing, walking, Lee and Cho running, stairs up/down, [48] shopping, and taking bus Walking, walking carrying items, sitting & relaxing, working on computer, standing still, eating or drinking, watching TV, reading, running, bicycling, Mannini and stretching, strength Sabatini [49] training, scrubbing, vacuuming, folding laundry, lying down and relaxing, brushing teeth, climbing stairs, riding elevator, and riding escalator Various human Mathie et al. movements, including [37] resting, walking, and falling
Maurer et al. [50]
Walking, standing, sitting, running, and ascending and descending the stairs
Miluzzo et al. [51]
Sitting, standing, walking, and running
P¨arkk¨a et al. [52]
Lying down, rowing, ex-biking, sitting/standing, running, and Nordic walking
Feature selection
Sensor data
Features
Accelerometer
Mean, std. dev., average absolute difference, average resultant acceleration, time None between peaks, and binned distribution
GPS, accelerometer, Mean, variance and microphone
Classification method Decision tree, logistic regression, and MNN
Accuracy
91.7%
None
Na¨ıve-Bayes
85–98%
None
Hierarchical HMM
70%–90%
Accelerometer
𝑥-, 𝑦-, and 𝑧-axes acceleration values
Acceleration sensors
DC component, energy, SFFS (Pudil frequency-domain entropy, algorithm) and correlation coefficients
Continuous emissions, Hidden Markov Model
99.1%
Integrated area under curve None
Binary decision tree
97.7% (sensitivity) 98.7% (specificity)
Correlationbased Feature Selection (CFS)
Decision trees (C4.5 algorithm), 𝑘-Nearest Neighbor, Na¨ıve-Bayes, and Bayes Net
80%–92%
None
Decision tree
79%
Heuristic
Decision tree
86%
Triaxial acceleration sensor
Mean, root mean square, standard deviation, variance, mean absolute deviation, cumulative Multiple sensors histogram, 𝑛th percentiles, interquartile range, zero crossing rate, mean crossing rate, and sq. length of 𝑋, 𝑌 DFT, FFT features, mean, Accelerometer, std. dev. and number of GPS, and audio peaks per unit, and time deviation of DFT power Peak frequency of up-down chest acceleration, median GPS, audio, of up-down chest altitude, EKG, acceleration, peak power of accelerometer, up-down chest compass, acceleration, variance of humidity, light, back-forth chest temperature, acceleration, sum of heart rate, pulse, variances of 3D wrist respiratory acceleration, and power effort, and skin ratio of frequency bands resistance 1–1.5 Hz and 0.2–5 Hz measured from chest magnetometer
Computational and Mathematical Methods in Medicine
9
Table 3: Continued. Author
Activities
Sensor data
Features
Saponas et al. [53]
Walking, jogging
Siirtola and R¨oning [54]
Walking, running, cycling, driving, sitting, Accelerometer and standing
Sohn et al. [55]
Walking, driving, and dwelling
GPS
Yang [56]
Sitting, Standing, walking, running, driving, and bicycling
Accelerometer
Accelerometer
Sitting, standing, lying, walking, Zhu and Sheng sitting-to-standing, [57] standing-to-sitting, lying-to-sitting, and sitting-to-lying
124 features: Nike + iPod Packet Payload, magnitude (mean, std. dev., min., max., and min. minus max.), frequency (energy in each of the first 10 frequency components of DFT, energy in each band of 10 frequency components, largest frequency component, and index of the largest frequency component) Magnitude, std., mean, min., max., percentiles (10, 25, 50, 75, and 90), and sum and square sum of observations above/below percentile (5, 10, 25, 75, 90, and 95) of magnitude acceleration and square sum of 𝑥 & 𝑧 Spearman rank correlation, variance, and mean Euclidean distance over a window of measurements Mean, std., zero crossing rate, 75th percentile, interquartile, spectrum centroid, entropy, and cross-correlation
3D acceleration Mean, variance
Data acquisition
Feature selection
Classification method
None
Na¨ıve-Bayesian Network
97.4% (withinperson), 99.48% (cross-person)
None
Decision tree + kNN/QDA
95%
None
Logistic regression
85%
None
Decision tree, Na¨ıve-Bayes, kNN, and SVM
90%
None
Neural network ensemble
67%–98%
Learning
Best projection
Prediction using KDE
Activity
Accuracy
Feature generation
Denoising
Figure 1: General scheme of the proposed method.
of the sizes of the union and the intersection of two sets by the size of the union: 𝑑𝐽 (𝐴, 𝐵) = 1 − 𝐽 (𝐴, 𝐵) =
|𝐴 ∪ 𝐵| − |𝐴 ∩ 𝐵| . |𝐴 ∪ 𝐵|
(5)
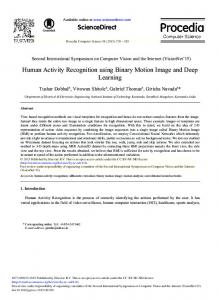
In the proposed model, the best random projection with the smallest overlapping area is selected (see an example in Figure 2).
To explore the performance and correlation among features visually, a series of scatter plots in a 2D feature space is shown in Figure 3. The horizontal and vertical axes represent two different features. The points in different colours represent different human activities. In case of multiple classes, the method works as a oneclass classifier: recognizing instances of a positive class, while all instances of other classes are recognized as outliers of the positive class.
10
Computational and Mathematical Methods in Medicine ×10−3 9
0.07
8
0.06
Probability density
Probability density
7 0.05 0.04 0.03 0.02
6 5 4 3 2
0.01
1
0 −200
0
200
400 600 Feature value
800
1000
0 −1200 −1000 −800
1200
−600
−400
−200
0
200
400
Feature value
Walking Forward Walking Upstairs
Walking Forward Walking Upstairs
Figure 2: Graphical illustration of good separation versus bad separation of kernel density estimation functions (Subject 1, Trial 1, Walking Forward versus Walking Upstairs; 2nd dimension).
×104 4
5000
3.5 0
3
Feature 2
Feature 2
2.5 2 1.5
−5000
−10000
1 0.5
−15000
0 −0.5 −200
0
200
400 600 Feature 1
800
1000
1200
Walking Forward Walking Upstairs
−20000 −1200
−1000
−800
−600
−400
−200
0
200
Feature 1 Walking Forward Walking Upstairs
Figure 3: Example of classification: walking versus running (Subject 1, Trial 1) classes randomly projected in a bidimensional feature subspace.
3.3. Algorithm. The pseudocode of the algorithms for finding the best projection and using it for classification in lowdimensional space is presented in Pseudocodes 1 and 2, respectively.
4. Experiments 4.1. Dataset. To evaluate the performance of the proposed approach for HAR from the smartphone data, we used the part of the dataset (USC Human Activity Dataset [38]) recorded using the MotionNode device (sampling rate:
100 Hz; 3-axis accelerometer range: ±6 g; 3-axis gyroscope range: ±500 dps). The dataset consists of records recorded with 14 subjects (7 male, 7 female; age: 21–49) of 12 activities, 5 trials each. During data acquisition, MotionNode was attached on the front right hip of subjects. The recorded low-level activities are as follows: Walking Forward (WF), Walking Left (WL), Walking Right (WR), Walking Upstairs (WU), Walking Downstairs (WD), Running Forward (RF), Jumping Up (JU), Sitting (Si), Standing (St), Sleeping (Sl), Elevator Up (EU), and Elevator Down (ED). Each record consists of the following attributes: date,
Computational and Mathematical Methods in Medicine
11
ALGORITHM: FindBestProjection INPUT: data1, data2 – data for class1 and class2 [nxm matrices] threshold – iterating parameter OUTPUT: bestProjection BEGIN Jaccard = MAXINT; WHILE (Jaccard > threshold) generate Random Projection matrix projection project m-dimensional data1 & data2 into 2D pdata1 & pdata2 FOREACH dimension of pdata1 & pdata2 calculate kernel density distributions calculate Jaccard intersection of pdata1 & pdata2 END FOREACH Memorize bestProjection with smallest Jaccard END RETURN bestProjection END Pseudocode 1: Pseudocode of FindBestProjection.
ALGORITHM: BinaryClassify INPUT: sample [1xm matrix], bestProjection [mx2 matrix], density estimates fx1,fy1 (class +1), and fx2,fy2 (class -1) [1xn vectors] OUTPUT:classLabel BEGIN pSample = sample * bestProjection IF (fx1(pSample) * fy1(pSample) > fx2(pSample) * fy2(pSample)) LET classLabel = +1 ELSE LET classLabel = -1 END RETURN classLabel END Pseudocode 2: Pseudocode of binary classification.
subject number, age, height, weight, activity name, activity number, trial number, sensor location, orientation, and readings. Sensor readings consist of 6 readings: acceleration along 𝑥-, 𝑦-, and 𝑧-axes and gyroscope along 𝑥-, 𝑦-, and 𝑧-axes. Each trial was performed on different days at various indoor and outdoor locations. 4.2. Results. In Table 4, we describe the top three best features from Table 1 (see column Feature number) ranked by the Matlab Rankfeatures function using the entropy criterion. The results of feature ranking presented in Table 5 can be summarized as follows: (i) For Walking Forward, Walking Left, and Walking Right, the important features are moving variance of acceleration and gyroscope data, movement intensity of gyroscope data, moving variance of movement intensity of acceleration data, first eigenvalue of moving covariance between acceleration data, and polar angle of moving cumulative sum of gyroscope data.
(ii) For Walking Upstairs and Walking Downstairs, moving variance of gyroscope along 𝑧-axis, movement intensity of gyroscope data, and moving variance of movement intensity are the most important. (iii) For Running Forward, moving variance of 100 samples of acceleration along 𝑥-axis, moving variance of 100 samples of gyroscope along 𝑧-axis, and moving energy of acceleration are distinguishing features. (iv) For Jumping Up, the most important features are moving variance of acceleration, moving variance of movement intensity, and moving energy of acceleration. (v) For Sitting, movement intensity of gyroscope data and movement intensity of difference between acceleration and gyroscope data are the most important. (vi) For Standing, moving variance of movement intensity of acceleration data, moving variance of acceleration along 𝑥-axis, and first eigenvalue of moving
12
Computational and Mathematical Methods in Medicine Table 4: Top features for binary classification of human activities.
Activity WF
WL 97, 88, 91
WL WR WU WD RF JU Si St Sl EU
WR 85, 100, 88 97, 91, 88
WU
WD
RF
JU
Si
St
Sl
EU
ED
15, 63, 42
14, 39, 34
10, 15, 60
10, 19, 37
17, 18, 30
19, 36, 35
34, 19, 36
15, 36, 35
15, 42, 63
97, 63, 42 63, 42, 15
87, 97, 86 34, 87, 39 87, 39, 78
10, 37, 19 10, 59, 37 63, 42, 15 65, 38, 34
10, 37, 19 10, 37, 19 10, 19, 63 10, 19, 60 35, 36, 62
17, 18, 30 17, 18, 30 17, 18, 26 17, 18, 7 38, 36, 17 4, 22, 16
19, 36, 34 19, 34, 14 19, 14, 62 19, 10, 20 19, 10, 15 19, 10, 15 22, 5, 38
34, 19, 36 34, 19, 85 34, 19, 35 19, 34, 35 34, 19, 35 19, 34, 36 22, 4, 85 76, 85, 39
15, 36, 35 15, 36, 35 15, 36, 35 15, 36, 35 15, 36, 35 15, 42, 63 15, 42, 63 10, 15, 36 15, 22, 42
15, 42, 63 15, 42, 63 15, 42, 63 15, 42, 63 15, 42, 63 15, 42, 63 59, 60, 15 59, 11, 60 59, 60, 94 59, 60, 10
WF: Walking Forward; WL: Walking Left; WR: Walking Right; WU: Walking Upstairs; WD: Walking Downstairs; RF: Running Forward; JU: Jumping Up; Si: Sitting; St: Standing; Sl: Sleeping; EU: Elevator Up; ED: Elevator Down.
Table 5: The confusion matrix of within-subject activity classification using Rankfeatures. Activity WF WL WR WU WD RF JU Si St Sl EU ED Mean Baseline
WF 1 0.774 0.980 0.874 0.985 0.996 0.980 0.997 0.999 1 0.999 1 0.965 0.650
WL 0.774 1 0.989 0.968 0.958 0.998 0.996 0.951 0.999 1 0.999 1 0.969 0.616
WR 0.980 0.989 1 0.798 0.998 0.997 0.988 0.988 0.971 1 0.981 1 0.974 0.616
WU 0.874 0.968 0.798 1 0.708 0.985 0.979 0.962 0.999 1 0.971 1 0.937 0.712
WD 0.985 0.958 0.998 0.708 1 0.992 0.878 0.967 0.850 1 0.986 1 0.944 0.713
RF 0.996 0.998 0.997 0.985 0.992 1 0.978 0.991 0.995 0.957 0.994 1 0.990 0.621
JU 0.980 0.996 0.988 0.979 0.878 0.978 1 0.973 1 0.930 1 1 0.975 0.641
Si 0.997 0.951 0.988 0.962 0.967 0.991 0.973 1 0.987 1 0.126 0.992 0.911 0.627
St 0.999 0.999 0.971 0.998 0.850 0.996 1 0.987 1 1 0.326 0.887 0.918 0.642
Sl 1 1 1 1 1 0.957 0.929 1 1 1 1 0.992 0.989 0.651
EU 0.999 0.999 0.981 0.971 0.986 0.994 1 0.126 0.326 1 1 0.697 0.840 0.640
ED 1 1 1 1 1 1 1 0.992 0.887 0.992 0.697 1 0.964 0.628
WF: Walking Forward; WL: Walking Left; WR: Walking Right; WU: Walking Upstairs; WD: Walking Downstairs; RF: Running Forward; JU: Jumping Up; Si: Sitting; St: Standing; Sl: Sleeping; EU: Elevator Up; ED: Elevator Down.
covariance of difference between acceleration and gyroscope data are the most distinctive. (vii) For Sleeping, the most prominent features are first eigenvalue of moving covariance between acceleration data and moving variance of movement intensity of acceleration data. (viii) For Elevator Up and Elevator Down, the most commonly selected feature is moving variance of 𝑧-axis of gyroscope data. Other prominent features are first eigenvalue of moving covariance of difference between acceleration and gyroscope data and moving energy of 𝑧-axis of gyroscope data. These results can be considered as consistent from what can be expected from the physical analysis of human motions in the analysed dataset. The evaluation of HAR classification algorithms is usually made through the statistical analysis of the models using the
available experimental data. The most common method is the confusion matrix which allows representing the algorithm performance by clearly identifying the types of errors (false positives and negatives) and correctly predicted samples over the test data. The confusion matrix for within-subject activity recognition using Matlab’s Rankfeatures is detailed in Table 5. The classification was performed using 5-fold cross-validation, using 80% of data for training and 20% of data for testing. Grand mean accuracy is 0.9552; grand mean precision is 0.9670; grand mean sensitivity is 0.9482; grand mean specificity is 0.9569; grand mean recall is 0.9482; grand mean 𝐹-score is 0.9482. The baseline accuracy was calculated using only the top 2 features selected by Rankfeatures, but without using random projections. The results show that features derived using random projections are significantly better than features derived using a common feature selection algorithm.
Computational and Mathematical Methods in Medicine
13
Table 6: The confusion matrix of within-subject activity classification using ReliefF. Activity WF WL WR WU WD RF JU Si St Sl EU ED Mean Baseline
WF 1.000 0.998 0.892 0.931 0.993 1.000 0.999 1.000 1.000 1.000 1.000 1.000 0.984 0.621
WL 0.998 1.000 0.853 0.989 0.997 1.000 1.000 0.999 1.000 0.896 0.971 1.000 0.975 0.637
WR 0.892 0.853 1.000 0.789 0.964 1.000 1.000 0.999 1.000 0.853 1.000 1.000 0.946 0.600
WU 0.931 0.989 0.789 1.000 0.702 1.000 1.000 0.996 0.956 0.992 0.999 1.000 0.946 0.695
WD 0.993 0.997 0.964 0.702 1.000 0.965 0.998 0.655 0.997 0.982 1.000 0.975 0.936 0.703
RF 1.000 1.000 1.000 1.000 0.965 1.000 0.688 0.999 1.000 1.000 1.000 1.000 0.971 0.644
JU 0.999 1.000 1.000 1.000 0.998 0.688 1.000 1.000 1.000 0.993 1.000 1.000 0.973 0.618
Si 1.000 0.999 0.999 0.996 0.655 0.999 1.000 1.000 0.491 0.967 0.328 0.313 0.812 0.628
St 1.000 1.000 1.000 0.956 0.997 1.000 1.000 0.491 1.000 0.766 0.528 0.901 0.887 0.640
Sl 1.000 0.896 0.853 0.992 0.982 1.000 0.993 0.967 0.766 1.000 1.000 1.000 0.954 0.644
EU 1.000 0.971 1.000 0.999 1.000 1.000 1.000 0.328 0.528 1.000 1.000 0.765 0.883 0.635
ED 1.000 1.000 1.000 1.000 0.975 1.000 1.000 0.313 0.901 1.000 0.765 1.000 0.913 0.642
WF: Walking Forward; WL: Walking Left; WR: Walking Right; WU: Walking Upstairs; WD: Walking Downstairs; RF: Running Forward; JU: Jumping Up; Si: Sitting; St: Standing; Sl: Sleeping; EU: Elevator Up; ED: Elevator Down.
To take a closer look at the classification result, Table 5 shows the confusion table for classification of activities. The overall averaged recognition accuracy across all activities is 95.52%, with 11 out of 12 activities having accuracy values higher than 90%. If we examine the recognition performance for each activity individually, Running Forward, Jumping Up, and Sleeping will have very high accuracy values. For Running Forward, the accuracy of 99.0% is achieved. Interestingly, the lowest accuracy was achieved for Elevator Up activity, only 84.0%, while it was most often misclassified with Sitting and Standing. Elevator Down is misclassified with Elevator Up (only 69.7% accuracy). This result makes sense since Sitting on a chair, Standing, and Standing in a moving elevator are static activities, and we expect difficulty in differentiating different static activities. Also, there is some misclassification when deciding on a specific direction of activity; for example, Walking Left is confused with Walking Forward (77.4% accuracy) and Walking Upstairs (87.4% accuracy). Walking Upstairs is also confused with Walking Right (79.8% accuracy) and Walking Downstairs (70.8% accuracy). This is due to the similarity of any walk-related activities. For comparison, the confusion matrix for within-subject activity recognition obtained using the proposed method with ReliefF feature selection is detailed in Table 6. The classification was performed using 5-fold cross-validation, using 80% of data for training and 20% of data for testing. Grand mean accuracy is 0.932; grand mean precision is 0.944; grand mean sensitivity is 0.939; grand mean specificity is 0.933; grand mean recall is 0.939; grand mean 𝐹-score is 0.922. The baseline accuracy was calculated using only the top 2 features selected using ReliefF, but without using random projections. Again, the results show that features derived using random projections are significantly better than features derived using the ReliefF method only. Surprisingly, though the classification accuracy of the specific activities differed, the mean accuracy metric results
are quite similar (but still worse, if grand mean values are considered). The features identified using ReliefF feature selection were better at separating Walking Forward from Walking Left and Standing from Elevator Up activities but proved worse for separating other activities such as Sitting from Standing. For subject identification, the data from all physical actions is used to train the classifier. Here, we consider oneversus-all subject identification problem. Therefore, the data of one subject is defined as positive class, and the data of all other subjects is defined as negative class. In this case, also 5-fold cross-validation was performed, using 80% of data for training and 20% of data for testing. The results of one-versusall subject identification using all activities for training and testing are presented in Table 7. While the results are not very good, they still are better than random baselines: grand mean accuracy is 0.477; precision is 0.125; recall is 0.832; and 𝐹score is 0.210. If an activity of a subject has been established, separate classifiers for each activity can be used for subject identification. In this case, also 5-fold cross-validation was performed, using 80% of data for training and 20% of data for testing, and the results are presented in Table 8. The grand mean accuracy is 0.720, which is better than random baseline. However, if we consider only the top three walking-related activities (Walking Forward, Walking Left, or Walking Right), the mean accuracy is 0.944. Finally, we can simplify the classification problem to binary classification (i.e., recognize one subject against another). This simplification can be motivated by the assumption that only a few people are living in an AAL home (far less than 14 subjects in the analysed dataset). Then, the data from a pair of subjects performing a specific activity is used for classification and training. Separate classifiers are built for each pair of subjects, the results are evaluated using 5-fold cross-validation, and the results are averaged. The results are presented in Table 9. Note that the grand mean accuracy has
14
Computational and Mathematical Methods in Medicine
Table 7: Results of one-versus-all subject identification (all activities). Subjects S1 S2 S3 S4 S5 S6 S7 S8 S9 S10 S11 S12 S13 S14 Mean Random baseline
Accuracy 0.657 0.273 0.549 0.496 0.323 0.863 0.265 0.107 0.683 0.156 0.755 0.689 0.373 0.493 0.477 0.071
Precision 0.142 0.075 0.078 0.073 0.068 0.220 0.055 0.071 0.229 0.091 0.263 0.167 0.115 0.112 0.123 0.071
Recall 0.744 0.917 0.716 0.697 0.931 0.637 0.920 0.985 0.967 0.943 0.905 0.533 0.881 0.866 0.832 0.929
𝐹-score 0.239 0.139 0.140 0.132 0.127 0.328 0.103 0.132 0.370 0.166 0.407 0.254 0.203 0.198 0.210 0.133
Table 8: Results of one-versus-all subject identification for specific activities. Activity Walking Forward Walking Left Walking Right Walking Upstairs Walking Downstairs Running Forward Jumping Up Sitting Standing Sleeping Elevator Up Elevator Down Mean Random baseline
Accuracy 0.947 0.955 0.931 0.857 0.833 0.832 0.814 0.506 0.722 0.589 0.337 0.318 0.720 0.071
𝐹 0.727 0.769 0.722 0.551 0.497 0.496 0.453 0.391 0.432 0.292 0.235 0.232 0.483 0.133
increased to 0.947, while, for the top three walking-related activities (Walking Forward, Walking Left, or Walking Right), the grand mean accuracy is 0.992.
5. Evaluation and Discussion Random projections have been used in the HAR domain for data dimensionality reduction in activity recognition from noisy videos [69], feature compression for head pose estimation [70], and feature selection for activity motif discovery [71]. The advantages of random projections are the simplicity of their implementation and their scalability, robustness to noise, and low computational complexity: constructing the random matrix 𝑅 and projecting the 𝑑 × 𝑁 data matrix into 𝑘 dimensions are of order 𝑂(𝑑𝑘𝑁).
Table 9: Accuracy of binary subject identification using separate activities. Activity Walking Forward Walking Left Walking Right Walking Upstairs Walking Downstairs Running Forward Jumping Up Sitting Standing Sleeping Elevator Up Elevator Down Mean Random baseline
Accuracy 0.992 0.989 0.993 0.977 0.974 0.980 0.983 0.883 0.940 0.956 0.856 0.846 0.947 0.5
𝐹 0.987 0.987 0.993 0.970 0.971 0.974 0.980 0.859 0.932 0.953 0.847 0.822 0.939 0.5
The HAD dataset has been used in HAR research by other authors, too. Using the same HAD dataset, Zheng [66] has achieved 95.6% accuracy. He used the means and variances of magnitude and angles as the activity features and the magnitude and angles that were produced by a triaxial acceleration vector. Classifier used the Least Squares Support Vector Machine (LS-SVM) and Na¨ıve-Bayes (NB) algorithm to distinguish different activity classes. Sivakumar [67] achieved 84.3% overall accuracy using symbolic approximation of time series of accelerometer and gyroscope signal. Vaka [68] achieved 90.7% accuracy for withinperson classification and 88.6% accuracy for interperson classification using Random Forest. The features used for the recognition were time domain features: mean, standard deviation, correlation between 𝑋 and 𝑌, correlation between 𝑌 and 𝑍, correlation between 𝑋 and 𝑍, and root mean square of a signal. Our results (95.52% accuracy), obtained using the proposed method, are very similar to the best results of Zheng for activity recognition task. The results obtained by different authors using the USCHAD dataset are summarized in Table 10. We think that it would be difficult to achieve even higher results due to some problems with the analysed dataset, which include a set of problems inherent to many Human Activity Datasets as follows: (i) Accurate Labelling of All Activities. Existing activity recognition algorithms usually are based on supervised learning where the training data depends upon accurate labelling of all human activities. Collecting consistent and reliable data is a very difficult task since some activities may have been marked by users with wrong labels. (ii) Transitionary/Overlapping Activities. Often people do several activities at the same time. The transition states (such as walking-standing, lying-standing) can be treated as additional states, and the recognition
Computational and Mathematical Methods in Medicine
15
Table 10: Summary of HAR results using USC-HAD dataset. Reference Zheng [66] Sivakumar [67] Vaka [68] This paper
Features Means and variances of magnitude and angles of acceleration along 𝑥-, 𝑦- & 𝑧-axes Accelerometer and gyroscope data Mean, std. dev., correlation between 𝑋 & 𝑌, 𝑌 & 𝑍, and 𝑋 & 𝑍, and RMS 99 times, frequency and physical features
model can be trained with respect to these states to increase the accuracy. (iii) Context Problem. It occurs when the sensors are placed at an inappropriate position relative to the activity being measured. For example, with accelerometer-based HAR, the location where the phone is carried, such as in the pocket or in the bag, impacts the classification performance. (iv) Subject Sensitivity. It measures dependency of the trained classification model upon the specifics of user. (v) Weak Link between Basic Activities and More Complex Activities. For example, it is rather straightforward to detect whether the user is running, but inferring whether the user is running away from danger or jogging in a park is different. (vi) Spurious Data. Most published studies handle the problem of the fuzzy borders by manual data cropping.
6. Conclusion Monitoring and recognizing human activities are important for assessing changes in physical and behavioural profiles of the population over time, particularly for the elderly and impaired and patients with chronic diseases. Although a wide variety of sensors are being used in various devices for activity monitoring, the positioning of the sensors, the selection of relevant features for different activity groups, and providing context to sensor measurements still pose significant research challenges. In this paper, we have reviewed the stages needed to implement a human activity recognition method for automatic classification of human physical activity from on-body sensors. A major contribution of the paper lies in pursuing the random projections based approach for feature dimensionality reduction. The results of extensive testing performed on the USC-HAD dataset (we have achieved overall accuracy of within-person classification of 95.52% and interperson identification accuracy of 94.75%) reveal the advantages of the proposed approach. Gait-related activities (Walking Forward, Walking Left, and Walking Right) allowed the best identification of subjects opening the way for a multitude of applications in the area of gait-based identification and verification.
Classification method Least Squares Support Vector Machine (LS-SVM), Na¨ıve-Bayes (NB) Symbolic approximation
Accuracy
Random Forest
90.7%
Heuristic (random projections + PDFs + Jaccard distance)
95.52%
95.6% 84.3%
Future work will concern the validation of the proposed method using other datasets of human activity data as well as integration of the proposed method in the wearable sensor system we are currently developing for applications in indoor human monitoring.
Competing Interests The authors declare that there are no competing interests regarding the publication of this paper.
Acknowledgments The authors would like to acknowledge the contribution of the COST Action IC1303 AAPELE: Architectures, Algorithms and Platforms for Enhanced Living Environments.
References [1] U. S. State Department and National Institute on Aging (NIA), Why Population Aging Matters: A Global Perspective, 2007. [2] Department of Economic and Social Affairs and Population Division, World Population to 2300, United Nations, New York, NY, USA, 2004. [3] P. Turaga, R. Chellappa, V. S. Subrahmanian, and O. Udrea, “Machine recognition of human activities: a survey,” IEEE Transactions on Circuits and Systems for Video Technology, vol. 18, no. 11, pp. 1473–1488, 2008. [4] R. Poppe, “A survey on vision-based human action recognition,” Image and Vision Computing, vol. 28, no. 6, pp. 976–990, 2010. [5] J. K. Aggarwal and M. S. Ryoo, “Human activity analysis: a review,” ACM Computing Surveys, vol. 43, no. 3, article 16, 2011. [6] S.-R. Ke, H. L. U. Thuc, Y.-J. Lee, J.-N. Hwang, J.-H. Yoo, and K.H. Choi, “A review on video-based human activity recognition,” Computers, vol. 2, no. 2, pp. 88–131, 2013. [7] O. C. Ann, “Human activity recognition: a review,” in Proceedings of the of IEEE International Conference on Control System, Computing and Engineering (ICCSCE ’14), pp. 389–393, Batu Ferringhi, Malaysia, November 2014. [8] J. K. Aggarwal and L. Xia, “Human activity recognition from 3D data: a review,” Pattern Recognition Letters, vol. 48, pp. 70–80, 2014. [9] M. Vrigkas, C. Nikou, and I. A. Kakadiaris, “A review of human activity recognition methods,” Frontiers in Robotics and AI, vol. 2, article 28, 2015. [10] M. Ziaeefard and R. Bergevin, “Semantic human activity recognition: a literature review,” Pattern Recognition, vol. 48, no. 8, pp. 2329–2345, 2015.
16 [11] O. D. Incel, M. Kose, and C. Ersoy, “A review and taxonomy of activity recognition on mobile phones,” BioNanoScience, vol. 3, no. 2, pp. 145–171, 2013. [12] V. Osmani, S. Balasubramaniam, and D. Botvich, “Human activity recognition in pervasive health-care: supporting efficient remote collaboration,” Journal of Network and Computer Applications, vol. 31, no. 4, pp. 628–655, 2008. ´ D. Lara and M. A. Labrador, “A survey on human activity [13] O. recognition using wearable sensors,” IEEE Communications Surveys and Tutorials, vol. 15, no. 3, pp. 1192–1209, 2013. [14] M. Shoaib, S. Bosch, O. D. Incel, H. Scholten, and P. J. M. Havinga, “A survey of online activity recognition using mobile phones,” Sensors, vol. 15, no. 1, pp. 2059–2085, 2015. [15] J. L. R. Ortiz, Smartphone-Based Human Activity Recognition, Springer Theses, 2015. [16] S. Purpura, V. Schwanda, K. Williams, W. Stubler, and P. Sengers, “Fit4Life: The design of a persuasive technology promoting healthy behavior and ideal weight,” in Proceedings of the 29th Annual CHI Conference on Human Factors in Computing Systems (CHI ’11), pp. 423–432, ACM, New York, NY, USA, May 2011. [17] N. A. Capela, E. D. Lemaire, and N. Baddour, “Feature selection for wearable smartphone-based human activity recognition with able bodied, elderly, and stroke patients,” PLoS ONE, vol. 10, no. 4, Article ID e0124414, 2015. [18] S. Patel, R. Hughes, T. Hester et al., “A novel approach to monitor rehabilitation outcomes in stroke survivors using wearable technology,” Proceedings of the IEEE, vol. 98, no. 3, pp. 450–461, 2010. [19] W. Tao, T. Liu, R. Zheng, and H. Feng, “Gait analysis using wearable sensors,” Sensors, vol. 12, no. 2, pp. 2255–2283, 2012. [20] G. Appelboom, B. E. Taylor, E. Bruce et al., “Mobile phoneconnected wearable motion sensors to assess postoperative mobilization,” JMIR mHealth and uHealth, vol. 3, no. 3, article e78, 2015. [21] V. H. Cheung, L. Gray, and M. Karunanithi, “Review of accelerometry for determining daily activity among elderly patients,” Archives of Physical Medicine and Rehabilitation, vol. 92, no. 6, pp. 998–1014, 2011. [22] N. Bidargaddi, A. Sarela, L. Klingbeil, and M. Karunanithi, “Detecting walking activity in cardiac rehabilitation by using accelerometer,” in Proceedings of the International Conference on Intelligent Sensors, Sensor Networks and Information (ISSNIP ’07), pp. 555–560, December 2007. [23] L. Bao and S. S. Intille, “Activity recognition from userannotated acceleration data,” in Pervasive Computing, A. Ferscha and F. Mattern, Eds., vol. 3001 of Lecture Notes in Computer Science, pp. 1–17, Springer, Berlin, Germany, 2004. [24] A. Avci, S. Bosch, M. Marin-Perianu, R. Marin-Perianu, and P. Havinga, “Activity recognition using inertial sensing for healthcare, wellbeing and sports applications: a survey,” in Proceedings of the 23rd International Conference on Architecture of Computing Systems (ARCS 10), pp. 1–10, Hannover, Germany, February 2010. [25] K. S. Gayathri, S. Elias, and B. Ravindran, “Hierarchical activity recognition for dementia care using Markov Logic Network,” Personal and Ubiquitous Computing, vol. 19, no. 2, pp. 271–285, 2015. [26] C. Phua, P. C. Roy, H. Aloulou et al., “State-of-the-art assistive technology for people with dementia,” in Handbook of Research on Ambient Intelligence and Smart Environments: Trends and
Computational and Mathematical Methods in Medicine
[27]
[28]
[29]
[30]
[31]
[32]
[33]
[34]
[35]
[36]
[37]
[38]
[39]
[40]
[41]
[42]
Perspectives, N.-Y. Chong and F. Mastrogiovanni, Eds., chapter 16, pp. 300–319, IGI Global, 2011. P. C. Roy, S. Giroux, B. Bouchard et al., “A possibilistic approach for activity recognition in smart homes for cognitive assistance to Alzheimer’s patients,” in Activity Recognition in Pervasive Intelligent Environments, vol. 4 of Atlantis Ambient and Pervasive Intelligence, pp. 33–58, Springer, Berlin, Germany, 2011. A. Hildeman, Classification of epileptic seizures using accelerometers [Ph.D. dissertation], Chalmers University of Technology, Gothenburg, Sweden, 2011. M. R. Puyau, A. L. Adolph, F. A. Vohra, I. Zakeri, and N. F. Butte, “Prediction of activity energy expenditure using accelerometers in children,” Medicine and Science in Sports and Exercise, vol. 36, no. 9, pp. 1625–1631, 2004. P. Gupta and T. Dallas, “Feature selection and activity recognition system using a single triaxial accelerometer,” IEEE Transactions on Biomedical Engineering, vol. 61, no. 6, pp. 1780– 1786, 2014. ¨ A. T. Ozdemir and B. Barshan, “Detecting falls with wearable sensors using machine learning techniques,” Sensors, vol. 14, no. 6, pp. 10691–10708, 2014. M. Arif and A. Kattan, “Physical activities monitoring using wearable acceleration sensors attached to the body,” PLoS ONE, vol. 10, no. 7, Article ID e0130851, 2015. G. G. Alvarez and N. T. Ayas, “The impact of daily sleep duration on health: a review of the literature,” Progress in Cardiovascular Nursing, vol. 19, no. 2, pp. 56–59, 2004. S. E. Crouter, J. R. Churilla, and D. R. Bassett Jr., “Estimating energy expenditure using accelerometers,” European Journal of Applied Physiology, vol. 98, no. 6, pp. 601–612, 2006. H. Yu, M. Spenko, and S. Dubowsky, “An adaptive shared control system for an intelligent mobility aid for the elderly,” Autonomous Robots, vol. 15, no. 1, pp. 53–66, 2003. D. Achlioptas, “Database-friendly random projections,” in Proceedings of the 20th ACM SIGMOD-SIGACT-SIGART Symposium on Principles of Database Systems (PODS ’01), pp. 274–281, Santa Barbara, Calif, USA, May 2001. M. J. Mathie, B. G. Celler, N. H. Lovell, and A. C. F. Coster, “Classification of basic daily movements using a triaxial accelerometer,” Medical and Biological Engineering and Computing, vol. 42, no. 5, pp. 679–687, 2004. M. Zhang and A. A. Sawchuk, “USC-HAD: a daily activity dataset for ubiquitous activity recognition using wearable sensors,” in Proceedings of the International Conference on Ubiquitous Computing (UbiComp ’12), pp. 1036–1043, ACM, September 2012. L. Atallah, B. Lo, R. King, and G.-Z. Yang, “Sensor positioning for activity recognition using wearable accelerometers,” IEEE Transactions on Biomedical Circuits and Systems, vol. 5, no. 4, pp. 320–329, 2011. A. Bayat, M. Pomplun, and D. A. Tran, “A study on human activity recognition using accelerometer data from smartphones,” Procedia Computer Science, vol. 34, pp. 450–457, 2014. M. Berchtold, M. Budde, D. Gordon, H. R. Schmidtke, and M. Beigl, “ActiServ: activity recognition service for mobile phones,” in Proceedings of the 14th IEEE International Symposium on Wearable Computers (ISWC ’10), pp. 1–8, IEEE, Seoul, South Korea, October 2010. A. Henpraserttae, S. Thiemjarus, and S. Marukatat, “Accurate activity recognition using a mobile phone regardless of device
Computational and Mathematical Methods in Medicine
[43]
[44]
[45]
[46]
[47]
[48]
[49]
[50]
[51]
[52]
[53]
[54]
[55]
orientation and location,” in Proceedings of the International Conference on Body Sensor Networks (BSN ’11), pp. 41–46, IEEE, Dallas, Tex, USA, May 2011. E. Hoque and J. Stankovic, “AALO: activity recognition in smart homes using Active Learning in the presence of Overlapped activities,” in Proceedings of the 6th International Conference on Pervasive Computing Technologies for Healthcare and Workshops (PervasiveHealth ’12), pp. 139–146, May 2012. T. Iso and K. Yamazaki, “Gait analyzer based on a cell phone with a single three-axis accelerometer,” in Proceedings of the 8th International Conference on Human-Computer Interaction with Mobile Devices and Services (MobileHCI ’06), pp. 141–144, Espoo, Finland, September 2006. M. Kose, O. D. Incel, and C. Ersoy, “Online human activity recognition on smart phones,” in Proceedings of the Workshop on Mobile Sensing: From Smartphones and Wearables to Big Data (Colocated with IPSN), pp. 11–15, Beijing, China, April 2012. J. R. Kwapisz, G. M. Weiss, and S. A. Moore, “Activity recognition using cell phone accelerometers,” ACM SIGKDD Explorations Newsletter, vol. 12, no. 2, pp. 74–82, 2011. N. Lane, M. Mohammod, M. Lin et al., “Bewell: a smartphone application to monitor, model and promote wellbeing,” in Proceedings of the 5th International ICST Conference on Pervasive Computing Technologies for Healthcare, pp. 23–26, IEEE, 2012. Y. S. Lee and S. Cho, “Activity recognition using hierarchical hidden markov models on a smartphone with 3d accelerometer,” in Hybrid Artificial Intelligent Systems: 6th International Conference, HAIS 2011, Wroclaw, Poland, May 23–25, 2011, Proceedings, Part I, vol. 6678 of Lecture Notes in Computer Science, pp. 460–467, Springer, Berlin, Germany, 2011. A. Mannini and A. M. Sabatini, “Machine learning methods for classifying human physical activity from on-body accelerometers,” Sensors, vol. 10, no. 2, pp. 1154–1175, 2010. U. Maurer, A. Smailagic, D. P. Siewiorek, and M. Deisher, “Activity recognition and monitoring using multiple sensors on different body positions,” in Proceedings of the International Workshop on Wearable and Implantable Body Sensor Networks (BSN ’06), pp. 113–116, IEEE, Cambridge, Mass, USA, April 2006. E. Miluzzo, N. D. Lane, K. Fodor et al., “Sensing meets mobile social networks: the design, implementation and evaluation of the CenceMe application,” in Proceedings of the 6th ACM Conference on Embedded Networked Sensor Systems (SenSys ’08), pp. 337–350, Raleigh, NC, USA, November 2008. J. P¨arkk¨a, M. Ermes, P. Korpip¨aa¨, J. M¨antyj¨arvi, J. Peltola, and I. Korhonen, “Activity classification using realistic data from wearable sensors,” IEEE Transactions on Information Technology in Biomedicine, vol. 10, no. 1, pp. 119–128, 2006. T. S. Saponas, J. Lester, J. Froehlich, J. Fogarty, and J. Landay, iLearn on the iPhone: Real-Time Human Activity Classification on Commodity Mobile Phones, 2008. P. Siirtola and J. R¨oning, “Recognizing human activities userindependently on smartphones based on accelerometer data,” International Journal of Interactive Multimedia and Artificial Intelligence, vol. 1, no. 5, pp. 38–45, 2012. T. Sohn, A. Varshavsky, A. LaMarca et al., “Mobility detection using everyday GSM traces,” in UbiComp 2006: Ubiquitous Computing: 8th International Conference, UbiComp 2006 Orange County, CA, USA, September 17–21, 2006 Proceedings, vol. 4206 of Lecture Notes in Computer Science, pp. 212–224, Springer, Berlin, Germany, 2006.
17 [56] J. Yang, “Toward physical activity diary: motion recognition using simple acceleration features with mobile phones,” Proceedings of the 1st International Workshop on Interactive Multimedia for Consumer Electronics (IMCE ’09), 2009. [57] C. Zhu and W. Sheng, “Motion- and location-based online human daily activity recognition,” Pervasive and Mobile Computing, vol. 7, no. 2, pp. 256–269, 2011. [58] H. Liu and L. Yu, “Toward integrating feature selection algorithms for classification and clustering,” IEEE Transactions on Knowledge and Data Engineering, vol. 17, no. 4, pp. 491–502, 2005. ˇ [59] M. Robnik-Sikonja and I. Kononenko, “Theoretical and empirical analysis of ReliefF and RReliefF,” Machine Learning, vol. 53, no. 1-2, pp. 23–69, 2003. [60] M. A. Hall, Correlation-based feature selection for machine learning [Ph.D. thesis], The University of Waikato, 1999. [61] A. Jain and D. Zongker, “Feature selection: evaluation, application, and small sample performance,” IEEE Transactions on Pattern Analysis and Machine Intelligence, vol. 19, no. 2, pp. 153– 158, 1997. [62] I. Guyon and A. Elisseeff, “An introduction to variable and feature selection,” Journal of Machine Learning Research, vol. 3, pp. 1157–1182, 2003. [63] S. Pirttikangas, K. Fujinami, and T. Nakajima, “Feature selection and activity recognition from wearable sensors,” in Ubiquitous Computing Systems, H. Y. Youn, M. Kim, and H. Morikawa, Eds., vol. 4239 of Lecture Notes in Computer Science, pp. 516– 527, Springer, Berlin, Germany, 2006. [64] W. B. Johnson and J. Lindenstrauss, “Extensions of Lipshitz mapping into Hilbert space,” in Conference in Modern Analysis and Probability, vol. 26 of Contemporary Mathematics, pp. 189– 206, American Mathematical Society, 1984. [65] E. Parzen, “On estimation of a probability density function and mode,” The Annals of Mathematical Statistics, vol. 33, no. 3, pp. 1065–1076, 1962. [66] Y. Zheng, “Human activity recognition based on the hierarchical feature selection and classification framework,” Journal of Electrical and Computer Engineering, vol. 2015, Article ID 140820, 9 pages, 2015. [67] A. Sivakumar, Geometry aware compressive analysis of human activities: application in a smart phone platform [M.S. thesis], Arizona State University, Tempe, Ariz, USA, 2014. [68] P. R. Vaka, A pervasive middleware for activity recognition with smartphones [M.S. thesis], University of Missouri-Kansas, 2015. [69] D. Tran and A. Sorokin, “Human activity recognition with metric learning,” in Computer Vision—ECCV 2008, D. Forsyth, P. Torr, and A. Zisserman, Eds., vol. 5302 of Lecture Notes in Computer Science, pp. 548–561, Springer, Berlin, Germany, 2008. [70] D. Lee, M.-H. Yang, and S. Oh, “Fast and accurate head pose estimation via random projection forests,” in Proceedings of the IEEE International Conference on Computer Vision (ICCV ’15), pp. 1958–1966, IEEE, Santiago, Chile, December 2015. [71] L. Zhao, X. Wang, G. Sukthankar, and R. Sukthankar, “Motif discovery and feature selection for CRF-based activity recognition,” in Proceedings of the 20th International Conference on Pattern Recognition (ICPR ’10), pp. 3826–3829, Istanbul, Turkey, August 2010.
MEDIATORS of
INFLAMMATION
The Scientific World Journal Hindawi Publishing Corporation http://www.hindawi.com
Volume 2014
Gastroenterology Research and Practice Hindawi Publishing Corporation http://www.hindawi.com
Volume 2014
Journal of
Hindawi Publishing Corporation http://www.hindawi.com
Diabetes Research Volume 2014
Hindawi Publishing Corporation http://www.hindawi.com
Volume 2014
Hindawi Publishing Corporation http://www.hindawi.com
Volume 2014
International Journal of
Journal of
Endocrinology
Immunology Research Hindawi Publishing Corporation http://www.hindawi.com
Disease Markers
Hindawi Publishing Corporation http://www.hindawi.com
Volume 2014
Volume 2014
Submit your manuscripts at http://www.hindawi.com BioMed Research International
PPAR Research Hindawi Publishing Corporation http://www.hindawi.com
Hindawi Publishing Corporation http://www.hindawi.com
Volume 2014
Volume 2014
Journal of
Obesity
Journal of
Ophthalmology Hindawi Publishing Corporation http://www.hindawi.com
Volume 2014
Evidence-Based Complementary and Alternative Medicine
Stem Cells International Hindawi Publishing Corporation http://www.hindawi.com
Volume 2014
Hindawi Publishing Corporation http://www.hindawi.com
Volume 2014
Journal of
Oncology Hindawi Publishing Corporation http://www.hindawi.com
Volume 2014
Hindawi Publishing Corporation http://www.hindawi.com
Volume 2014
Parkinson’s Disease
Computational and Mathematical Methods in Medicine Hindawi Publishing Corporation http://www.hindawi.com
Volume 2014
AIDS
Behavioural Neurology Hindawi Publishing Corporation http://www.hindawi.com
Research and Treatment Volume 2014
Hindawi Publishing Corporation http://www.hindawi.com
Volume 2014
Hindawi Publishing Corporation http://www.hindawi.com
Volume 2014
Oxidative Medicine and Cellular Longevity Hindawi Publishing Corporation http://www.hindawi.com
Volume 2014