Human Behaviour Recognition with Segmented Inertial Data Chao Sun David Stirling Fazel Naghdy University of Wollongong, Australia
[email protected] [email protected] [email protected]
Abstract The development and recent advancements of integrated inertial sensors has afforded substantive new possibilities for the acquisition and study of complex human motor skills and ultimately their imitation within robotic systems. This paper describes continuing work on kinetic models that are derived through unsupervised learning from a continuous stream of signals, including Euler angles and accelerations in three spatial dimensions, acquired from motions of a human arm. An intrinsic classification algorithm, MML (Minimum Message Length encoding) is used to segment the complex data, formulating a Gaussian Mixture Model of the dynamic modes it represents. Subsequent representation and analysis as FSM (Finite State Machines) has found distinguishing and consistent sequences of modes that persist across both, a variety of tasks as well as multiple candidates. An exemplary “standard” sequence for each behaviour can be abstracted from a corpus of suitable data and in turn utilised together with alignment techniques to identify behaviours of new sequences, as well as detail the homologous extent between each. The progress in contrast to previous work and future objectives are discussed.
1
Introduction and Preliminary
The study for human motion modelling has become of particular interest in the robotics and other relative fields. Acquisition of the human psycho-motor behaviour is one of the most popular research areas. In addition to self-discovery, learning of skills in humans generally takes place through training by an instructor in the psychomotor domain, where ‘motor’ is an observable movement response to a stimulus. According to Smith and Smith[Smith and W, 1962], there are three types of movement: postural, locomotor and manipulative movements. In this and previous work, we focus on locomotor movements, which translate and rotate a body. The aim is to learn, distinguish and recognise various predefined human behaviours by capturing motions with inertial
sensors, and subsequently analyse the multi-dimensional sensory data into certain patterns. An unsupervised MML (Minimum Message Length) encoding, a machine learning method, is employed in order to build a model that can be ultimately utilised in the management and control of such behaviours in a robotic frame.
1.1
Motion Primitives
Generally, in order to analyse human behaviour, an approach is to define and segment the behaviours into motion primitives [Morrow, 1997], and describe or generate new behaviours using such primitives. These primitives can be defined in various patterns, according to different methods and theories. In the work conducted by Nakazawa [Nakazawa et al., 2003a; 2003b], the primitives are defined as composition of “motion-base + motion-style”. Both the motion-base and -style are graphic-based and calculated from monochromatic video presenting human dance motions. HaiBing and colleagues [Haibing and Guangyou, 2002] modelled motion primitives by utilising Gaussian mixture models and their distribution densities in their study of human actions. An alternative approach is to use the number of Degree of Freedoms (DOFs) to define the motion primitives. Amit and Matari [Amit and Matari, 2002] assumed a set of innate base primitives to control the DOFs in their motion learning framework. Differing from the vision based primitives, the choice of primitives is required for animating the robot as well as being able to characterise the skilled patterns of motion observed. In another words, the primitives are not constrained to relate to any particular mode, they can be associated with any type of motion segment and can be used to describe any manoeuvre.
1.2
Motion Acquirement
In order to acquire motion data of human behaviour, various types of sensor have been employed. Optical sensors are popular choices in this area, but they require significant postprocessing of image data in order to deduce the movements of fixed points. Optical sensors are mostly unobtrusive, practical and will not impact on the motion of the subject. Such
systems are widely used for industrial, and or, public monitoring purposes [Amit and Matari, 2002; Haga et al., 2004; Zhongfei, 2002; Xinyu et al., 2005]. Although in certain cases the 2-D information provided by monocular camera vision has proved to be sufficient for monitoring purposes, these vision systems do not function as ideal sensors for complex human behaviour study. To make motion feature extraction simpler, reflective markers are often mounted on the subject [Matsui et al., 2005]. And multiple cameras are used to extend 2-D image perception for 3-D space in order to cope with more demanding or complex motions and scenarios [Palm, 2003]. There are several different types of Inertial sensors now being utilised for motion capture, such as Micro-ElectroMechanical Systems (MEMS), solid state accelerometers, gyroscopes, magnetometers. These, being relatively unobtrusive, can be mounted externally on the subject at the precise points of interest, providing direct and accurate measurements of motion and posture, often in real-time. The electrical signals generated by a single inertial sensor are mostly a direct analogue of some specific aspect of the motion observed. However, consistent singular types of inertial data are often insufficient for motion study and it is necessary to augment their type. Sensor fusion [Mukai et al., 1993; Reybet-Degat and Dubuisson, 1995; Fuentes and Nelson, 1996] is one procedure to combine different types of sensory data and integrate them to form useful motion features.
1.3
Machine Learning
Different machine learning methods have been applied in this area, in order to segment the observed human motions into various primitive modes from sensory data. As such, primitives could be combined in various permutations to form plausible, to useful segments, almost all the popular classification methods have been used by different authors. A Support Vector Machine (SVM) algorithm was employed by Sukthankar and Sycara [Sukthankar and Sycara, 2005] in their military manoeuvre recognition project. Kumar et al. [Kumar et al., 2004] were able to successfully classify and recognised human hand gestures using an Artificial Neural Network (ANN) and a Motion History Image (MHI) [Babu, 2003] in order to characterise the motion from a high dimensional space into a low dimensional space, and established a recognition criterion through a Nearest Neighbour technique. Fuzzy logic is also been endorsed by a number of authors, Nascimento et al. [Nascimento et al., 2000] developed the Fuzzy Clustering Multiple Prototype (FCMP) approach, based on FCM seeking to provide improved performance in fitting various proposed models. Inamura et al. [Inamura et al., 2004] have proposed a comprehensive layered architecture of methods attempting to model the emergence of symbol abstractions in the development of behaviours, but relies on traditional Hidden Markov Models (HMM). In the previous work [Sun et al., 2006] we applied an MML
mixture modelling algorithm to inertial data derived from human hand/arm behaviours. The essential objective is to transform multi-feature data streams of human behaviour into a reliable temporal sequence of modes or clusters. By analysing different cluster sequences, the human behaviours are modelled and recognised. The output sequences showed high repeatability among the same style of behaviours. In this article, we improve on previous work, with improved pre-processing and normalising of individual data streams, and also expand from a single candidate scenario, repeating a sequence of tasks, to include multiple subjects. By utilising Minimum Message Length (MML) encoding, we build a primitive model for three pre-defined human arm behaviours. This is subsequently validated on new and unseen data were the model is employed to identify new examples of each behaviour. In Section 2 we describe the experimental details and considerations. In Section 3 we illustrate our original idea in this work. In Section 4 we discuss aspects of the related theory and in Section 5 we present a range of experimental results. These results are further considered and discussed in Section 6, followed by an outline of future work in Section 7.
2
Scope and Preparation
In this work, our challenging goal, subject to the limitation of hardware, is to model various human behaviours with only one inertial sensor. Under these conditions, it is not plausible to develop comprehensive models of complex behaviours. Also, since only one point from human body can be measured by the sensor at any particular time, we are not expecting a sufficient range of distributed data to enable the generation of new synthetic behaviours, which might be possible with multiple sensors. Thus the aim of this work is to model behaviours from one part of human body using a primitive based approach, and in turn recognise and compare these behaviours with the model. The sensor used in this work to capture the dynamic motion behaviours was an integrated inertial unit the “MTx”. The MTx itself combines nine individual MEMS sensors to provide an accurate 3DOF inertial Orientation point Tracker. It provides drift-free 3D orientation as well as kinematics data: 3D acceleration, 3D rate of turn (rate gyro) and 3D magnetometers [B.V., 2005]. Embedded DSP within the MTx unit provides Euler angles, kinematics and the orientation matrices as outputs. However, we have primarily focused on the Euler angles and accelerations as motion training data as Euler angles present the posture of the body at the point the sensor attached, and the accelerations are relative to current movement. Both Euler angles and accelerations have 3 orientations, Roll, Pitch and Yaw for the Euler angles and X, Y, Z axes for accelerations. The input for our system is a mixed stream of these 6 features. Three specific skilled tasks, principally locomotor and manipulative movements involving the arm and hand were cho-
Grab 50 Yaw 40
4
5 12
14 13 2
Theory
There are many ways in which to partition the feature space into qualitative or purposed based regions. However, only
1
10
AccZ Pitch Roll AccX AccY
0 −10 −20
0
50
100
150
200
250
Time
Original Idea
(a) Grab Push 50 Yaw
Euler Angles & Accelerations
40
7
4
5
3
2
1
30
20
10
AccZ Pitch Roll AccX AccY
0
−10
0
20
40
60
80
100 Time
120
140
2
1
160
180
200
(b) Push Zigzag
50 Yaw
7
4
5
6
9
6
3
40 Euler Angles & Accelerations
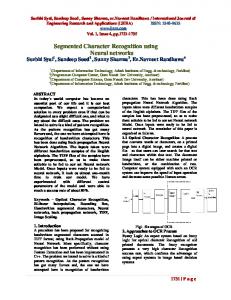
Our work is based on the idea that same style of behaviours guide similar trajectories within the 6-dimensional feature space. Example trends of the changes occurring for each these six features for all three behaviours are illustrated in Figure 1. One can readily appreciate from the trends in Figure 1 notable variations between behaviours. For example the variation in Pitch is pronounced in the “Grab” manoeuvre whilst relatively flat in the case of “Push”. In comparison, all features in the “Zigzag” task manifest a greater degree of variation, even to the extent of directly portraying the S-shape path being followed. In most cases, the combinations of Euler angles and accelerations vary dynamically for each of the different behaviours. It is conjectured that if we examine the trajectories for all behaviours in the six-dimensional space, that these trajectories should closely correspond with the same start and end points, but possibly pass through differing areas in-between. By repeating these behaviours many times, and on each occasion noting/labelling the skill performed, it is possible to later segment all of this stream of data into a library of unique modes or clusters within the 6-D feature space. By reinstating the task-labels (or indices), post the segmentation process, we can identify which cluster/mode is associated to which behaviour, as well as, which of these are common or unique to each manoeuvre, and also what is the generic sequence for each. In this way, we transform the 6-feature sequence data into a mode-cluster sequence. If the experimental results indicate promising similar output sequences for the same style of behaviours, and notable dissimilarities between different behaviours, then such sequences could be utilised as the basis for a skill model with which to recognise and classify future (or unseen) motion data.
4
16
20
−30
3
8
30
Euler Angles & Accelerations
sen as target training behaviours, which would be to be performed several times, and hopefully later recognised by the resultant model. These are called “Grab”, “Push” and “Zigzag”. The goal for each of these behaviours is the same: to move an object (small tube of glue) from one location to another on a flat surface (desktop); the difference between each task is the trajectory used to complete it. “Grab” requires the subject, using their hand, to pick up the glue tube, translate and deposit it at the end point; “Push”, alternatively requires the subject again using their hand to push and to slide the glue along the desktop in a straight path until the end point is achieved; and “Zigzag” requires the subject to alternatively push/slide the object along the desktop, following an S-shaped path between start- and end-points.
30
20
10
Roll
Pitch AccZ AccX AccY
0
−10
0
50
100
150
200
250
Time
(c) Push Figure 1: Example trends of all features in performing each behavioural task (a) Grab (b) Push and (c) Zigzag
certain of these may be applicable based on performance for behavioural human contexts, this is because of: 1) Human behaviours are restricted to the body frame; so this hypothesised space should be correspond to realistic muscular-skeletal behaviours; 2) the number of partitions may be too-few thus constraining the models sensitivity and overall performance. Fuzzy C-Means (FCM) is an unsupervised classification method based on fuzzy logic, it was initially proposed by Dunn [Dunn, 1973] and later generalised by Bezdek [Bezdek, 1981; Bezdek and Hathaway, 1988]. The algorithm clusters sample data automatically according to the Euclidian distances between the data instances. Generally only the targeted number of clusters needs to be defined by the user and, the algorithm can be applied to data distributed over multiple dimensions. Seemingly, the FCM approach was easy to comprehend and implement for our purposes. However, in our previous work the FCM results did not demonstrate any significance compared with other methods. Since FCM is based on deterministic, distance based metrics, it treats the values of two types of data, Euler angles and accelerations, as the same. An additional preprocessing to adjust a set weight for each feature is recommended to solve this kind of disparity. Further more, its not easy to determine a‘priori how many clusters is best when using FCM. This approach provides appropriate optimised partitions for a fixed number of clusters, but little guidance is available in determining the best number of clusters. In overcoming this, an alternative Gaussian mixture modelling, probability based segmentation approach was considered, here Minimum Message Length (MML) encoding. The MML principle [Vapnik, 1995; Duda et al., 2001; Trivedi, 1982] is based on information theory and statistics. The rationale behind MML is to postulate a model of the data as a series of candidate partitions, then to evaluate this by estimating the amount of code required to describe the model plus the data exceptions that fall outside of it. For any given data set D, we wish to find the most probable hypothesis, H, which maximises P (H|D). By Bayes’ theorem, the posterior probability of H is the product of the prior probability of H and the likelihood function of D given H divided by the marginal probability of the observed data, or D(P (H|D) = (1/P (D) R× P (H) × P (D|H))). The marginal probability P (D) = H P (H) · P (D|H)dH. From the elementary information theory, an event of probability pi can be optimally encoded into a code word of length li = −logpi . Since P(D) is independent from the hypothesis, H, maximising P (H|D) is equivalent to maximising P (H) × P (D|H), which is in turn equivalent to minimising −logP (H) − logP (D|H), the length of a two-part message transmitted from D. In considering alternative, and or successive models, those that reduce the total message length are maintained and further specialised. In short the reduction of message length becomes the guiding metric of the data segmentation or clustering model. The MML mixture modelling programs employed
Z
Y
Y X Z
X
Figure 2: Sensor Installation
addresses both the model selection and parameter estimation. The MML principle tries to encode the data with various theories, and then evaluate the theory that maximises the product of the prior probability of theory with the probability of the data in light of that theory.
5
Experiment and Results
Hardware installation was essentially the same as reported in earlier work [Sun et al., 2006], now however, 3 subjects are involved in this test separately and at differing times and locations. The MTx sensor is installed on the left wrist with a plastic band as shown in Figure 2. The subjects are instructed on each task behaviour and also which start/end points to use, they where then required to execute these behaviours a number of times according to their own preferences and appreciation for the required speed and motion trajectories followed. The training data was amassed from 15 repetitions of each of three tasks for each of three separate human subjects, amounting to, 15x3x3 = 135 motions trajectories. Apart from increased variety of candidate behaviours, this also represents a 50% repetition increase for each task. Figure 3 illustrates a concept process map on how the experiment was organised. MML Cluster
Motion Primitive Model
KL distance
Scoring Matrix
Training Set Inertial Data
Sensor Fusion
Testing Set
MML Prediction
Primitive Transition Model
Primitive ID Sequence
FSM
SW Alignment
Similarity Score Similarity Rate
Figure 3: Flowchart of the Whole Experiment
5.1
Pre-process
All streams of sensory data include 6 features; these are Euler angles (Yaw, Pitch and Roll) and accelerations for each of three dimensions. The Euler angles are reset to 0 at the start of each motion as the sensor is sensitive to its initial orientation. In each case, after the raw sensory data is received all of the 6 features are normalised [0,1] individually before being
added to the training data set that is used to ultimately build model. The need for doing this arises from:
5
3.4 3.3
• Euler angles and Accelerations have different scales, which will influence their weight in the model.
3.2 3.1 Message Length
• Different people perform same behaviour in different ways, and different ranges of Euler angles and accelerations reflect those personal habits (Such as slower people incur lower accelerations when moving).
3
Golden Ratio Point
2.9
0.382
2.8 1
By normalising each feature in this fashion, we have improved the reliability of our system.
2.7
5.2
2.5
2.6
Mixture Model
Using a similar procedure to that described in earlier work [Sun et al., 2006] all of the (now pre-processed) data is aggregated together to form a single training set, which is subsequently processed by the MML algorithm until a significant amount of tessellation is achieved. This produces an increasing number of modes or clusters (terminated at 100) which is reflected in the gradual reduction of the total message length reduction. As the raw sensory data has now been normalised (0 to 1), the AoM, (Accuracy of Measurement), or the granularity between significantly differing values is now set to 0.11 and the algorithm seed fixed at 1000. The algorithm seed which affects the initial condition of clustering procedure, needs to be fixed to obtain repeatable model, where as the AoM influences the resolving power of our model, this is normally set to about 1/10 of the standard deviation for each data feature used. The trend in message length reduction for this suite of dynamic tasks is shown in Figure 4. The trade-off between generality and complexity of candidate models is reflected in the progressive tessellation of this data and an appropriate or reasonable degree of cluster generation needs to be selected. If chosen prematurely, the model will only capture gross dynamic behaviours. If however, too-many, the model will be possibly overtrained including numerous subtle idiosyncratic modes. As shown in the Figure 4, the message length for different models reduces as the cluster number increases, and the reducing trend changes from irregular to smooth. A “reasonable” cluster number is here taken as the point where the reduction in the message length substantially decreases, or becomes “flat enough”. Being a subjective problem in this case; the Golden Ratio, ϕ, was selected as the criterion for our determination. The golden ratio, ϕ ≈ 0.618 or 1.618, also known as the divine proportion, golden mean, or golden section, is a number often encountered when taking the ratios of distances in simple geometric figures. It expresses the relationship when the sum of 2 quantities is to the larger quantity as the larger is to the smaller, where a+b = ab . The Golden Ratio is widely used in Aesthetics, b Architecture, Art and even areas of Music. It has many intersting mathematical and geometric properties, such as conjugation, iteration and alternate forms. In engineering areas
Message Length Reduction
x 10
2.4
0
20
40
60
80
100
CLuster No.
Figure 4: Mixture model training illustrating the reduction of the total message length
some researchers also have utilised the golden ratio in declustering for ranged queries in computer [Bhatia et al., 2000] and for Nondeterministic Computation [Fortnow and van Melkebeek, 2000]. To determine the cluster number, we normalise the range of message lengths to the same scale as maximum number of clusters, (100). Since the ϕ ≈ 0.618, the threshold for flat enough is taken as 1 − ϕ ≈ 0.382 . In other words, when rate of (normalised) message length decrease is less than 0.382, the curve is judged to be flat enough. In an attempt to be conservative with this procedure, the first larger model size after this point is selected. Accordingly for these data, the selected mixture model contains 20 dynamic modes or clusters; this represents an improved generality compared with the 28 clusters found in earlier work.
5.3
Recognition
After reforming this target mixture model (20 clusters), the labels used to identify each of the individual clusters are inversely reordered with respect to their abundance in the model. Thus the lower the cluster ID the greater its abundance within the final model. Subsequently, this final model is utilised in a predictive application on new, unseen data from the same 3 individuals, the outcomes of which are shown as cluster ID sequences. These were subsequently summarised as regular expressions, and detailed as finite state machines for each behavioural task, as seen in Figure 5. Here subtle variations of the set tasks can be readily observed as the differing coloured edges in each FSM. In Figure 5, the blue ellipses and directed edges indicate the behaviour recognition for first person, and red hexagons are for the second person while green diamonds for the third person. From the FSMs (flow charts), it is clear that different people perform similar cluster sequence for the same behaviour.
ZigZag
10
7
60
7
50
16
4
4
2
1
40
4 30
5
3
Yaw
15
20
5
9
6
5 10
12
17
6
6 5
0
6 14
9
−10 −10
3
3
0
3
(a) Grab
1
(b) Push
2
3
2
1
0
4
5
7
6
Roll
1
Figure 6: 3-D Euler trajectories for Zigzag behavioural task identifying common.
(c) Zigzag
Figure 5: FSM “flow charts” for 3 behaviours: (a) Grab (b) Push, and (c) Zigzag
However, certain specialisations of the major (common) sequence are also illustrated as divergent branches in each FSM. Alternatively, sequences within a common set of modes are observed to be quite distinct from each other. For example, after completing mode 4 in the Push sequence, the first person (blue), by passes mode 15 in preference for mode 5, whilst the second person (red) avoids mode 4 after proceeding from the starting pose of mode 7. In this case, the differences among clusters become an interesting issue. How far are these branches away from the mainstream? When can we say some branches do no matter to the recognition? In order to address these questions, we refer to the KL (Kullback Leibler) distance, which can be used to describe the similarity/dissimilarity between clusters (or their p.d.f.s). By representing differing clusters by different colours, we can visualise the composition of each task. In another words, if behaviours can be described by sequences of different clusters, we can treat these clusters as our motion primitives. For example, as seen in Figure 6, if we plot only the recorded angles, in this case the ZigZag behaviour, within the Euler feature space, and also mark different cluster memberships with different appropriate colours, we can visually determine the temporal and multi dimensional make up or each behaviour. The colour trajectories in Figure 6 represent how the behaviour is achieved in the Euler angle space, and how the primitives change as the behaviour progresses in time. The size of each cluster is not fixed; it is determined automatically by the MML training process seeking to minimise the message length for the whole model. Every cluster is a set of combinations of both Euler angles and accelerations.
A more detailed perspective can be seen in Figure 7 were the behaviours are segmented by the variety and persistence of their respective clusters, within the mode or cluster sequence. Zigzag 100 80 Euler angles
1
2
60 40 20
Accelerations
2
10 Pitch
0 −20 0 20
Primitive ID
13
4
7
20
40
60
80
100
120
140
160
180
200
20
40
60
80 100 120 Time (1/100 s)
140
160
180
200
10
0
0
Figure 7: Zigzag frame based temporal-segment decompositions
5.4
Kullback Leibler distance
The KL distance is a natural distance function from a “true” probability distribution, p, to a “target” probability distribution, q. It can be interpreted as the expected extra message-length per datum due to using a code based on the wrong (target) distribution compared to using a code based on the true distribution [Duda et al., 2001]. An associated algorithm has been used to compute the various KL-distances between each pair of the modes in the mixture model, as seen in Table 1. As can be seen, this results in a 20x20 symmetric matrix, wherein each value represents how
Table 1: Normalised KL-distance matrix pertaining to the 20 mode mixture model
Table 2: Similarity scoring matrix for sequence alignment procedure Cluster 1 2 3 4 5 6 7 8 9 0 11 12 13 14 15 16 17 18 19 20
1 2 3 4 5 6 7 8 9 10 11 12 13 14 15 16 17 18 19 20
0 2 10 58 31 14 63 70 20 66 27 35 12 27 56 64 33 73 76 22
0 2 27 11 4 41 49 14 37 15 18 2 12 34 39 31 57 61 17
0 11 3 2 28 45 18 32 24 6 11 14 17 24 37 46 58 23
0 1 5 3 10 14 8 21 20 34 34 3 4 14 12 16 27
0 2 12 20 10 12 17 13 23 25 2 6 13 15 24 17
0 15 16 3 8 5 20 12 21 7 8 7 15 19 6
0 9 23 11 30 42 40 49 12 9 32 22 19 39
0 15 1 21 80 57 83 6 4 14 5 3 29
0 9 10 49 29 46 11 11 1 15 18 10
0 13 62 48 67 3 3 4 4 2 19
0 60 28 57 21 24 9 27 21 0
0 7 1 41 52 71 79 87 62
0 3 53 62 55 81 68 32
0 61 73 77 100 92 60
0 2 4 1 15 24
0 5 5 19 29
0 5 0 12 13 0 6 30 27 0
1 2 3 4 5 6 7 8 9 10 11 12 13 14 15 16 17 18 19 20
30 8 0 0 0 0 0 0 0 0 0 0 0 0 0 0 0 0 0 0
8 35 9 0 0 5 0 0 0 0 0 0 9 0 0 0 0 0 0 0
0 9 36 0 6 9 0 0 0 0 0 3 0 0 0 0 0 0 0 0
0 0 0 37 18 4 6 0 0 2 0 0 0 0 6 5 0 0 0 0
0 0 6 18 37 9 0 0 0 0 0 0 0 0 10 3 0 0 0 0
0 5 9 4 9 38 0 0 6 2 4 0 0 0 3 2 3 0 0 3
0 0 0 6 0 0 38 0 0 0 0 0 0 0 0 0 0 0 0 0
0 0 0 0 0 0 0 38 0 19 0 0 0 0 3 5 0 4 7 0
0 0 0 0 0 6 0 0 38 0 0 0 0 0 0 0 20 0 0 0
0 0 0 2 0 2 0 19 0 39 0 0 0 0 7 7 5 5 10 0
0 0 0 0 0 4 0 0 0 0 39 0 0 0 0 0 0 0 0 0
0 0 3 0 0 0 0 0 0 0 0 39 3 20 0 0 0 0 0 0
0 9 0 0 0 0 0 0 0 0 0 3 39 7 0 0 0 0 0 0
0 0 0 0 0 0 0 0 0 0 0 20 7 39 0 0 0 0 0 0
0 0 0 6 10 3 0 3 0 7 0 0 0 0 39 10 5 20 0 0
0 0 0 5 3 2 0 5 0 7 0 0 0 0 10 40 4 4 0 0
0 0 0 0 0 3 0 0 20 5 0 0 0 0 5 4 40 4 0 3
0 0 0 0 0 0 0 4 0 5 0 0 0 0 20 4 4 40 0 0
0 0 0 0 0 0 0 7 0 10 0 0 0 0 0 0 0 0 40 0
0 0 0 0 0 3 0 0 0 0 0 0 0 0 0 0 3 0 0 40
Cluster 1 2 3 4 5 6 7 8 9 10 11 12 13 14 15 16 17 18 19 20
dissimilar the two corresponding clusters (row and column) are. The higher the value, the more distinct or dissimilar the associated clusters are. If two clusters are essentially identical, the KL-distance is close to 0. For our 20 mode mixture model, the highest KL-distance is 834.6. For the sake of convenience, the entire KL-matrix is normalised accordingly [0, 100], and only keep the integer part. In considering the differences in behaviour mentioned earlier, we now able to review this in light of the KL-distances to determine whether a branch is far from mainstream. In particular the Push behaviour of Figure 5, we find a transition between cluster 4 and 15. First person performs 4, second person performs 15 and third person performs 4 and 15. However the dissimilarity between clusters 4 and 15 is only 3 out of 100, indicating that these modes are very close to each other, i.e. in terms of pose angles and accelerations.
6
Results analysis and discussions
Because only the Euler angles are influenced by orientation, all of these angles start from 0 in the sensor fusion step. Thus the trajectories seen in Figure 6 are actually offsets from the real Euler angle. To test whether the sensor is independent from its orientation, 10 further repeats were performed with the subject facing an orthogonal direction. By analysing the new data, the primitive sequences maintain a notable coherence within same style behaviour as before, whatever the orientation is. Several highly abundant subsequences could also be extracted as criterions for the behaviour styles. Both FSM and Markov Chain [Trivedi, 1982] will be utilised in further analysis particularly the conditions for primitive transitions within behaviours. In the bioinformatics field, sequence alignment is a very
Table 3: Similarity scores among differing behaviours from 3 subjects. (G, P or Z is short for 3 behaviours and 1, 2, 3 refer to 3 subjects)
Seq1 G1 G1 P1 P3 Z2 G1 G1 G1 G3
Seq2 G1 G3 P2 P2 Z3 P1 Z1 Z2 Z3
length 181 185 160 132 150 149 219 186 193
Score 6268 4971 3992 3617 4330 2578 2642 2331 2636
Similarity 98.30% 82.16% 86.87% 93.18% 92.00% 79.19% 63.93% 56.45% 61.33%
Score/S 3462 2687 2495 2740 2886 1730 1206 1253 1365
important concept, as it is routinely utilised in the comparison of different sequences from DNA, RNA and protein structures. Many algorithms have been developed to compare multiple sequences and or their sub-sequence structures. Interestingly these same bioinformatics algorithms can also be used to objectively measure similarity or differences between complex motion sequences in this current work. A similarity scoring matrix is built from both the MML model and KL-scores matrix in Table 2, and related sequence alignment application is applied to different outputs base on this scoring matrix. The alignment results contains several parts, similarity score, identity percent, similarity percent and gaps between sequence pairs. Generally for sequences of a certain length, the higher score between candidate pairs, the more similar two sequences are. The Table 3 contains some results from comparing different behaviours among 3 subjects. In Table 3 one can seen clearly that same behaviour from same subject (G1-
G1) has highest similarity rate and score per second. Same behaviour from different subjects (G1-G2, P1-P2) has about 80% similarity rate, with a 2500 to 3000 score per second. However, different behaviours from same subject (G3-Z3) or different behaviours from differing subjects (G1-Z2) have only some 60% similarity rate and only a 1200-1700 score per second. Figure 8 details the sequence alignment between Grab-Grab and Grab-Zigzag tasks. The highlighted verticalbars indicate identical primitive pairs between tasks, and the dots indicate similar pairs. From this it is quite clear that Grab-Grab has much more identical pairs and less gaps than Grab-Zigzag. Sequence #1: Grab_1 Sequence #2: Grab_2 Length #1: 185 Length #2: 185 Matrix: ScoreMatrix.Chao Gap open: 10.0 Gap extend: 0.5 Length: 185 Identity: 170/185 (91.89%) Similarity: 170/185 (91.89%) Gaps: 9/185 (4.86%) Score: 4850.93 Grab_1 Grab_2 Grab_1 Grab_2 Grab_1 Grab_2 Grab_1 Grab_2
1 AAAAAAAAAAAAAAAAAAAAAAAAAAAAA--XXXXXXXXXXXXXXXXXXE ||||||||||||||||||||||||||||| ||||||||||||||||||| AAAAAAAAAAAAAAAAAAAAAAAAAAAAAXXXXXXXXXXXXXXXXXXXXE 11 AAAAAAAAAAAAAAAAAAAAAAAAAAAAAXXXXXXXXXXXXXXXXXXXXE 49 EEEEGGGGGGGGGKKKKKKKKKKDDDDDDDDDFFFFFFFFFFFFFFFFFF .|||||||||||||||||| ||||||||||||||||||||| .....|||||||||||||||||| EEEEGGGGGGGGGKKKKKKKK FFFFFFFFFFFFFFFFFFF 61 EEEEGGGGGGGGGKKKKKKKK------FFFFFFFFFFFFFFFFFFFFFFF 99 FFFFYYNNNNNNNNNNNNNNNTTTTTTTTTTTTTTTTTTTTZZZZZZZZZ ||||. .|||||||||||||||| |||||||||||||||||||||||||||| ||||.|||||||||||||||| FFFFF FYNNNNNNNNNNNNNNN TTTTTTTTTTTTTTTTTTTZZZZZZZZZ 105 FFFFFYNNNNNNNNNNNNNNN-TTTTTTTTTTTTTTTTTTTZZZZZZZZZ 149 ZZZZZZZZZZZZZZZZZZZZZZZZZZZZZZZZZZZ ||||||||||||||||||||||||||||||||||| 154 ZZZZZZZZZZZZZZZZZZZZZZZZZZZZZZZZZZZ
48 60
148 153
183
Sequence #1: Grab_1 Sequence #2: Zigzag_1 Length #1: 122 Length #2: 122 Matrix: ScoreMatrix.mily Gap open: 10.0 Gap extend: 0.5 Length: 122 Identity: 25/122 (20.49%) Similarity: 71/122 (58.20%) Gaps: 40/122 (32.79%) Score: 1238.38
Grab_1 Zigzag_2 Grab_1 Zigzag_2
79
80 DFFFFFFFFFFFFFFFFFFFFFFYYNNNNNNNNNNNNNNNTTTTTTTTTT ......:::::::::::::::: ||||||||||||||| NNNNNNNNNNNNNNN 33 -GGGGGGNNNNNNNNNNNNNNNN--NNNNNNNNNNNNNNN----------
129
32
69
151 82
(b) Grab vs Zigzag Figure 8: The sequence alignment between different behavioural tasks
The similarity score can be used as another reliable criterion for the validation of candidate sequence analysis. It could also be utilised as a reference together with FSM rules for behaviour recognition.
7
[Babu, 2003] K.R. Babu, R.V.; Ramakrishnan. Compressed domain human motion recognition using motion history information. Image Processing, 2003. ICIP 2003. Proceedings. 2003 International Conference, 3:321– 324, 2003. [Bezdek and Hathaway, 1988] J. Bezdek and R. Hathaway. Recent convergence results for the fuzzy c-means clustering algorithms. Journal of Classification, 5:237–247, 1988. [Bezdek, 1981] J. Bezdek. Pattern recognition with fuzzy objective function algorithms. 1981.
[B.V., 2005] Xsens Technologies B.V. manual and tech. doc. 2005.
30 XXXXXXXXXXXXXXXXXXEEEEEGGGGGGGGGKKKKKKKKKKDDDDDDDD .||||||||| ::::::::::::::::::.....||||||||| GGGGGGGGGG 1 QQQQQQQQQQQQQQQQQQQQQGGGGGGGGGGG------------------
130 TTTTTTTTTTZZZZZZZZZZZZ |: |:::::::::::: TY 70 ---------TYYYYYYYYYYYY
[Amit and Matari, 2002] R. Amit and M. Matari. Learning movement sequences from demonstration. pages 203–208, 2002.
[Bhatia et al., 2000] R. Bhatia, R.K. Sinha, and C.-M. Chen. Declustering using golden ratio sequences. In Data Engineering, 2000. Proceedings. 16th International Conference on, pages 271–280, 29 Feb.-3 March 2000.
188
(a) Grab vs Grab
Zigzag_2
References
98 104
,
Grab_1
in its complexity. Developing, or discovery strategies in order to overcome such issues, and improve the models perception for implementation in robotic contexts, is a motivating challenge for the immediate future.
Future Work
The work mentioned in this paper shows how we model and distinguish human arm behaviours with a single MTx sensor. In future investigations, up to ten additional sensor units will be utilised, installing these on various parts of a subjects body, in order to capture and study more general contexts of coordinated multifaceted of human behaviours. As the number of sensors increase, the model will also increase
Mti and mtx user
[Duda et al., 2001] Richard O. Duda, Peter E. Hart, and David G. Stork. Pattern Classification. John Wiley & Sons, Inc, 2nd edition, 2001. [Dunn, 1973] J. Dunn. A fuzzy relative of the isodata process and its use in detecting compact, well-separated clusters. Journal of Cybernetics, 3:32–57, 1973. [Fortnow and van Melkebeek, 2000] L. Fortnow and D. van Melkebeek. Time-space tradeoffs for nondeterministic computation. In Computational Complexity, 2000. Proceedings. 15th Annual IEEE Conference on, pages 2–13, 4-7 July 2000. [Fuentes and Nelson, 1996] O. Fuentes and R. C. Nelson. Learning dextrous manipulation skills using multisensory information. pages 342–348, 1996. [Haga et al., 2004] T. Haga, K. Sumi, and Y. Yagi. Human detection in outdoor scene using spatio-temporal motion analysis. Pattern Recognition, 2004. ICPR 2004. Proceedings of the 17th International Conference, 4:331 – 334, 2004. [Haibing and Guangyou, 2002] Ren Haibing and Xu Guangyou. Human action recognition with primitivebased coupled-hmm. 2:494–498 vol.2, 2002.
[Inamura et al., 2004] T. Inamura, Y. Nakamura, and I. Toshima. Embodied symbol emergence based on mimesis theory. International Journal of Robotics Research, 23:363–377, 2004. [Kumar et al., 2004] S. Kumar, D. K. Kumar, A. Sharma, and N. McLachlan. Classification of hand movements using motion templates and geometrical based moments. pages 299–304, 2004. [Matsui et al., 2005] D. Matsui, T. Minato, K.F. Macdorman, and H. Ishiguro. Generating natual motion in an android by mapping human motion. 2005. [Morrow, 1997] James Daniel Morrow. Sensorimotor Primitives for Programming Robotic Assembly Skills. PhD thesis, Carnegie Mellon University, 1997. [Mukai et al., 1993] T. Mukai, T. Mori, and M. Ishikawa. A sensor fusion system using mapping learning method. 1:391–396 vol.1, 1993. [Nakazawa et al., 2003a] A. Nakazawa, S. Nakaoka, and K. Ikeuchi. Synthesize stylistic human motion from examples. 3:3899–3904 vol.3, 2003. [Nakazawa et al., 2003b] A. Nakazawa, S. Nakaoka, T. Shiratori, and K. Ikeuchi. Analysis and synthesis of human dance motions. pages 83–88, 2003. [Nascimento et al., 2000] S. Nascimento, B. Mirkin, and F. Moura-Pires. A fuzzy clustering model of data and fuzzy c-means. 2000. [Palm, 2003] R. Palm. Kinematic modeling of the human operator. Robotic Sensing, 2003. ROSE’ 03. 1st International Workshop, 2003.
[Reybet-Degat and Dubuisson, 1995] G. Reybet-Degat and B. Dubuisson. Multisensor fusion with a pattern recognition approach: parametric case. 2:1386–1391 vol.2, 1995. [Smith and W, 1962] K.U Smith and H. Smith W. Perception and Motor. W.B. Saunders, 1962. [Sukthankar and Sycara, 2005] G. Sukthankar and K. Sycara. A cost minimization approach to human behavior recognition. AAMAS?05, July, 2005. [Sun et al., 2006] Chao Sun, Fazel Naghdy, and David Stirling. Application of mml to motor skills acquisition. Joint International Conference on Computational Intelligence for Modelling, Control and Automation - CIMCA’2006 and International Conference on Intelligent Agents, Web Technologies and Internet Commerce - IAWTIC’2006, Sydney, Australia, 2006. [Trivedi, 1982] K. S. Trivedi. Probability and Statistics with Reliability, Queueing, and Computer Science Applications. Englewood Cliffs, NJ: Prentice-Hall, 1982. [Vapnik, 1995] V. Vapnik. The Nature of Statistical Learning Theory. Springer Verlag, New York, 1995. [Xinyu et al., 2005] Wu Xinyu, Ou Yongsheng, Qian Huihuan, and Xu Yangsheng. A detection system for human abnormal behavior. pages 1204–1208, 2005. [Zhongfei, 2002] Zhang Zhongfei. Mining surveillance video for independent motion detection. pages 741–744, 2002.